Perception to Adaptation of Climate Change in Nepal:
An Empirical Analysis Using Multivariate
Probit Model
Arun GC and Jun-Ho Yeo *
Department of Agricultural Economics, Kyungpook National Univeristy, 80 Daehakro, Daegu, Korea
* Correspondence: [email protected]
Received: 17 February 2019; Accepted: 28 February 2019;
First Version Published: 5 March 2019 (doi: 10.3390/sci1010012.v1) Second Version Published: 20 September 2019 (doi:10.3390/sci1030057)
Abstract: This study assessed farmers’ perception of climate change, estimated the determinants
of, and evaluated the relationship among adaptation practices using the multivariate probit model. A survey in 300 agricultural households was carried out covering 10 sample districts considering five agro-ecological zones and a vulnerability index. Four adaptation choices (change in planting date, crop variety, crop type and investment in irrigation) were deemed as outcome variables and socioeconomic, demographic, institutional, farm-level and perceptions variables were deployed as explanatory variables. Their marginal effects were determined for three climatic variables—temperature, precipitation and drought. Age, gender and education of head of household, credit access, farm area, rain-fed farming and tenure, are found to be more influential compared to other factors. All four adaptation-options are found to be complimentary to each other. Importantly, the intensity of impact of dependent variables in different models, and for available adaptation-options, are found to be unequal. Therefore, policy options and support facilities should be devised according to climatic variables and adaptation options to achieve superior results.
Keywords: adaptation; perception; climate change; Nepal; multivariate probit
1. Introduction
Climate change is having an affect worldwide, however, developing, landlocked and island countries, like Nepal, are more vulnerable [1,2] although the contribution of these countries is negligible [3,4]. Notably, it has been recognized as the major challenge of the era. Consequently, the Sustainable Development Goals (SDG) has incorporated Climate Action as a separate goal (Goal 13), recognizing the facts like- its potentiality to undermine the achieved economic gains; greater impacts in developing countries; over 100 million people may become poor and hungry by 2030, if urgent action is not taken, which was not included in the Millennium Development Goals (MDG) [5] Acknowledging the unique cause and effect relationship between agriculture and climate change, agriculture is the prime concern in climate change study. Firstly, it contributes one-third of all Greenhouse Gas (GHG) emissions, and among this, 86% is anthropogenic [6]. Secondly, agriculture and pasture claim around 1.3 billion hectares and 3.5 billion hectares respectively, suggesting it is the livelihood of a significant amount of the population [7]. Finally, the sector is responsible for feeding over nine billion people in the world by 2050 [8].
Change in cropping pattern, variations in crop yield, increase in the incidence of disease pest has been observed due to climate change [4]. Moreover, climate change and agriculture- mainly food security view point has been studied by various scholars [9–12]. Internalizing the potential impact of climate change in agriculture and ultimately on overall development, the SDG has incorporated both climate change and agriculture with due priority which could contribute to the sustainable development.
Sci2019,1, 57 2 of 12
Climate change adaptation is relatively a novel notion, which is broadly defined as the local-level adjustments to tackle changes under given socioeconomic constraints [5,13,14]. Although climate change adaptation literature has increased recently, measuring determinants are still relatively scarce [13]. Among them, the majority of studies are focused in Africa [15–19]. Yegbemey et al. (2013) assessed the farmers’ decisions to adapt to climate change in maize farming of the West Africa. Mulwa et al. (2017) examined the role of household and farm characteristics along with information in Malawi. Nhemachena et al. (2014) analyzed the determinants of adaptation at farm-level in South Africa. Likewise few studies has been carried out in Asia. Ung et al. (2016) studied climate change adaptation in costal Cambodia [20]. Gentle and Maraseni (2012) have studied adaptation practices in rural mountain community in Nepal [21].
Nepal is among one of the highly vulnerable countries due to climate change [22,23] and its vulnerability is heightening owing to several physical and socioeconomic constraints [2,4,24], where climatic change has already been observed and recorded. Moreover, trend analysis of the period 1975–2005 found an annual average temperature increase by 0.06◦C, whereas a mean precipitation decline by 3.7 mm per month per decade [3]. Likewise, by 2060, the predicted increase in annual mean temperature is 1.3–3.8◦C under various scenarios, whereas annual average precipitation was projected to be shrunken by 10% to 20% [3]. Consequently, the short-supply of water, extreme weather and increased incidence of disease-pests are affecting agriculture because of climate change, and thus food security is seriously threatened [22].
Since Nepal is indexed as highly vulnerable, comprehensive study on climate change is urgent and agriculture is a critical area to consider regarding climate change [25]. However, previous studies are mostly descriptive [2,26–28], and a few studies which tried to determine factors affecting adaptations were focused on a specific locality [13,29]. Therefore, this study covers a broader perspective at the national level, and deployed several factors affecting adaptation choice of farmers, which were not considered before.
2. Materials and Methods
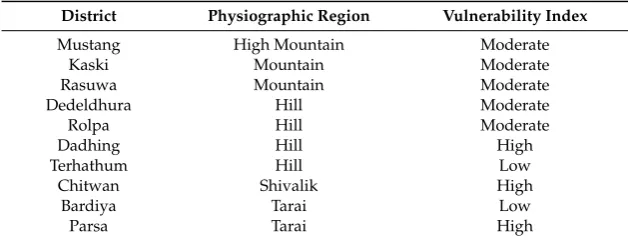
Nepal has five physiographic regions—High Mountain, Mountain, Hill, Shivalik and Terai [24]. Table1presents the sample districts, physiographic regions and vulnerability index from the National Adaptation Programme of Action (NAPA).
Table 1.Sample districts.
District Physiographic Region Vulnerability Index
Mustang High Mountain Moderate Kaski Mountain Moderate Rasuwa Mountain Moderate Dedeldhura Hill Moderate Rolpa Hill Moderate
Dadhing Hill High
Terhathum Hill Low Chitwan Shivalik High
Bardiya Tarai Low
Parsa Tarai High
A pilot was carried out in Dadhing, and a household survey was conducted from January 2015 to June 2015 adopting a random sampling technique. Per district, 30 households were picked to sum up 300 households, and respondents were asked whether they perceived the change in climate with a possible answer of yes or no. If they perceived the changes, then they were further asked whether they adopted given sets of adaptation options with possible answers of yes or no.
deterministic problem, a maximum likelihood estimation technique could be deployed and to overcome heteroskedasticity, either logit or probit estimations could be employed [30]. The next alternative is a univariate model, however it cannot measure the potential correlation among the unobserved disturbance and relationship between different choices [32]. To overcome this drawback, the multivariate probit model (MVP) could be employed [13,17,32].
The MVP is a binary response regression model used to estimate both observed and unobserved influence on dependent variables by several independent variables simultaneously, which permits error terms to correlate freely [33–35].
The general specification for the MVP is [31]
y∗m = x0mβm+εm, ym = 1i f y∗m>0, 0otherwise, m = 1, . . . ., M, (1)
E[εm|x1,. . .,xM] = 0 Var[εm|x1,. . .,xM] = 1 Covhεjεm
x1,. . .,xM i
= ρjm
(ε1,. . . .,εM) ∼NM[0,R]
wherexis a matrix of covariates, consisting any categorical variables,βis matrix of unknown regression coefficients andεmis residual error. R is the variance-covariance matrix. The off-diagonal elements in
correlation matrixρjmrepresent the unobserved correlation between the stochastic component of the
jth and mth options [13].
The marginal effects of independent variables on the propensity to adopt different adaptation options were calculated by the following equation [17].
∂Pi
∂xi = ϕ(x 0
β)βi,i = 1, 2, 3,. . . .,n (2)
wherePiis the likelihood of eventiwhich increases adoption of each adaptation option, andϕ(.)is the standard univariate normal density distribution function.
For data analysis STATA 13.0 was employed, and to get consistent estimates the number of draws was set to 100 which is five by default [13,36].
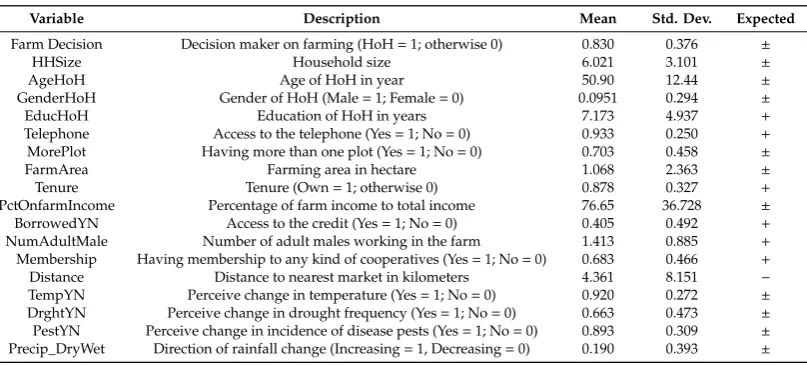
Factors affecting the choice of adaptation practices were taken as explanatory variables, as described in Table2with the expected relationship. Importantly, there is lack of straightforward theory regarding selection of predictors [17], however, several previous empirical studies have enabled the nomination appropriate predictors.
Table 2.Explanatory variables.
Variable Description Mean Std. Dev. Expected
Farm Decision Decision maker on farming (HoH=1; otherwise 0) 0.830 0.376 ±
HHSize Household size 6.021 3.101 ±
AgeHoH Age of HoH in year 50.90 12.44 ±
GenderHoH Gender of HoH (Male=1; Female=0) 0.0951 0.294 ±
EducHoH Education of HoH in years 7.173 4.937 +
Telephone Access to the telephone (Yes=1; No=0) 0.933 0.250 +
MorePlot Having more than one plot (Yes=1; No=0) 0.703 0.458 ±
FarmArea Farming area in hectare 1.068 2.363 ±
Tenure Tenure (Own=1; otherwise 0) 0.878 0.327 +
PctOnfarmIncome Percentage of farm income to total income 76.65 36.728 ± BorrowedYN Access to the credit (Yes=1; No=0) 0.405 0.492 +
NumAdultMale Number of adult males working in the farm 1.413 0.885 + Membership Having membership to any kind of cooperatives (Yes=1; No=0) 0.683 0.466 +
Sci2019,1, 57 4 of 12
3. Results
Climate change perception was assessed among farmers using three climatic variables instead of asking directly whether they were perceiving climate change. The majority of the population perceived temperature alteration (92%), precipitation change (87.67%) and change in drought frequency (66.76%).
Among the farmers who perceived temperature alteration, a higher proportion (84.12%) reported an increasing trend and 63.88% responded that precipitation is decreasing. Similarly, 81% of farmers confirmed that the frequency of drought is increasing.
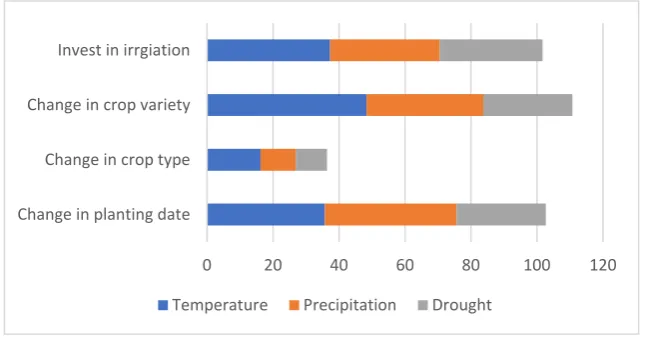
The adoption of adaptation options according to the change in climatic variabilities are presented in the Figure1. The results showed that investment in irrigation facilities are the most common adaptation practice against change in temperature and change in drought. Likewise, change in planting date is the most famous adaptation option against change in precipitation. Change in crop type was found the least common adaptation option against all kinds of climatic variabilities.
Sci 2019, 1 4 of 13
NumAdultMale Number of adult males working in the farm 1.413 0.885 +
Membership Having membership to any kind of cooperatives
(Yes = 1; No = 0) 0.683 0.466 + Distance Distance to nearest market in kilometers 4.361 8.151 − TempYN Perceive change in temperature (Yes = 1; No = 0) 0.920 0.272 ±
DrghtYN Perceive change in drought frequency
(Yes = 1; No = 0) 0.663 0.473 ±
PestYN Perceive change in incidence of disease pests
(Yes = 1; No = 0) 0.893 0.309 ±
Precip_DryWet Direction of rainfall change
(Increasing = 1, Decreasing = 0) 0.190 0.393 ±
3. Results
Climate change perception was assessed among farmers using three climatic variables instead of asking directly whether they were perceiving climate change. The majority of the population perceived temperature alteration (92%), precipitation change (87.67%) and change in drought frequency (66.76%).
Among the farmers who perceived temperature alteration, a higher proportion (84.12%) reported an increasing trend and 63.88% responded that precipitation is decreasing. Similarly, 81% of farmers confirmed that the frequency of drought is increasing.
The adoption of adaptation options according to the change in climatic variabilities are presented in the Figure 1. The results showed that investment in irrigation facilities are the most common adaptation practice against change in temperature and change in drought. Likewise, change in planting date is the most famous adaptation option against change in precipitation. Change in crop type was found the least common adaptation option against all kinds of climatic variabilities.
Figure 1. Adoption of adaptation options against change in climatic variables.
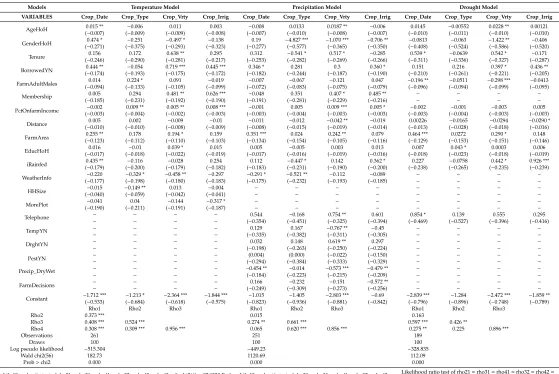
The null hypothesis for test of independence was rejected for all models, as the likelihood ratio test (Prob > χ2 = 0.0000) of independence of error terms is significant. Thus, use of MVP is justified
indicating that the model is capturing wider effects than the single equation-probit model could obtain. Thus, the equations are inter-dependent. Similarly, all pairwise correlation coefficients (Rho), which are presented in Table 3, are positive and mostly highly significant. It indicates that all four sets of adaptation options are complimentary to each other.
3.1. Determinants of Climate Change Adaptation
Table 3 presents the determinants of climate change adaptation for change in temperature, change in precipitation and change in drought frequencies—called as temperature model, precipitation model and drought model. Each model has four dependent variables—change in cropping date (Crop_Date), change in crop type (Crop_Type), change in crop variety (Crop_Vrty)
0 20 40 60 80 100 120
Change in planting date Change in crop type Change in crop variety Invest in irrgiation
Temperature Precipitation Drought
Figure 1.Adoption of adaptation options against change in climatic variables.
The null hypothesis for test of independence was rejected for all models, as the likelihood ratio test (Prob>χ2=0.0000) of independence of error terms is significant. Thus, use of MVP is justified indicating that the model is capturing wider effects than the single equation-probit model could obtain. Thus, the equations are inter-dependent. Similarly, all pairwise correlation coefficients (Rho), which are presented in Table3, are positive and mostly highly significant. It indicates that all four sets of adaptation options are complimentary to each other.
3.1. Determinants of Climate Change Adaptation
Table3presents the determinants of climate change adaptation for change in temperature, change in precipitation and change in drought frequencies—called as temperature model, precipitation model and drought model. Each model has four dependent variables—change in cropping date (Crop_Date), change in crop type (Crop_Type), change in crop variety (Crop_Vrty) and change in investment on irrigation (Crop_Irrig). Important to note, each independent variable has different level of influence on different dependent variables in different models.
farming decision taken by head of household produced mostly negative implication for adaption in the temperature model and rest have positive implication.
In the precipitation model, perception of more precipitation and gender of head of household were found the most influencing determinants having significant effect for three dependent variables. Tenure, credit access, membership, percentage of farm income, total farming area, having rainfed farming and access to the weather information have yielded significant result for at least two dependent variables. Likewise, perceiving change in temperature and drought, farm decision taken by head of household, age of head of household, access to telephone and nearest distance to the market produced significant result for at least one dependent variable. However, number of adult male working in the farm and perception of change in disease pest did not yield any significant result for any dependent variable. Regarding the direction of influence, credit access, membership, percentage of farm income, farming area, perception of change in drought, age of head of household and telephone access exhibited positive relationship. However, tenure and rainfed farming produced mix result, and rest yielded negative relationship.
In the drought model, tenure, credit access, number of adult male working in the farm, farming area and rainfed farming were found most influencing determinants which have yielded significant results with at least two dependent variables and percentage of farm income produced no significant results. Rest factors yielded at least one significant results for dependent variables. Regarding the direction of influence, only number of farm adult male, gender of head of household and distance to the nearest market had negative relationship and the rest have positive relationship.
3.2. Marginal Effects
The parameter estimates of the MVP give the likelihood of the outcomes’ occurrence. However, it cannot be quantified. Nevertheless, the marginal effect can be calculated for each model, which gives quantification of the influence of the variables.
3.2.1. Marginal Effect of the Temperature Change Model
Sci2019,1, 57 6 of 12
Table 3.Results of multivariate probit model (MVP) analysis of determinants of adaptation.
Models Temperature Model Precipitation Model Drought Model
VARIABLES Crop_Date Crop_Type Crop_Vrty Crop_Irrig Crop_Date Crop_Type Crop_Vrty Crop_Irrig Crop_Date Crop_Type Crop_Vrty Crop_Irrig
AgeHoH 0.015 ** −0.006 0.011 0.003 −0.008 0.0133 0.0187 ** −0.006 0.0145 −0.00552 0.0228 ** 0.00121 (−0.007) (−0.009) (−0.009) (−0.008) (−0.007) (−0.010) (−0.008) (−0.007) (−0.010) (−0.011) (−0.010) (−0.010) GenderHoH (0.474 *−0.271) (−−0.2510.375) (−−0.497 *0.293) (−−0.323)0.138 (−0.277)0.19 −(4.827 ***−0.577) −(−1.070 ***0.365) −(−0.706 **0.350) −(−0.08130.408) (−−0.0630.524) −(−1.422 **0.586) (−−0.4060.520)
Tenure 0.156 0.172 0.638 ** 0.295 0.312 −0.541 * 0.517 * −0.285 0.539 * −0.0639 0.542 * −0.171 (−0.246) (−0.290) (−0.281) (−0.217) (−0.253) (−0.282) (−0.269) (−0.266) (−0.311) (−0.336) (−0.327) (−0.287) BorrowedYN 0.444 ** −0.054 0.719 *** 0.445 *** 0.346 * 0.281 0.3 0.360 * 0.151 0.216 0.397 * 0.436 ** (−0.174) (−0.193) (−0.175) (−0.172) (−0.182) (−0.244) (−0.187) (−0.190) (−0.210) (−0.261) (−0.221) (−0.205) FarmAdultMales 0.014 0.224 * 0.091 −0.019 −0.007 −0.067 −0.121 0.047 −0.196 ** −0.0511 −0.298 *** −0.0413 (−0.094) (−0.133) (−0.105) (−0.099) (−0.072) (−0.083) (−0.075) (−0.079) (−0.096) (−0.094) (−0.099) (−0.095)
Membership 0.005 0.294 0.481 ** 0.626 *** −0.048 0.351 0.407 * 0.485 ** − − − −
(−0.185) (−0.231) (−0.192) (−0.190) (−0.191) (−0.281) (−0.229) (−0.216) − − − −
PctOnfarmIncome (−−0.0020.003) (0.009 **−0.004) (0.005 **−0.002) 0.008 ***(−0.003) (−−0.003)0.001 (−0.0050.004) 0.009 ***(−0.003) (−0.005 *0.003) (−−0.003)0.002 (−−0.0010.004) (−−0.003)0.003 (−0.0050.003)
Distance (−0.0050.010) (−0.0020.010) (−−0.0090.008) (−−0.009)0.01 (−−0.008)0.011 (−−0.015)0.012 −(−0.042 **0.019) (−−0.0190.014) (0.00226−0.013) (−−0.01650.028) (−−0.02940.018) −(−0.0290 *0.016)
FarmArea 0.255 ** 0.178 0.194 * 0.159 0.351 *** 0.024 0.242 ** 0.079 0.464 *** 0.0272 0.290 * 0.148 (−0.123) (−0.112) (−0.110) (−0.103) (−0.134) (−0.154) (−0.105) (−0.116) (−0.129) (−0.153) (−0.151) (−0.146)
EducHoH 0.016 −0.01 0.039 * 0.015 0.005 −0.005 0.003 0.013 0.007 0.043 * 0.0003 0.006 (−0.017) (−0.018) (−0.022) (−0.019) (−0.017) (−0.016) (−0.019) (−0.016) (−0.018) (−0.023) (−0.018) (−0.019) iRainfed 0.435 ** −0.116 −0.028 0.254 0.112 −0.447 * 0.142 0.362 * 0.227 −0.0758 0.442 * 0.926 *** (−0.179) (−0.200) (−0.179) (−0.182) (−0.183) (−0.231) (−0.190) (−0.200) (−0.238) (−0.265) (−0.235) (−0.239) WeatherInfo −0.220 −0.329 * −0.458 ** −0.297 −0.291 * −0.521 ** −0.112 −0.089 − − − −
(−0.177) (−0.198) (−0.180) (−0.183) (−0.175) (−0.232) (−0.193) (−0.185) − − − −
HHSize (−−0.040)0.015 −(−0.149 **0.059) (−0.0130.042) (−−0.041)0.004 −− −− −− −− −− −− −− −−
MorePlot (−−0.190)0.041 (−0.211)0.04 (−−0.191)0.144 (−−0.317 *0.187) −− −− −− −− −− −− −− −−
Telephone −− −− −− −− 0.544 −0.168 0.754 ** 0.601 0.854 * 0.139 0.555 0.295
(−0.354) (−0.451) (−0.325) (−0.394) (−0.469) (−0.527) (−0.396) (−0.416)
TempYN − − − − 0.129 0.167 −0.767 ** −0.45 − − − −
− − − − (−0.335) (−0.382) (−0.311) (−0.305) − − − −
DrghtYN − − − − 0.032 0.148 0.619 ** 0.297 − − − −
− − − − (−0.198) (−0.263) (−0.250) (−0.224) − − − −
PestYN −− −− −− −− (0.004) (0.000) (−0.022) (−0.150) − − − −
(−0.294) (−0.384) (−0.333) (−0.329) − − − −
Precip_DryWet − − − − −0.454 ** −0.014 −0.573 *** −0.479 ** − − − −
− − − − (−0.184) (−0.223) (−0.215) (−0.209) − − − −
FarmDecisions −− −− −− −− (−0.1660.249) (−−0.309)0.232 (−−0.1510.273) −(−0.572 **0.256) −− −− −− −−
Constant −(1.712 ***−0.533) −(−1.213 *0.684) −(2.364 ***−0.618) −(1.844 ***−0.575) (−−0.823)1.015 (−−1.4050.936) −(−2.803 ***0.881) (−−0.842)0.69 −(−2.839 ***0.796) (−−1.2840.896) −(2.472 ***−0.748) −(−1.859 **0.789)
Rho1 Rho2 Rho3 Rho1 Rho2 Rho3 Rho1 Rho2 Rho3
Rho2 0.373 *** 0.015 0.163
Rho3 0.408 *** 0.524 *** 0.274 ** 0.661 *** 0.597 *** 0.426 **
Rho4 0.308 *** 0.309 *** 0.956 *** 0.065 0.620 *** 0.856 *** 0.275 ** 0.225 0.896 ***
Observations 261 251 189
Draws 100 100 100
Log pseudo likelihood −515.304 −449.23 −328.835
Wald chi2(56) 182.73 1120.69 112.09
Prob>chi2 0.000 0.000 0.000
Likelihood ratio test of rho21=rho31=rho41=rho32=rho42=rho43=0: chi2(6)=87.9323 Prob
>chi2=0.000 Robust standard errors in parentheses ***p<0.01, **p<0.05, *p<0.1
Likelihood ratio test of rho21=rho31=rho41=rho32=rho42=
rho43=0: chi2(6)=72.666 Prob>chi2=0.000
Likelihood ratio test of rho21=rho31=rho41=rho32=rho42=
rho43=0: chi2 (6)=56.6392 Prob>chi2=0.0000 Robust standard errors in parentheses; ***p<0.01, **p<0.05, *p<0.1
Table 4.Marginal effect after multivariate probit analysis due to change in temperature.
y=Linear Prediction (Predict)=−0.38318332
Variable dy/dx Std. Err. z P>z 95% C.I. X
AgeHoH 0.015 0.007 2.14 0.033 0.001 0.028 50.536 GenderHoH * 0.474 0.271 1.75 0.081 −0.058 1.005 0.01
EducHoH 0.016 0.017 0.95 0.343 −0.017 0.048 7.215
FarmArea 0.255 0.123 2.08 0.037 0.015 0.496 0.933 Tenure * 0.156 0.246 0.64 0.525 −0.325 0.637 0.866
PctOnfarmIncome −0.002 0.003 −0.94 0.35 −0.008 0.003 70.876
BorrowYN * 0.445 0.174 2.56 0.011 0.104 0.785 0.399 HHSize −0.016 0.04 −0.38 0.702 −0.095 0.064 5.927
Membership * 0.005 0.185 0.02 0.98 −0.359 0.368 0.69
Distance 0.005 0.01 0.44 0.661 −0.016 0.025 4.308
Weatherinfo * −0.220 0.177 −1.24 0.214 −0.567 0.127 0.667
iRainfed * 0.435 0.18 2.42 0.015 0.083 0.786 0.628 MorePlot * −0.041 0.19 −0.22 0.829 −0.413 0.331 0.694
FarmAdultMales 0.014 0.094 0.15 0.881 −0.170 0.198 2.157 (*) dy/dx is for discrete change of dummy variable from 0 to 1.
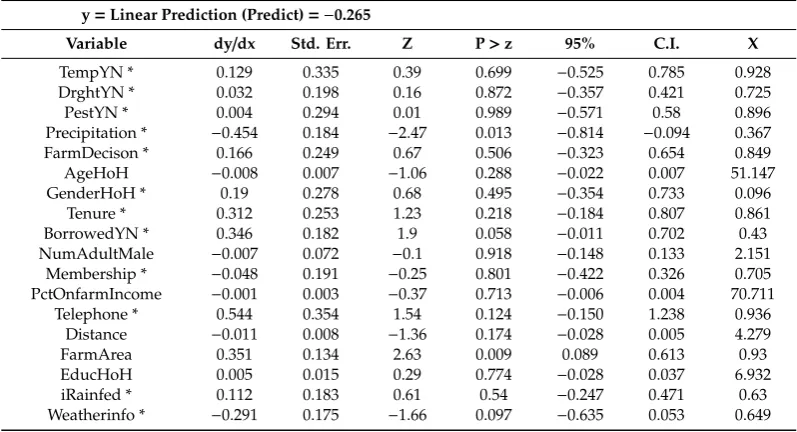
3.2.2. Marginal Effect for Precipitation Model
The result of marginal effect for precipitation model is presented in Table 5. Perception of temperature and drought frequency changes, farming decision by HoH, female as HoH, own-land, credit and telephone access, farm area, education of HoH and rain-fed farming system increase the probability of adaptation against precipitation. Similarly, higher precipitation, age of HoH, number of adult males, membership, percentage of farm income and distance decrease possibility of adaptation. Moreover, possessing telephone boosts the probability of adaptation by 0.544, which is the highest influence among the explanatory variables followed by farming area, access to credit and tenure. Similarly, increase in each hectare of land increases the probability of adaptation by 0.351 and if household has credit access and has own farming land, the probability of adaptation increases by 0.346 and 0.312 respectively. The highest negative influencing factor is increasing rainfall (0.454).
Table 5.Marginal effect after multivariate probit analysis due to change in precipitation.
y=Linear Prediction (Predict)=−0.265
Variable dy/dx Std. Err. Z P>z 95% C.I. X
TempYN * 0.129 0.335 0.39 0.699 −0.525 0.785 0.928
DrghtYN * 0.032 0.198 0.16 0.872 −0.357 0.421 0.725
PestYN * 0.004 0.294 0.01 0.989 −0.571 0.58 0.896
Precipitation * −0.454 0.184 −2.47 0.013 −0.814 −0.094 0.367
FarmDecison * 0.166 0.249 0.67 0.506 −0.323 0.654 0.849
AgeHoH −0.008 0.007 −1.06 0.288 −0.022 0.007 51.147
GenderHoH * 0.19 0.278 0.68 0.495 −0.354 0.733 0.096
Tenure * 0.312 0.253 1.23 0.218 −0.184 0.807 0.861
BorrowedYN * 0.346 0.182 1.9 0.058 −0.011 0.702 0.43
NumAdultMale −0.007 0.072 −0.1 0.918 −0.148 0.133 2.151
Membership * −0.048 0.191 −0.25 0.801 −0.422 0.326 0.705
PctOnfarmIncome −0.001 0.003 −0.37 0.713 −0.006 0.004 70.711
Telephone * 0.544 0.354 1.54 0.124 −0.150 1.238 0.936
Distance −0.011 0.008 −1.36 0.174 −0.028 0.005 4.279
FarmArea 0.351 0.134 2.63 0.009 0.089 0.613 0.93 EducHoH 0.005 0.015 0.29 0.774 −0.028 0.037 6.932
iRainfed * 0.112 0.183 0.61 0.54 −0.247 0.471 0.63
Sci2019,1, 57 8 of 12
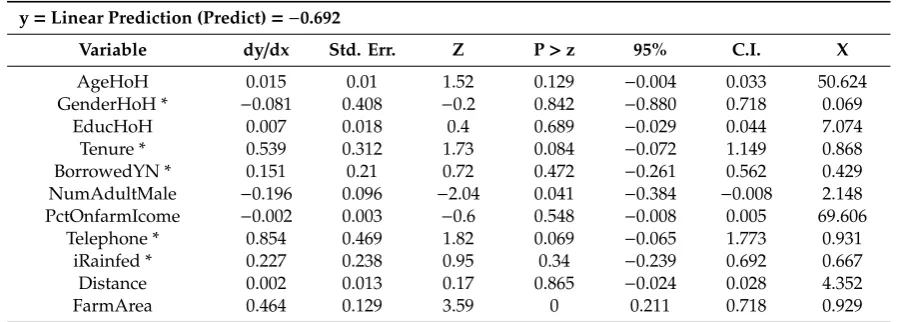
3.2.3. Marginal Effect for the Drought Model
The result of the marginal effect for drought model is presented in Table6. Except gender of HoH, adult male and percentage of farm income, all variables are imparting positive influence. Moreover, possession of a telephone is quite an influencing factor, indicating households having a telephone increases the probability of adaptation by 0.854. Then, it is followed by tenure and farming area. Furthermore, if a household has its own farming land, the probability of adaptation increases by 0.539. Similarly, for every additional one-hectare land, the probability of adoption increases by 0.464. In the case of negative influence, the number of male adults is the highest. Increasing male adult in farming by one decreases the probability of adoption by 0.200.
Table 6.Marginal effect after multivariate probit analysis due to change in frequency of drought.
y=Linear Prediction (Predict)=−0.692
Variable dy/dx Std. Err. Z P>z 95% C.I. X
AgeHoH 0.015 0.01 1.52 0.129 −0.004 0.033 50.624
GenderHoH * −0.081 0.408 −0.2 0.842 −0.880 0.718 0.069
EducHoH 0.007 0.018 0.4 0.689 −0.029 0.044 7.074
Tenure * 0.539 0.312 1.73 0.084 −0.072 1.149 0.868
BorrowedYN * 0.151 0.21 0.72 0.472 −0.261 0.562 0.429
NumAdultMale −0.196 0.096 −2.04 0.041 −0.384 −0.008 2.148 PctOnfarmIcome −0.002 0.003 −0.6 0.548 −0.008 0.005 69.606
Telephone * 0.854 0.469 1.82 0.069 −0.065 1.773 0.931
iRainfed * 0.227 0.238 0.95 0.34 −0.239 0.692 0.667
Distance 0.002 0.013 0.17 0.865 −0.024 0.028 4.352
FarmArea 0.464 0.129 3.59 0 0.211 0.718 0.929
(*) dy/dx is for discrete change of dummy variable from 0 to 1.
4. Discussion
4.1. Household Characteristics
Age of HoH is mostly found positive for all choices against all changes, meaning the older the head of the household, the more likely the chance for adaptation. However, the negative coefficient of age for various adaptations, might be supported by the fact that youth are relatively innovative as compared to older generations [13,37], and the positive association of age and adaptation practices might be due to experiences, cumulative knowledge and skills [38]. Furthermore, also in previous literature, the influence of age was both positive [16,17,38] and negative [13,18,37,39].
Gender of HoH is commonly found to be negatively associated for all adaptation choices except for change in crop date adjustment against change in temperature and precipitation. It signifies female-headed households are less likely to adopt given choices. Nevertheless, a few studies highlighted that female-headed household are highly expected to adopt crop diversification due to higher experience and information on various management practices [18]. Likewise, male-headed households are highly adaptive to resource-intensive decisions, like change in crop type and irrigation investment due to resource endowment [16] and probably a consequence of social structure.
Except for the crop type change against temperature and precipitation alteration, education of HoH is positively associated with all adaptation options against all changes. In general, the higher the education, the higher the chance of adaptation. Similarly, the majority of previous literature also reported mixed results for education [13,17,38].
Percentage of total income coming from the farm is positively correlated with all adaptation choices except change in crop date. However, in the drought model, for all choices, it is not significant. More importantly, it means that the higher the income coming from the farm, the greater the likelihood of adoption of adaptation alternatives. Apparently, the higher the percentage of farm income, the lower the livelihood diversification and consequently, the higher dependency on farming leads to higher chances of adaptation [16].
The farm decision is negatively associated with all coping strategies except crop date adjustment and is significant for irrigation investment. It suggests that HoH is not interested in a change in farming system. As previously discussed in the age factor, the older generation is reluctant towards changes. Moreover, it might be supported by education level, where the older generation is less educated, and those who are educated are likely to adopt those adaptations.
4.2. Farm Characteristics
In all cases, adaptation choices and farming area are positively associated, implying increasing area elevates the chances of adaptation. Similar results were reported by some previous studies [35]. However, several other studies reported mixed results [13,18,38].
For the temperature model, absence of additional plots reduces the chances of adaptation, except for change in crop type. However, only irrigation investment is significant. If the household has additional plots, they are supposed to diversify the crop and this discourages them to invest in irrigation, which might be associated with cost of irrigation for fragmented land. Likewise, certain studies also produced mixed influence for additional plots [18].
For the exclusively rain-fed farming system, all adaptation options are positively associated except for a few, and are not significant. It signifies that exclusively rain-fed farming is more vulnerable, and it encourages farmers to adopt adaptation options.
In the case of tenure, generally, if farmers are farming on their own land, they are found more adaptive, except for change in crop type against precipitation alteration. It implies that farmers hesitate to invest in others’ land, despite climatic adversities, and similar results were reported previously [19,41].
The number of adult males in the farm is positively associated in the temperature model, negatively associated in the drought model and not significant in the precipitation model. Moreover, also in the previous study, the influence of male adults working on farms is not consistent.
4.3. Household Access
The credit access of the household is found to be positive for all choices in all models, except change in crop type against temperature alteration. However, it is not significant. Thus, it implies that having credit access increases the likelihood of adaptation. Moreover, a few previous studies reported all positive or mostly positive association of credit access in adaptation [17–19,38].
Having telephone access to the household is found to be positively associated with all adaptation options. The access to the telephone is two-way communication, and more effective than one-way communication. The positive relationship might be a result of the interaction between famers and agro-vets, which sell inputs in their locality.
The distance to the nearest market is generally negatively correlated to all adaptation options except for a few, which are not significant. Ordinarily, the relationship is—the farther the markets, the lesser the likelihood of adaptation because of the lower level of commercialization. However, the positive influence of market on change in crop type could be associated with crop diversification [18].
Sci2019,1, 57 10 of 12
Surprisingly, access to the weather information is negative in all cases, which could be due to ineffective weather information systems and lower dependency of farmers on provided weather information or ignorance by famers due to lower reliability. However, the previous studies also produced a negative relationship of weather information on certain adaptation options [13,16,18,38].
4.4. Climate Perception Factors
The perception of temperature change was used in the precipitation model only and it produced mixed results. Its presence is expected to increase adoption of crop date adjustment and crop type alteration, but unlikely to adopt change in crop variety and irrigation investment.
When farmers perceived change in drought frequency, they are expected to adopt given sets of coping strategies.
All adaptation options are negatively linked with perceived decreased precipitation and, except for change in crop type, all are highly significant which is probably connected to the fact of limited irrigation facility and higher dependency on rainfall. Consequently, limited irrigation facilities and decreasing rainfall is anticipated to encourage farmers to invest in irrigation.
5. Conclusions
The perception of climate change was assessed, the factors influencing climate change adaptation were identified and its marginal effect was determined using the multivariate probit model for Nepal. The large majority of respondents replied that they observed alteration in climatic variables—temperature, precipitation and drought. However, direction of changes is not univocal. Among others, gender, age and education level of the HoH, credit access, exclusively rain-fed farming, farm area, weather information, and additional plots are found to be influencing on perception. Furthermore, gender of HoH influence on perception is not uniform. Despite differences in proportions, a greater number of the younger generation replied that they observed changes. Regarding educational influence, generally, the higher the education the higher the response for conforming changes. Similarly, experience, composite of education and age, is positively associated with perception. Despite wider perception of climate change, the adaptation was not common, which is backed by less than a 50% adoption rate. Change in crop variety is the most popular against change in temperature; however, change in planting date is common against change in precipitation. As expected, irrigation investment was found to be the best adaptation option for increasing frequency of drought.
The likelihood ratio test of independence of error terms was rejected in all four MVPs, which justified the choice of the MVP over a single equation-probit model to capture the interaction of the adaptation options. For all MVPs, the four given adaptation options are complementary to each other since pair-wise correlation coefficient are positive.
For the superior adaptability, focusing on crucial factors is extremely essential. Age, gender and education of HoH, credit access, farming area, tenure and irrigation, are major determinants for all models and all adaptation options. Therefore, targeting experienced farmers for promotion of adaptation options increase the likelihood of adoption. The credit access is also playing a crucial role and having credit access increases the likelihood of adaptation. It could be coupled with membership, which might increase the likelihood of adaptation. The strong positive association of farming area and adaptation options is indicating that land consolidation likely to favor climate change adaptation. Conversely, land fragmentation is discouraging farmers to adopt and to invest. The results also identified that exclusively rain-fed and higher percentage of farm income in total household income is favoring adaptation, indicating poor farmers and having no irrigation facilities are having severe effects. Therefore, the government is encouraged to support poor farmers for year-round reliable irrigation facilities.
Funding:This research received no external funding.
Acknowledgments:We would like to acknowledge the Economics of Climate Change Adaptation (ECCA) Project of the UNDA for the data availability.
Conflicts of Interest:The authors declare no conflict of interest.
References
1. UNDP Sustainable Development Goals. Available online: http://www.undp.org/content/undp/en/home/ sustainable-development-goals/goal-13-climate-action.html(accessed on 3 September 2017).
2. Manandhar, S.; Vogt, D.S.; Perret, S.R.; Kazama, F. Adapting cropping systems to climate change in Nepal: A cross-regional study of farmers’ perception and practices.Reg. Environ. Chang.2011,11, 335–348. [CrossRef] 3. MoPE.Nationally Determined Contributions; Ministry of Population and Environment (MoPE), Government of
Nepal: Kathamandu, Nepal, 2016.
4. Chamling Rai, S.; Gurung, A. Raising awareness of the impacts of climate change: Initial steps in shaping policy in Nepal.Mt. Res. Dev.2005,35, 316–320.
5. UNDP.UNDP Support to the Implementation of Sustainable Development Goal 13; United Nations Development Program (UNDP): New York, NY, USA, 2016.
6. Gilbert, N.One-Third of Our Greenhouse Gas Emissions Come from Agriculture; Nature: London, UK, 2012. 7. Howden, S.M.; Soussana, J.-F.; Tubiello, F.N.; Chhetri, N.; Dunlop, M. Adapting agriculture to climate change.
Proc. Natl. Acad. Sci. USA2007,104, 19691–19696. [CrossRef] [PubMed]
8. FAO.High Level Expert Forum—How to Feed the World in 2050; United Nations Food and Agriculture Organization (FAO): Rome, Italy, 2009.
9. Porter, J.R.; Xie, L.; Challinor, A.J.; Cochrane, K.; Howden, S.M.; Iqbal, M.M.; Lobell, D.B.; Travsso, M.I.; Chhetri, N.; Garrett, K.; et al. Food security and food production systems. InClimate Change 2014—Impacts, Adaptation and Vulnerability: Part A: Global and Sectoral Aspects: Working Group II Contribution to the IPCC Fifth Assessment Report; Cambridge University Press: Cambridge, UK, 2015.
10. Schmidhuber, J.; Tubiello, F.N. Global food security under climate change.Proc. Natl. Acad. Sci. USA2007,
104, 19703–19708. [CrossRef] [PubMed]
11. Wheeler, T.; von Braun, J. Climate Change Impacts on Global Food Security. Science2013,341, 508–513. [CrossRef] [PubMed]
12. Singh, R.B. Climate Change and Food Security. InImproving Crop Productivity in Sustainable Agriculture; Wiley-VCH Verlag GmbH & Co. KGaA: Weinheim, Germany, 2012; pp. 1–22.
13. Piya, L.; Maharjan, K.L.; Joshi, N.P. Determinants of adaptation practices to climate change by Chepang households in the rural Mid-Hills of Nepal.Reg. Environ. Chang.2013,13, 437–447. [CrossRef]
14. Smit, B.; Wandel, J. Adaptation, adaptive capacity and vulnerability.Glob. Environ. Chang.2006,16, 282–292. [CrossRef]
15. Deressa, T.T.; Hassan, R.M.; Ringler, C.; Alemu, T.; Yesuf, M. Determinants of farmers’ choice of adaptation methods to climate change in the Nile Basin of Ethiopia.Glob. Environ. Chang.2009,19, 248–255. [CrossRef] 16. Mulwa, C.; Marenya, P.; Rahut, D.B.; Kassie, M. Response to climate risks among smallholder farmers in Malawi: A multivariate probit assessment of the role of information, household demographics, and farm characteristics.Clim. Risk Manag. 2017,16, 208–221.
17. Nhemachena, C.; Hassan, R.; Chakwizira, J. Analysis of determinants of farm-level adaptation measures to climate change in Southern Africa.J. Dev. Agric. Econ.2014,6, 232–241.
18. Tesfaye, W.; Seifu, L. Climate change perception and choice of adaptation strategies: Empirical evidence from smallholder farmers in east Ethiopia.Int. J. Clim. Chang. Strateg. Manag.2016,8, 253–270. [CrossRef] 19. Yegbeney, R.N.; Yabi, J.A.; Tovignan, S.D.; Gantoli, G.; Kokoye, S.E.H. Farmers’ decisions to adapt to climate change under various property rights: A case study of maize farming in north Benin (West Africa).Land Use Policy2013,34, 168–175. [CrossRef]
20. Ung, M.; Luginaah, I.; Chuenpagdee, R.; Campbell, G. Perceived Self-Efficacy and Adaptation to Climate Change in Coastal Cambodia.Climate2016,4, 1. [CrossRef]
Sci2019,1, 57 12 of 12
22. CBS.National Climate Change Impact Survey 2016; Central Bureau of Statistics (CBS), Government of Nepal: Kathmandu, Nepal, 2017.
23. Mainali, J.; Pricope, N.G. Geospatial datasets in support of high-resolution spatial assessment of population vulnerability to climate change in Nepal.Data Br.2017,12, 459–462. [CrossRef] [PubMed]
24. Shrestha, A.B.; Aryal, R. Climate change in Nepal and its impact on Himalayan glaciers.Reg. Environ. Chang. 2011,11, 65–77.
25. National Adaptation Programme of Action to Climate Change; Government of Nepal, Ministry of Environment: Kathamandu, Nepal, 2010.
26. Bhattarai, B.; Beilin, R.; Ford, R. Gender, Agrobiodiversity, and Climate Change: A Study of Adaptation Practices in the Nepal Himalayas.World Dev.2015,70, 122–132. [CrossRef]
27. Chhetri, N.; Subedi, M.; Ghimire, S. Niche-based responses in addressing the climatic constraints to farm production: Analogues to climate-change adaptation in Nepal.Clim. Dev.2013,5, 174–181. [CrossRef] 28. Regmi, B.R.; Star, C.; Leal Filho, W. Effectiveness of the Local Adaptation Plan of Action to support climate
change adaptation in Nepal.Mitig. Adapt. Strateg. Glob. Chang.2016,21, 461–478. [CrossRef]
29. Dhakal, S.; Sedhain, G.K.; Dhakal, S.C. Climate change impact and adaptation practices in agriculture: A case study of Rautahat District, Nepal.Climate2016,4, 63. [CrossRef]
30. Dougherty, C.Introduction to Econometrics; Oxford University Press: Oxford, UK, 2011.
31. Greene, W.H.Econometric Analysis; Prentice Hall International, Inc.: Upper Saddle River, NJ, USA, 2000. 32. Lin, C.-T.J.; Jensen, K.L.; Yen, S.T. Awareness of foodborne pathogens among US consumers.Food Q. Prefer.
2005,16, 401–412. [CrossRef]
33. Kariuki, I.M.; Loy, J.-P. Contractual Farming Arrangements, Quality Control, Incentives, and Distribution Failure in Kenya’s Smallholder Horticulture: A Multivariate Probit Analysis.Agribusiness2016,32, 547–562. [CrossRef]
34. Koo, Y.; Lim, S.; Kim, K.; Cho, Y. Analysis of user characteristics regarding social network services in South Korea using the multivariate probit model.Technol. Forecast. Soc. Chang.2014,88, 232–240. [CrossRef] 35. Milioti, C.P.; Karlaftis, M.G.; Akkogiounoglou, E. Traveler perceptions and airline choice: A multivariate
probit approach.J. Air Transp. Manag.2015,49, 46–52. [CrossRef]
36. Cappellari, L.; Jenkins, S.P. Multivariate Probit Regression using Simulated Maximum Likelihood.Stata J. Promot. Commun. Stat. Stata2003,3, 278–294. [CrossRef]
37. Ali, A.; Erenstein, O. Assessing farmer use of climate change adaptation practices and impacts on food security and poverty in Pakistan.Clim. Risk Manag.2017,16, 183–194. [CrossRef]
38. Ahmed, M.H. Climate change adaptation strategies of maize producers of the Central Rift Valley of Ethiopia.
J. Agric. Rural Dev. Trop. Subtrop. (JARTS)2016,117, 175–186.
39. Mbata, J.N. Determinants of animal traction adoption in traditional agriculture: An application of the multivariate probit procedure to the case of Lesotho.Dev. S. Afr.2001,18, 309–325. [CrossRef]
40. Ashraf, M.; Routray, J.K.; Saeed, M. Determinants of farmers’ choice of coping and adaptation measures to the drought hazard in northwest Balochistan, Pakistan.Nat. Hazards2014,73, 1451–1473. [CrossRef] 41. Fosu-Mensah, B.Y.; Vlek, P.L.; MacCarthy, D.S. Farmers’ perception and adaptation to climate change: A case
study of Sekyedumase district in Ghana.Environ. Dev. Sustain.2012,14, 495–505. [CrossRef]