Original Article
Validation of T2- and diffusion-weighted magnetic resonance imaging
for mapping intra-prostatic tumour prior to focal boost dose-escalation
using intensity-modulated radiotherapy (IMRT)
E.J. Alexander
a,b,⇑, J.R. Murray
a,b, V.A. Morgan
b, S.L. Giles
b, S.F. Riches
b, S. Hazell
a, K. Thomas
a,
S.A. Sohaib
a, A. Thompson
a, A. Gao
a,b, D.P. Dearnaley
a,b,1, N.M. DeSouza
a,b,1a
The Royal Marsden NHS Foundation Trust; andb
The Institute of Cancer Research, Sutton, UK
a r t i c l e i n f o
Article history:
Received 17 December 2018 Received in revised form 22 July 2019 Accepted 25 July 2019
Available online xxxx
Keywords:
Prostate cancer
Image-guided radiotherapy Prostate radiotherapy Magnetic resonance imaging Mapping biopsies
Diagnostic accuracy
a b s t r a c t
Background and purpose:To assess the diagnostic accuracy and inter-observer agreement of T2-weighted (T2W) and diffusion-weighted (DW) magnetic resonance imaging (MRI) for mapping intra-prostatic tumour lesions (IPLs) for the purpose of focal dose-escalation in prostate cancer radiotherapy. Materials and methods:Twenty-six men selected for radical treatment with radiotherapy were recruited prospectively and underwent pre-treatment T2W+DW-MRI and 5 mm spaced transperineal template-guided mapping prostate biopsies (TTMPB). A ‘traffic-light’ system was used to score both data sets. Radiologically suspicious lesions measuring0.5 cm3were classified as red; suspicious lesions 0.2– 0.5 cm3or larger lesions equivocal for tumour were classified as amber. The histopathology assessment combined pathological grade and tumour length on biopsy (red =4 mm primary Gleason grade 4/5 or 6 mm primary Gleason grade 3). Two radiologists assessed the MRI data and inter-observer agreement was measured with Cohens’ Kappa co-efficient.
Results: Twenty-five of 26 men had red image-defined IPLs by both readers, 24 had red pathology-defined lesions. There was a good correlation between lesions0.5 cm3classified ‘‘red” on imaging and ‘‘red” histopathology in biopsies (Reader 1: r= 0.61, p< 0.0001, Reader 2: r= 0.44, p= 0.03). Diagnostic accuracy for both readers for red image-defined lesions was sensitivity 85–86%, specificity 93–98%, positive predictive value (PPV) 79–92% and negative predictive value (NPV) 96%. Inter-observer agreement was good (Cohen’s Kappa 0.61).
Conclusions: MRI is accurate for mapping clinically significant prostate cancer; diffusion-restricted lesions0.5 cm3can be confidently identified for radiation dose boosting.
Ó2019 The Authors. Published by Elsevier B.V. Radiotherapy and Oncology xxx (2019) xxx–xxx This is an open access article under the CC BY license (http://creativecommons.org/licenses/by/4.0/).
Although dose-escalation to the whole prostate gland improves biochemical control of prostate cancer, it is at the expense of increased rectal toxicity[1–7]. The most important site for local recurrence is the dominant intra-prostatic tumour lesion (DIL)
[8–11] suggesting that focal radiation boosts to the DIL may improve the therapeutic ratio of prostate radiotherapy [12,13]. Therefore, to achieve this improvement, the accuracy of imaging to detect the DIL needs to be established.
Diffusion-weighted MR is the most widely used multi-parametric magnetic resonance imaging (mpMR) parameter for detecting and staging prostate cancer, because its quantitation is correlated with Gleason grade[14–20]. Much of the histopathological correlation between mpMRI and histopathology has used the gold standard of whole-mount radical prostatectomy specimens (WM-RP), restrict-ing analysis of imagrestrict-ing to patients suitable for radical prostatec-tomy. There is little data correlating mpMR with whole-gland histology in patients treated with radiotherapy, and in particular to define DIL’s which might be suitable for radiation boosts.
Mathematical modelling suggests transperineal template map-ping prostate biopsies (TTMPB) with 5 mm spacing detects lesions
https://doi.org/10.1016/j.radonc.2019.07.030
0167-8140/Ó2019 The Authors. Published by Elsevier B.V.
This is an open access article under the CC BY license (http://creativecommons.org/licenses/by/4.0/).
Abbreviations:TTMPB, transperineal template-guided mapping prostate biop-sies; DIL, dominant intra-prostatic tumour lesion; WM-RP, whole-mount radical prostatectomy; MCCL, maximum cancer core length; DMBZ, delineatemodified Barzell zones; IPL, intraprostatic tumour lesion.
⇑ Corresponding author at: The Royal Marsden NHS Foundation Trust, Sutton SM2 5PT, UK.
E-mail addresses: [email protected] (E.J. Alexander), [email protected] (J.R. Murray), [email protected] (V.A. Morgan), Sharon. [email protected](S.L. Giles),[email protected](S.F. Riches),Steve.hazell@rmh. nhs.uk(S. Hazell),[email protected](S.A. Sohaib),[email protected] (A. Thompson), [email protected] (A. Gao), [email protected] (D.P. Dearnaley),[email protected](N.M. DeSouza).
1 Joint senior authorship.
Contents lists available atScienceDirect
Radiotherapy and Oncology
j o u r n a l h o m e p a g e : w w w . t h e g r e e n j o u r n a l . c o m
map-reference-standard, for the purpose of focal dose-escalation in patients selected for prostate cancer radiotherapy. This is the key first step in defining DIL for boost therapy as tested in Phase 3 trials such as FLAME (NCT01168479) and PIVOTALBoost (ISRCTN80146950).
Materials and methods
Study design and patient population
This single institution prospective study was a sub-group of the DELINEATE trial (ISRCTN04483921). Consenting patients were recruited sequentially. The trial was approved by the local institu-tional review board and Regional Ethics Committee and performed in accordance with European Union guidelines for Good Clinical Practice. Hormone-naïve patients with National Comprehensive Cancer Network (NCCN) [26]intermediate or high risk localised prostate cancer were eligible, patients with seminal vesicle involvement were excluded. All patients had standard staging investigations prior to recruitment. Eight weeks after the diagnos-tic trans-rectal ultrasound-guided biopsies, patients underwent an MRI comprising of T2W and DW-MR followed by a TTMPB procedure.
MR acquisition
MR imaging was performed on a 1.5T whole-body MR scanner (Avanto, Siemens, Erlangen). Data were acquired using an endorec-tal receiver coil (ERC) inflated with 60mls of air in combination with an external phased array body coil. A 20 mg intramuscular injection of butylscopolamine bromide (Buscopan, Boehringer Ingelheim) was administered to reduce peristalsis. The MR proto-col comprised slice-matched, 3-mm, transverse T2W fast spin-echo and single-shot spin-echo-planar DWI MRI to cover the entire prostate gland. T2W fast spin-echo images were also acquired in sagittal and coronal planes. ADC maps were generated from all b values 0–800 s/mm2 (parameter details in Supplementary
Appendix A).
TTMPB procedure
Patients were anaesthetised, given prophylactic antibiotics and set-up in the lithotomy position. Biopsies were taken at 5 mm intervals, apical and basal aspects of the prostate were biopsied separately if prostate length required. Cores were taken by an experienced urologist, blinded to the MR results, and each core was marked with ink at the apical end to define polarity [27]. The supra-urethra area was avoided to prevent urethral injury.
0.49 cm3)/abnormality equivocal for tumour on imaging or MCCL
4–6 mm of primary Gleason grade 3 or2 mm ofprimary Glea-son grade 4. Green corresponded to tumour 6 mm diameter (0.2 cm3) or low suspicion of tumour on imaging or MCCL
<4 mm of Gleason 6 or <2 mm of Gleason7. White corresponded to no tumour on imaging or biopsy (Fig. 1A). Each sector was anal-ysed using 2 thresholds; true positive if imaging and pathology sectors were classified as (1) both red or (2) both either red or amber. Green and white were not considered to be clinically signif-icant prostate cancer lesions. If less than 1/3 on a sector on biopsy was affected by tumour it was classified as negative. The DMBZ analysis was performed with both strict and flexible methods. The flexible method allowed for minor geographical mismatch between sectors; if an imaged sector was positive where corre-sponding pathology sector was negative, any directly adjacent pos-itive pathology zones were classified as a true pospos-itive[29]. The DIL was defined as the largest lesion identified by both readers. The second IPL was defined as the next largest lesion identified by one or both readers. The pathological DIL and other IPLs were defined considering the total cancer core length contained in clus-tered positive biopsies i.e. all adjacent/contiguous biopsies (Fig. 2).
Statistical analysis
Statistical analysis was performed in Excel (Microsoft) and Soft-ware Package for Social Sciences (SPSSÒv21.0, IBM Corp, NY, USA) following a pre-specified Statistical Analysis Plan (Supplemental Appendix B). Descriptive statistics were used to assess tumour vol-umes and diameters. Sensitivity, specificity, positive predictive value (PPV) and negative predictive value (NPV) by sector with binomial 95% confidence intervals (CI) were calculated with Wald adjustments. All sectors were combined to give diagnostic accu-racy measurements for each reader. ROC curves compared the AUC for each reader for significant cancer detection. Inter-observer agreement was measured with Cohen’s Kappa coefficient
[30] and interpreted as: 0–0.2 slight agreement, 0.21–0.4 fair agreement, 0.41–0.6 moderate agreement, 0.61–0.8 good agree-ment,0.81 almost perfect agreement. Spearman rank correlation assessed relationships between imaging tumour volumes and pathological findings. The pre-specified primary end-point was the diagnostic performance using DMBZ with the red only, flexible methodology, other endpoints were regarded as exploratory.
Results
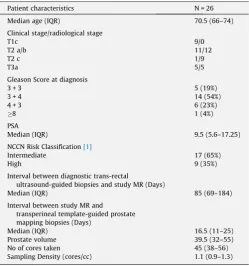
Twenty-six eligible and consenting patients were recruited between October 2010 and November 2013 (56 patients were recruited to the whole study’s initial phase). Patient characteristics
map-are shown inTable 1. Seventeen patients (65%) had intermediate risk and 9 (35%) high risk disease. The median interval between diagnostic trans-rectal ultrasound-guided biopsies and study MR was 12.2 weeks.
Median prostate volume was 39.5 cm3(IQR 32–55 cm3) with a
median sampling density of 1.1 core/cm3(IQR 0.9–1.3 core/cm3).
Prostate carcinoma was found in all patients. Red biopsies were found in 24 out of 26 patients (92%); 421 DMBZ were analysed (median 20 [IQR 11–20] per patient respectively). Traffic-light clas-sification was; 66/421 (15.7%) of DMBZ were red and 30/421 (7.1%) of DMBZ were amber. Twelve patients (46%) had no prostate carci-noma sampled outside the imaged IPLs. The remainder of patients (54%) had positive biopsies outside imaged IPLs; 1 patient had a single amber core (3 mm Gleason 3 + 4), 13 patients had green cores (0.5–3 mm Gleason 3 + 3). No patient had red biopsy cores outside the imaged IPLs.
The diagnostic accuracy parameters for the T2W+DW-MR images for readers 1 and 2 are shown inTable 2. The diagnostic accuracy of T2W+DW-MRI was high for both readers for
identifica-tion of tumour within a given sector of the prostate; sensitivity 85– 86%, specificity 93–98%, PPV 79–92% and NPV 96%. Cohen’s kappa statistic for inter-observer agreement was 0.61 indicating good agreement between the 2 readers. Median DIL volumes (Fig. 3A) were 2.2 cm3 (IQR 1.4–3.1 cm3) for reader 1 and 1.54 cm3 (IQR
1.1–2.7 cm3) for reader 2. A 2nd IPL was recorded on MR in 11
patients by reader 1 (median volume 0.63 cm3 (IQR 0.34–
0.88 cm3) and in 5 patients by reader 2 (median volume 0.29 cm3 (IQR 0.27–0.38 cm3) (Fig. 3A + B).
Cancer core lengths in DILs and 2nd IPLs are shown inFig. 3C + D. There was a statistically significant correlation between both the imaged DIL volume and any imaged red lesion volume with total cancer core length in that volume; reader 1: r= 0.44 and 0.61, p= 0.026 and 0.0001 respectively; reader 2: r= 0.50 and 0.44,p= 0.01 and 0.03 respectively (Table 3). Correlation between the 2nd IPL volume or any imaged amber lesion volume was poorer and did not reach statistical significance. Exploratory endpoints including amber as well as red categories, assessment using octants and strict rather than flexible DMBZ definitions and are Fig. 1.Schematic representation of (A) imaging and pathological traffic light classification and (B) delineate-modified Barzell zones (seeSupplemental Appendix B).
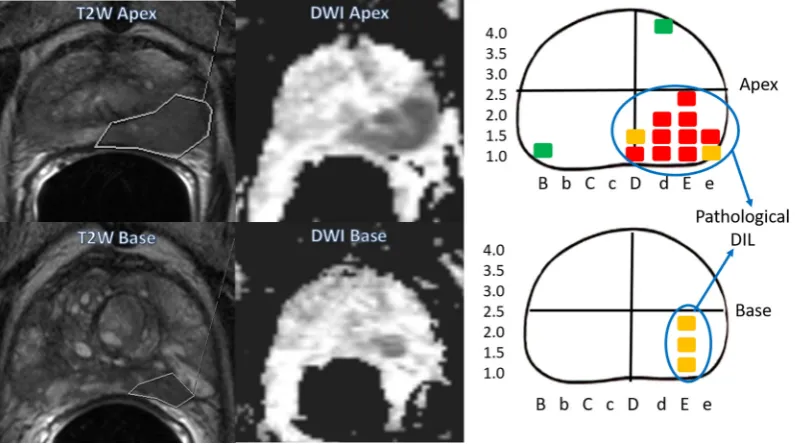
Fig. 2.T2W and DWI MR images of patient 16 taken at apical and basal segments of the prostate gland and compared to schematic diagram plotting positive biopsies in the patient’s transperineal template-guided prostate mapping biopsies, showing the cores that would be considered part of the pathological DIL.
map-shown in Supplementary Appendix C. The various methods showed sensitivity 67–87%, specificity 84–98%, PPV 49–91% and NPV 89–96%.
Discussion
DELINEATE is the first prospective study to our knowledge assessing the diagnostic accuracy of MR for the purposes of defin-ing the position of a radiation boost in a population planned for radical treatment with radiotherapy rather than prostatectomy. TTMPB at 5 mm intervals were used as the reference standard to achieve whole gland pathological sampling.
This study has shown that T2W+DW-MRI has good diagnostic accuracy for mapping the location and extent of tumour lesions measuring0.5 cm3 or1 cm diameter with restricted diffusion
on MR. Sensitivity, specificity and NPV was consistently high by 2 independent observers for the primary outcome measure; red only, flexible method (85–86%, 93–98% and 96% respectively), although the PPV varied more significantly (79–92%) due to the low prevalence of total sectors affected by tumour. The inclusion of amber lesions in the analysis caused a small decrease in sensitiv-ity (78–80%) and NPV (92%). This was due to a marginal decrease in
primary end-point was cancer diagnosis, the threshold chosen for a positive MR was lower and considered the whole prostate as a single entity. When the PROMIS data is assessed with only lesions likely to represent cancer (exclusion of equivocal lesions), sensitiv-ity, specificsensitiv-ity, PPV and NPV are 70%, 78%, 70% and 84% respec-tively, which remain lower than but more comparable with our work. This may be explained by the different population of patients examined, improved imaging resolution using an endorectal coil and the multicentre nature of the PROMIS data. A similar prospec-tive multicentre Australian study of 344 men assessed T2W/DWI/ DCE using the PI-RADS scale[19] in 344 men with a cut-off of equivocal for positive MR.[39]. Significant prostate cancer was defined as Gleason 7 with more than 5% grade 4,20% of cores positive or7 mm of prostate cancer in any core on transperineal template-guided prostate biopsies (median 30 cores per patient). Sensitivity, specificity, PPV and NPV of 96%, 36%, 52% and 92% were reported respectively which are very similar to PROMIS. Anatomi-cal concordance of the location of imaged lesion and significant cancer on biopsy was found in 97%. The lack of 5 mm mapping is likely to have impacted on the ability to detect all clinically signif-icant cancer as the size of tumour left undetected is directly related to the uniform spacing between core samples[21]. The consistent results of the PROMIS and Australian multicentre studies results suggest that our findings will be generalisable.
For initial MR screening it is desirable to keep the false negative rate as low as possible. For focal dose-escalation, where the remainder of the prostate is getting standard doses of radiation, it is preferable to keep the false positive rates as low as possible, i.e., a higher specificity. Dose-escalation to false positives could cause increased toxicity without additional benefit, thereby reduc-ing any improvement in therapeutic ratio. In our data only 2 patients (8%) had a false positive MR when assessing the whole prostate; one had multiple adjacent amber cores (multiple cores of 2–5.5 mm Gleason grade 4 + 3). The second had multiple adja-cent cores with <4 mm of tumour in the basal sections of the cores,
Table 2
Diagnostic accuracy parameters for T2W+DWI for both readers for Delineate modified Barzell zones (DMBZ) flexible method for both pathological thresholds (PPV = Positive Predictive value, NPV = Negative Predictive Value, AUC = Area under the ROC curve).
Pathological Threshold Prevalence % Sensitivity % (95%CI) Specificity % (95%CI) PPV % (95%CI) NPV % (95%CI) AUC DMBZ flexible red only imaging path
threshold red
Reader 1 23 85 (77–91)
93 (90–96)
79 (70–86)
96 (93–97)
0.87 (0.83–0.92) Reader 2 22 86
(78–92)
98 (96–99)
92 (84–96)
96 (93–98)
0.94 (0.91–0.98) DMBZ flexible red and amber imaging
path threshold red and amber
Reader 1 30 80 (72–86) 94 (91–96) 86 (78–91) 92 (88–94) 0.88 (0.84–0.93) Reader 2 28 78 (69–84) 98 (95–99) 93 (86–97) 92 (88–94) 0.92
(0.89–0.95)
High 9 (35%)
Interval between diagnostic trans-rectal
ultrasound-guided biopsies and study MR (Days)
Median (IQR) 85 (69–184)
Interval between study MR and transperineal template-guided prostate mapping biopsies (Days)
Median (IQR) 16.5 (11–25)
Prostate volume 39.5 (32–55)
No of cores taken 45 (38–56)
Sampling Density (cores/cc) 1.1 (0.9–1.3)
map-classified as green, suggesting inadequate sampling of the imaged basal tumour.
Inter-observer agreement between the readers and correlation between the delineated MR volumes (for the DIL and red lesions) and the total cancer core length was good, largely a consequence of the size of the DIL and the higher Gleason grade of these tumours causing substantial diffusion-restriction on the DW-MRI. Correspondingly, smaller lesions of lower Gleason grade were more difficult to define and led to poor agreement between radiol-ogists and poorer correlation with total cancer core length. The inclusion of these lesions for dose boosting is questionable both because of the imaging uncertainty and lack of need to boost smal-ler cancer foci. Reassuringly, inter-observer agreement in the multi-centre PROMIS trial (0.63 Cohen’s Kappa) was similar to that in our study. In future, a combination of T2W and diffusion-weighted imaging will generate contrast for more accurate and even semi-automated GTV delineation.
There are several limitations to our study. First, the number of patients was small. Second, despite the extensive sampling some areas of prostate are difficult to fully biopsy without undue risks to patients. These areas include the extreme base of the gland (bladder neck injury), the supra-urethral area (urethral injury) and pubic arch interference limiting access to the most anterior part of larger prostate glands. In our patients this caused ‘‘false positives” to be scored on a minority of imaging sectors. Third,
prostate biopsies may underestimate the true tumour burden by sampling the periphery rather than the centre of smaller lesions. Although this risk is reduced with 5 mm mapping, it will have had an effect on the analysis of total cancer core length as a surro-gate for pathological volume. Fourth, we acknowledge the statisti-cal analysis assesses all DMBZ and octants as independent of each other within each patient. This is however a well-documented approach to sector-based diagnostic accuracy studies[29,40–42]. Finally, we acknowledge that there is inevitably some uncertainty related to the mapping of the prostate images to the stylised Bar-zell diagram which certainly will have introduced minor geograph-ical discrepancies between the reporting radiologists and the pathological assessments.
We have shown that T2W+DW-MRI robustly identifies DIL for focal boost radiotherapy, the accuracy of which underpins clinical evaluation of such approaches. The DELINEATE trial has now recruited over 200 patients using conventional or modest hypofractionation schedules. A recent systematic review identified 988 patients treated with a DIL radiation boost within Phase1/2 studies which appear to be associated with low toxicity[43]even with prolonged follow-up of 8 years [44]. DIL boosts are being assessed in ongoing clinical phase 3 trials such as FLAME (NCT01168479)[45,46]and PIVOTALboost (ISRCTN80146950).
In summary, focal dose escalation to DIL may be limited to lesions1 cm in diameter (0.5 cm3), where T2W+DW-MRI imag-Fig. 3.Measured volumes for Reader 1 (Blue) and Reader 2 (Red) of (A) dominant intraprostatic lesion, (B) second largest intraprostatic lesion, (C) cancer core length for DIL and (D) cancer core length for 2nd IPL. Note differing scales for each figure.
Table 3
Spearman correlation coefficients for Total Cancer Core Lengths and MR defined lesions by readers 1 and 2.
Spearman correlation (q) between MR volume and pathological criteria (P value) Total cancer core
length in DIL
Total cancer core length in 2nd IPL
Total cancer core length in imaged-defined red lesions
Total cancer core length in image-defined amber lesions Reader 1 0.44 (p= 0.026) 0.66 9 (p= 0.03) 0.61 (p< 0.0001) 0.73 (p= 0.88)
Reader 2 0.5 (p< 0.01) 0.57 (p= 0.18) 0.44 (p= 0.03) 0.32 (p= 0.478)
map-Conflict of interest/Funding
CRUK Programme Grants 33589/A10588 &19727, CRUK and EPSRC support to the Cancer Imaging Centre at ICR and RMH in association with MRC and Department of Health C1060/A10334, C1060/A16464. We acknowledge NHS funding to The Royal Mars-den Hospital and Institute of Cancer Research NIHR Biomedical Research Centre and the Clinical Research Facility in Imaging. No funders were involved in trial design, data analysis or manuscript preparation.
Declaration of Competing Interest
Professor D. P. Dearnaley declares grants from the National Institute of Health Research and Cancer Research UK and honoraria fees from Amgen, Astellas, Sandoz, Takeda and Janssen.
Professor N. M. DeSouza declares a grant from the National Institute of Health Research and Cancer Research UK programme grants.
EA, JM, VA, SG, SR, SH, KT, SS, AT and AG have no conflicts of interest.
Appendix A. Supplementary data
Supplementary data to this article can be found online at
https://doi.org/10.1016/j.radonc.2019.07.030.
References
[1]Dearnaley DP, Sydes MR, Graham JD, Aird EG, Bottomley D, Cowan RA, et al. Escalated-dose versus standard-dose conformal radiotherapy in prostate cancer: first results from the MRC RT01 randomised controlled trial. Lancet Oncol 2007;8:475–87. doi.S1470-2045(07)70143-2 [pii] 10.1016/S1470-2045 (07)70143-2.
[2]Zietman AL, DeSilvio ML, Slater JD, Rossi Jr CJ, Miller DW, Adams JA, et al. Comparison of conventional-dose vs high-dose conformal radiation therapy in clinically localized adenocarcinoma of the prostate: a randomized controlled trial. JAMA 2005;294:1233–9.
[3]Al-Mamgani A, van Putten WL, Heemsbergen WD, van Leenders GJ, Slot A, Dielwart MF, et al. Update of Dutch multicenter dose-escalation trial of radiotherapy for localized prostate cancer. Int J Radiat Oncol Biol Phys 2008;72:980–8. doi.S0360-3016(08)00531-2 [pii] 10.1016/j. ijrobp.2008.02.073.
[4]Beckendorf V, Guerif S, Le Prise E, Cosset JM, Bougnoux A, Chauvet B, et al. 70 Gy versus 80 Gy in localized prostate cancer: 5-year results of GETUG 06 randomized trial. Int J Radiat Oncol Biol Phys 2011;80:1056–63. doi.S0360-3016(10)00612-7 [pii] 10.1016/j.ijrobp.2010.03.049.
[5]Pollack A, Zagars GK, Starkschall G, Antolak JA, Lee JJ, Huang E, et al. Prostate cancer radiation dose response: results of the M. D. Anderson phase III randomized trial. Int J Radiat Oncol Biol Phys 2002;53:1097–105. doi. S0360301602028298 [pii].
[6]Peeters ST, Lebesque JV, Heemsbergen WD, van Putten WL, Slot A, Dielwart MF, et al. Localized volume effects for late rectal and anal toxicity after
10.1016/j.ijrobp.2011.05.035.
[12]Riches SF, Payne GS, Desouza NM, Dearnaley D, Morgan VA, Morgan SC, et al. Effect on therapeutic ratio of planning a boosted radiotherapy dose to the dominant intraprostatic tumour lesion within the prostate based on multifunctional MR parameters. Br J Radiol 2014;87:. doi.10.1259/ bjr.2013081320130813.
[13]Nutting CM, Corbishley CM, Sanchez-Nieto B, Cosgrove VP, Webb S, Dearnaley DP. Potential improvements in the therapeutic ratio of prostate cancer irradiation: dose escalation of pathologically identified tumour nodules using intensity modulated radiotherapy. Br J Radiol 2002;75:151–61. [14]desouza NM, Reinsberg SA, Scurr ED, Brewster JM, Payne GS. Magnetic
resonance imaging in prostate cancer: the value of apparent diffusion coefficients for identifying malignant nodules. Br J Radiol 2007;80:90–5. doi.24232319 [pii]10.1259/bjr/24232319.
[15]deSouza NM, Riches SF, Vanas NJ, Morgan VA, Ashley SA, Fisher C, et al. Diffusion-weighted magnetic resonance imaging: a potential non-invasive marker of tumour aggressiveness in localized prostate cancer. Clin Radiol 2008;63:774–82. doi.10.1016/j.crad.2008.02.001.
[16]Morgan VA, Kyriazi S, Ashley SE, DeSouza NM. Evaluation of the potential of diffusion-weighted imaging in prostate cancer detection. Acta Radiol 2007;48:695–703. doi.779754038 [pii] 10.1080/02841850701349257. [17]Haider MA, van der Kwast TH, Tanguay J, Evans AJ, Hashmi AT, Lockwood G,
et al. Combined T2-weighted and diffusion-weighted MRI for localization of prostate cancer. AJR Am J Roentgenol 2007;189:323–8. doi.189/2/323 [pii] 10.2214/AJR.07.2211.
[18]Yoshimitsu K, Kiyoshima K, Irie H, Tajima T, Asayama Y, Hirakawa M, et al. Usefulness of apparent diffusion coefficient map in diagnosing prostate carcinoma: correlation with stepwise histopathology. J Magn Reson Imaging 2008;27:132–9. doi.10.1002/jmri.21181.
[19]Barentsz JO, Richenberg J, Clements R, Choyke P, Verma S, Villeirs G, et al. ESUR prostate MR guidelines 2012. Eur Radiol 2012;22:746–57. doi.10.1007/ s00330-011-2377-y.
[20]Dickinson L, Ahmed HU, Allen C, Barentsz JO, Carey B, Futterer JJ, et al. Magnetic resonance imaging for the detection, localisation, and characterisation of prostate cancer: recommendations from a European consensus meeting. Eur Urol 2011;59. 477–94.doi.10.1016/j. eururo.2010.12.009.
[21]Kepner GR, Kepner JV. Transperineal prostate biopsy: analysis of a uniform core sampling pattern that yields data on tumor volume limits in negative biopsies. Theor Biol Med Model 2010;7:23. doi.10.1186/1742-4682-7-23. [22]Crawford ED, Rove KO, Barqawi AB, Maroni PD, Werahera PN, Baer CA, et al.
Clinical-pathologic correlation between transperineal mapping biopsies of the prostate and three-dimensional reconstruction of prostatectomy specimens. Prostate 2013;73:778–87. doi.10.1002/pros.22622.
[23]Ahmed HU, Hu Y, Carter T, Arumainayagam N, Lecornet E, Freeman A, et al. Characterizing clinically significant prostate cancer using template prostate mapping biopsy. J Urol 2011;186:458–64. doi.S0022-5347(11)03560-9 [pii] 10.1016/j.juro.2011.03.147.
[24]Crawford ED, Wilson SS, Torkko KC, Hirano D, Stewart JS, Brammell C, et al. Clinical staging of prostate cancer: a computer-simulated study of transperineal prostate biopsy. BJU Int. 2005;96:999–1004. doi.BJU5801 [pii] 10.1111/j.1464-410X.2005.05801.x.
[25]Valerio M, Anele C, Charman SC, van der Meulen J, Freeman A, Jameson C, et al. Transperineal template prostate-mapping biopsies: an evaluation of different protocols in the detection of clinically significant prostate cancer. BJU Int. 2016;118:384–90. doi.10.1111/bju.13306.
[26] Mohler J, Bahnson RR, Boston B, Busby JE, D’Amico A, Eastham JA, et al. NCCN clinical practice guidelines in oncology: prostate cancer. J Natl Compr Canc Netw. 8:162–200.
[27]Onik G, Miessau M, Bostwick DG. Three-dimensional prostate mapping biopsy has a potentially significant impact on prostate cancer management. J Clin Oncol 2009;27:4321–6. doi.JCO.2008.20.3497 [pii]10.1200/JCO.2008.20.3497. [28]Barzell WE, Melamed MR. Appropriate patient selection in the focal treatment of prostate cancer: the role of transperineal 3-dimensional pathologic
map-mapping of the prostate–a 4-year experience. Urology 2007;70:27–35. doi. S0090-4295(07)01792-X [pii] 10.1016/j.urology.2007.06.1126.
[29]Turkbey B, Pinto PA, Mani H, Bernardo M, Pang Y, McKinney YL, et al. Prostate cancer: value of multiparametric MR imaging at 3 T for detection-histopathologic correlation. Radiology 2010;255:89–99. doi.255/1/89 [pii] 10.1148/radiol.09090475.
[30]Cohen J. A coefficient of agreement for nominal scales. Educ Psychol Measur 1960;20:37–46. doi.10.1177/001316446002000104.
[31]Futterer JJ, Heijmink SW, Scheenen TW, Veltman J, Huisman HJ, Vos P, et al. Prostate cancer localization with dynamic contrast-enhanced MR imaging and proton MR spectroscopic imaging. Radiology 2006;241:449–58. doi.2412051866 [pii]10.1148/radiol.2412051866.
[32]Graser A, Heuck A, Sommer B, Massmann J, Scheidler J, Reiser M, et al. Per-sextant localization and staging of prostate cancer: correlation of imaging findings with whole-mount step section histopathology. AJR Am J Roentgenol 2007;188:84–90. doi.188/1/84 [pii]10.2214/AJR.06.0401.
[33]Villeirs GM, Oosterlinck W, Vanherreweghe E, De Meerleer GO. A qualitative approach to combined magnetic resonance imaging and spectroscopy in the diagnosis of prostate cancer. Eur J Radiol 2010;73:352–6. doi.S0720-048X(08) 00590-1 [pii]10.1016/j.ejrad.2008.10.034.
[34]Scheidler J, Hricak H, Vigneron DB, Yu KK, Sokolov DL, Huang LR, et al. Prostate cancer: localization with three-dimensional proton MR spectroscopic imaging–clinicopathologic study. Radiology 1999;213:473–80.
[35]Kirkham AP, Emberton M, Allen C. How good is MRI at detecting and characterising cancer within the prostate?. Eur Urol 2006;50: 1163–74. discussion 75. doi.S0302-2838(06)00742-1 [pii] 10.1016/j. eururo.2006.06.025.
[36]de Rooij M, Hamoen EH, Futterer JJ, Barentsz JO, Rovers MM. Accuracy of multiparametric MRI for prostate cancer detection: a meta-analysis. AJR Am J Roentgenol 2014;202:343–51. doi.10.2214/AJR.13.11046.
[37]Futterer JJ, Briganti A, De Visschere P, Emberton M, Giannarini G, Kirkham A, et al. Clinically significant prostate cancer be detected with multiparametric magnetic resonance imaging? A systematic review of the literature. Eur Urol 2015;68:1045–53. doi.10.1016/j.eururo.2015.01.013.
[38] Ahmed HU, El-Shater Bosaily A, Brown LC, Gabe R, Kaplan R, Parmar MK, et al. Diagnostic accuracy of multi-parametric MRI and TRUS biopsy in prostate
cancer (PROMIS): a paired validating confirmatory study. The Lancet 2017;389:815–22.https://doi.org/10.1016/s0140-6736(16)32401-1. [39]Thompson JE, van Leeuwen PJ, Moses D, Shnier R, Brenner P, Delprado W, et al.
The diagnostic performance of multiparametric magnetic resonance imaging to detect significant prostate. Cancer J Urol 2016;195:1428–35. doi.10.1016/j. juro.2015.10.140.
[40] Pucar D, Shukla-Dave A, Hricak H, Moskowitz CS, Kuroiwa K, Olgac S, et al. Prostate cancer: correlation of MR imaging and MR spectroscopy with pathologic findings after radiation therapy-initial experience. Radiology 2005;236:545–53. doi.2362040739 [pii]10.1148/radiol.2362040739. [41]Coakley FV, Teh HS, Qayyum A, Swanson MG, Lu Y, Roach 3rd M, et al.
Endorectal MR imaging and MR spectroscopic imaging for locally recurrent prostate cancer after external beam radiation therapy: preliminary experience. Radiology 2004;233:441–8.
[42]Sala E, Eberhardt SC, Akin O, Moskowitz CS, Onyebuchi CN, Kuroiwa K, et al. Endorectal MR imaging before salvage prostatectomy: tumor localization and staging. Radiology 2006;238:176–83. doi.10.1148/radiol.2381052345. [43]von Eyben FE, Kiljunen T, Kangasmaki A, Kairemo K, von Eyben R, Joensuu T.
Radiotherapy boost for the dominant intraprostatic cancer lesion-a systematic review and meta-analysis. Clin Genitourin Cancer 2016;14:189–97. doi. 10.1016/j.clgc.2015.12.005.
[44]Sundahl N, De Meerleer G, Villeirs G, Ost P, De Neve W, Lumen N, et al. Combining high dose external beam radiotherapy with a simultaneous integrated boost to the dominant intraprostatic lesion: analysis of genito-urinary and rectal toxicity. Radiother Oncol 2016;119:398–404. doi.10.1016/j. radonc.2016.04.031.
[45]Lips IM, van der Heide UA, Haustermans K, van Lin EN, Pos F, Franken SP, et al. Single blind randomized Phase III trial to investigate the benefit of a focal lesion ablative microboost in prostate cancer (FLAME-trial): study protocol for a randomized controlled trial. Trials 2011;12:255. doi.1745-6215-12-255 [pii] 10.1186/1745-6215-12-255.
[46]Monninkhof EM, van Loon JWL, van Vulpen M, Kerkmeijer LGW, Pos FJ, Haustermans K, et al. Standard whole prostate gland radiotherapy with and without lesion boost in prostate cancer: Toxicity in the FLAME randomized controlled trial. Radiother Oncol 2018;127:74–80. doi.10.1016/j. radonc.2017.12.022.