IJSRR, 7(4) Oct. – Dec., 2018 Page 2506
Research article Available online www.ijsrr.org
ISSN: 2279–0543
International Journal of Scientific Research and Reviews
Kinetics of Bromination of Acetanilide
Tyagi Divya
School of Physical Sciences, Department of Chemistry
Starex University,Gurugram,122001 Email Id- [email protected]
ABSTRACT
Bromination of Acetanilide is very slow in chloroform or other solvent while it is very fast in
aqueous solution. To study Kinetics of reaction, studies are carried at different temperature in range
of 200C to 400C. Bromination reaction in aqueous solution follow 2nd order of reaction
Keywords
- Oxidation, activation energy, specific conductivity, Transference Number, Rate Constant*Corresponding Author
Dr, Divya Tyagi
Department of Chemistry
Starex University, Gurugram 122001
IJSRR, 7(4) Oct. – Dec., 2018 Page 2507
I.
INTRODUCTION
Bromination of aromatic amines and their derivatives are known to be fast reactions in
aqueous solution.
Bromination of acetanilide occur as
CH CH C
CH C H
C H
NH C O C
H3
+
Br BrCH CH C
C C H
C H
N H
C O
CH3
Br
+
H++
Br-The product of bromination is almost entirely the para Isomer, the ortho isomer being in
traces1. The reaction occurs quite slowly in solvents like glacial acetic acid, chloroform or carbon
tetrachloride2,but in aqueous solution it is quite fast. With solutions of a few tenths molar
concentration, the reaction would be all over in a fraction of a second.
In the reaction under study, there is the formation of hydrobromic acid, which is a strong acid and
therefore gives rise to considerable electrical conductance in the solution. On the other hand both the
reactants as well as the other product of the reaction do not have any appreciable electrical
conductance. Hence the progress of the reaction can be followed by measuring the electrolytic
conductance of the reaction mixture3 .
EXPERIMENTAL:
PREPARATION AND STANDARDISATION OF SOLUTION
:
Bromine Solution: A saturated bromine solution in distilled water is prepared by adding pure liquid
to a adding to a stopper bottle containing distilled water, till excess bromine settles at the bottom.
The bottle Is shaken after a regular interval of time and kept for a day.
The upper saturated solution Is decanted into another bottle as
a stock bromine solution. To a known volume of the saturated bromine solution, an excess o f
potassium Iodide solution (10 %)is added and the liberated Iodine Is titrated against 0.1 M sodium
thiosulpate using fresh starch solution as indicator. From the mean titre value the strength of the
saturated bromine solution is calculated. Then by dilution of this solution a stock of 20 L of 0.01 M
bromine solution is prepared and stored in bottle.
Acetanilide Solution: Acetanilide is recrystallised4 from hot water containing 5% alcohol. The
crystals are dried and kept in a desiccator. A saturated solution of acetanilide in distilled water is
prepared by dissolving recrystallised acetanilide in hot distilled water, cooling the hot solution and
IJSRR, 7(4) Oct. – Dec., 2018 Page 2508
treating a known volume of the solution with a known excess of standardized bromine solution, then
treating the bromine remaining unreacted with excess potassium iodide and titrating the liberated
iodine against 0.1 M sodium thiosulpate. From the saturated solution a stock solution of 20 L of
0.01M acetanilide is prepared by dilution using distilled water.
KINETIC REQUIREMENTS
:
The two 10 l reagent containers are filled with 0.01M bromine solution and 0.01M acetanlilde
respectively and are kept in a thermostat at 25.00C|, for a period of two hours so as to ensure thermal
equilibrium in the system. The conductance cell is Introduced into the observation tube at a distance
of 20 cm from the mixing chamber. When the solutions have acquired the thermostat temperature,
compressed air at a pressure o f 33 cm of mercury is applied at the reactant solution containers. The
two reactant solutions flow out of the outlet tubes, get mixed in the mixing chamber within a few
milliseconds and flow along the observation tube. The electrical resistance o f the solution is
measured and the reciprocal of it gives the conductance. Similar measurements are repeated by
inserting the conductance cell at various distances such as 30, 40, 60, 60, 70 and 80 cm from mixing
chamber in the observation tube and the electric resistance of the reaction mixture is measured each
time. These measurements are carried out with a semax resistance bridge instrument and sigma
electronic appliances. An input of 230 V, 50Hz is stabilized by voltage stabilizer. This voltage is
supplied to an oscillator. The output of the oscillator is 3 volts, 1000 Hz. This output voltage is fed to
the resistance bridge instrument. The null point is obtained using a ‘magic eye’ in the instrument.
The actual concentration (x) of hydrobromic acid produced is evaluated from the conductance
measurements depending upon a calibration o f these measurements with hydrobromic acid solutions
of known concentration. The calibration is carried out. The reaction Mixture flowing out of the
observation tube is collected and filtered. This filtrate contains 0.005M hydrobromic acid. From this
hydrobromic acid, solutions of different concentrations are prepared. Although the conductance of
the reaction mixture is mostly due to the hydrobromic acid produced in the reaction, yet there is a
small contribution by the acid produced due to the hydrolysis of unreacted bromine6. Therefore
appropriate amounts of 0.005 M bromine solution are added to the solutions of hydrobromic acid
prepared above. Thus the composition of these solutions are closely similar to those of the reaction
mixture at various stages of the reaction. The conductance of these solutions are measured using the
same conductance cell and plotted against the concentrations of hydrobromic acid. From this
calibration curve fig.1 and 2 and from the conductance measurements during the kinetic study the
concentration (x) of the hydrobromic acid can be evaluated.
The duration over which the reaction has occurred at a certain distance from the mixing
IJSRR, 7(4) Oct. – Dec., 2018 Page 2509
section of the observation tube. The area of cross section of the observation tube is 0.052 cm2 and the
flow rate of the solution is 7.67 cm3 per second. Therefore the linear velocity of the solution is
7.67/0.062 = 146.9 cm per second. Thus at a distance, say10 cm from the mixing chamber, the
duration (t) of the reaction is 10/146.9 = 0.068 sec. Similarly the duration of reaction at various other
distances from mixing chamber are found out.
Thus the concentration (x) of hydrobromic acid at a time (t) is now known. The
concentrations of bromine and acetanilide taken in the containers are 0.01M, but when they get
mixed in the mixing chamber the concentrations are automatically diluted twice. Therefore the in
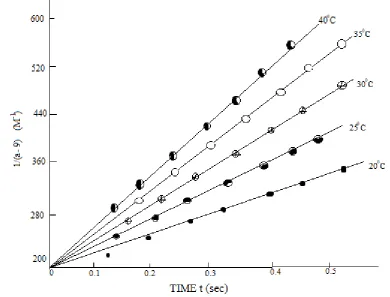
initial concentrations (a) of bromine and acetanilide are each 0.005 M. A plot of l /a- x versus time t
is found to be a straight line (fig 3) Hence the reaction is concluded to be of the second order. The
slope of the linear plot of l/a-x versus t gives the specific rate constant o f the reaction.
In order to determine the activation energy of the reaction, the studies are carried out at various
temperatures in the range 20-400C. The results at these temperatures are presented in Table 5A,
Table 5B, fig 1 and 2, and fig 3.
The plot of log K2vs 1/T is also linear (fig 4). The slope of this linear curve is -Ea/2.303 R,
from which the activation energy (Ea) for the reaction is found out. The results are presented in table
6.
Knowing the energy of activation, the frequency factor (A) for the reaction is evaluated using
the equation
K2 = A exp (-Ea/RT)
Knowing tha frequency factor, the entropy o f activation, is evaluated using the equation
A = e KT/h exp (∆Sa/R)
where, k= Boltman constant, 1.38 x 10 -16 erg/degree
T = Absolute temperature
∆Sa = The entropy o f activation
and h = Planck's constant, 6.62 x 10⁻²⁷ erg / sec
Initial concentration of Acetanilide and bromine (a) = 0.0050M
Flow Rate of reaction solution (V) = 7.67 cm3/ sec-1
Diameter of the observation tube (2r) = 2.50 mm
Area of cross section of observation tube (A) = 0.052 cm2
IJSRR, 7(4) Oct. – Dec., 2018 Page 2510
Table 1 A- Calibration of conductance of the hydrobromic acid solutions at 20.00C Volume of 0.005M
Hydrobromic acidl (ml)
Volume of 0.005M Bromine (ml)
Conc. of hydrobromic acid
(M)
Resistance (ohm) Conductance (mho)
0.0 20.0 0.00X10⁻³ 24.0X10³ 0.417X10⁻⁴
2.0 18.0 0.50 15.5 0.646
4.0 16.0 1.00 7.75 1.29
6.0 14.0 1.50 5.36 1.86
8.0 12.0 2.00 4.10 2.44
10.0 10.0 2.50 3.36 2.98
12.0 8.0 3.00 2.80 3.57
14.0 6.0 3.50 3.50 4.00
Table 1 B - Kinetic study at 20.00C Distance from mixing chamber (cm) Time (t) (sec) Resistance of reaction mixture (ohm) Conductance of reaction mixture (mho) Concentration of HCl x (M)
a – x (M)
1/ a – x (M-1)
20 0.136 12.0X10³ 0.833X10⁻⁴ 0.660X10⁻³ 4.36X10⁻³ 229.9 30 0.204 6.50 1.54 1.23 3.77 266.3 40 0.272 6.10 1.96 1.60 3.40 294.1 50 0.341 4.45 2.25 1.83 3.17 315.5 60 0.409 4.00 2.50 2.07 2.93 341.3 70 0.477 3.70 2.70 2.25 2.75 363.6 80 0.545 3.40 2.94 2.45 2.55 392.1
Slope of 1/ a-x vrs t curve = Specific reaction rate, K2 = 347.6 M-1 sec-1
Table 2 A- Calibration of conductance of the hydrobromic acid solutions at 25.00C Volume of 0.005M
hydrobromic acid (ml)
Volume of 0.005M Bromine (ml)
Conc. of hydrobromic acid
(M)
Resistance (ohm) Conductance (mho)
0.0 20.0 0.0X10⁻³ 20.40X10³ 0.488 X10⁻⁴
2.0 18.0 0.50 15.50 0.645
4.0 16.0 1.00 7.60 1.32
6.0 14.0 1.50 5.20 1.92
8.0 12.0 2.00 3.95 2.53
10.0 10.0 2.50 3.20 3.13
12.0 8.0 3.00 2.66 3.77
14.0 6.0 3.50 2.36 4.26
Table 2 B - Kinetic study at 25.00C Distance from mixing chamber (cm) Time (t) (sec) Resistance of reaction mixture (ohm) Conductance of reaction mixture (mho) Concentration of HCl x (M)
a – x (M)
1/ a – x (M-1)
20 0.136 7.10X10³ 1.40X10⁻⁴ 1.12 X10⁻³ 3.88X10⁻³ 257.4 30 0.204 5.20 1.93 1.53 3.47 288.3 40 0.272 4.10 2.44 1.93 3.07 325.2 50 0.341 3.65 2.74 2.18 2.82 254.5 60 0.409 3.35 2.99 2.38 2.62 381.3 70 0.477 3.10 3.23 2.58 2.42 413.5 80 0.545 2.95 3.39 2.70 2.30 434.1 Slope of 1/ a-x vrs t curve = Specific reaction rate, K2 = 445.0 M
-1
IJSRR, 7(4) Oct. – Dec., 2018 Page 2511
Table 3 A- Calibration of conductance of the hydrobromic acid solutions at 30.00C Volume of 0.005M
Hydrobromic acidl (ml)
Volume of 0.005M Bromine (ml)
Conc. of hydrobromic acid
(M)
Resistance (ohm) Conductance (mho)
4.0 16.0 1.00X10⁻³ 5.80X10³ 1.72X10⁻⁴
6.0 14.0 1.50 4.20 2.41
8.0 12.0 2.00 3.20 3.13
10.0 10.0 2.50 2.70 3.79
12.0 8.0 3.00 2.30 4.36
14.0 6.0 3.50 2.10 4.76
Table 3 B - Kinetic study at 30.00C Distance from mixing chamber (cm) Time (t) (sec) Resistance of reaction mixture (ohm) Conductance of reaction mixture (mho) Concentration of HCl x (M)
a – x (M)
1/ a – x (M-1)
20 0.136 5.30X10³ 1.89X10⁻⁴ 1.15X10⁻³ 3.85X10⁻³ 269.7 30 0.204 3.60 2.76 1.78 3.22 310.6 40 0.272 3.10 3.25 2.15 2.86 360.9 50 0.341 2.80 3.57 2.40 2.60 384.0 60 0.409 2.60 3.86 2.62 2.38 420.2 70 0.477 2.40 4.17 2.86 2.15 466.1 80 0.545 2.30 4.35 3.00 2.00 500.0 Slope of 1/ a-x vrs t curve = Specific reaction rate, K2 = 545.0 M
-1
sec-1
Table 4 A- Calibration of conductance of the hydrobromic acid solutions at 35.00C Volume of 0.005M
Hydrobromic acidl (ml)
Volume of 0.005M Bromine (ml)
Conc. of hydrobromic acid
(M)
Resistance (ohm) Conductance (mho)
4.0 16.0 1.00X10⁻³ 5.55X10³ 1.80X10⁻⁴
6.0 14.0 1.5 4.10 2.44
8.0 12.0 2.0 3.15 3.18
10.0 10.0 2.5 2.60 3.86
12.0 8.0 3.0 2.25 4.44
14.0 6.0 3.5 3.00 5.00
16.0 4.0 4.0 1.90 5.26
18.0 2.0 4.5 1.80 5.56
Table 4 B - Kinetic study at 35.00C Distance from mixing chamber (cm) Time (t) (sec) Resistance of reaction mixture (ohm) Conductance of reaction mixture (mho) Concentration of HCl x (M)
a – x (M)
1/ a – x (M-1)
IJSRR, 7(4) Oct. – Dec., 2018 Page 2512
Table 5 A- Calibration of conductance of the hydrobromic acid solutions at 40.00C Volume of 0.005M
Hydrobromic acidl (ml)
Volume of 0.005M Bromine (ml)
Conc. of hydrobromic acid
(M)
Resistance (ohm) Conductance (mho)
6.0 14.0 1.5X10⁻³ 3.86X10³ 2.60X10⁻⁴
8.0 12.0 2.00 2.90 3.45
10.0 10.0 2.50 2.40 4.17
12.0 8.0 3.00 2.06 4.88
14.0 6.0 3.50 1.90 5.26
16.0 4.0 4.00 1.86 5.41
18.0 2.0 4.50 1.80 5.58
20.0 0.0 5.00 1.75 5.71
Table 5 B - Kinetic study at 40.00C Distance from
mixing chamber
(cm)
Time (t) (sec)
Resistance of reaction mixture (ohm)
Conductance of reaction mixture (mho)
Concentration of HCl x (M)
a – x (M)
1/ a – x (M-1)
20 0.136 3.40X10³ 2.94X10⁻⁴ 1.72X10⁻³ 3.28X10⁻³ 304.9 30 0.204 2.65 3.77 2.23 2.77 361.0 40 0.272 2.35 4.25 2.55 2.45 408.2 50 0.341 2.15 4.65 2.83 2.17 460.8 60 0.409 2.05 4.88 3.00 2.00 500.0 70 0.477 1.95 5.13 3.22 1.78 561.8 80 0.545 1.90 5.26 3.50 1.50 666.7 Slope of 1/ a-x vrs t curve = Specific reaction rate, K2 = 770.0 M
-1
sec-1
IJSRR, 7(4) Oct. – Dec., 2018 Page 2513
IJSRR, 7(4) Oct. – Dec., 2018 Page 2514
Fig.3 – The Kinetics Of Bromination Of Acetanilide At Various temperatures Table 6 – Variation of the specific reaction rate with temperature Temperature 1/T Specific reaction rate,
K2 M-1/Sec
Log K2
0
C T0K
20 293 3.413 347.5 2.541
25 298 3.360 445.0 2.648
30 303 3.300 545.0 2.736
35 308 3.250 660.0 2.813
40 313 3.196 770.0 2.886
Energy of activation Ea = -2.303 X R X Slope of log K2 vs 1/T Curve
= -2.303 X 1.98 X (-1.48X10³)
= 6670 cal/mole
IJSRR, 7(4) Oct. – Dec., 2018 Page 2515
RESULT AND DISCUSSION
The bromination of the acetanilide in aqueous solution is found to obey second order kinetics
since the plot of 1/a-x versus time yields a straight line. The specific rate constant for this reaction is
445.0 M-1/ Sec at 250C. The activation energy and the entropy of activation are respectively 6.67
Kcal/mole and -24.9 cal/mole degree while the frequency factor at 25.00C is 3.45X10⁷ M-1/Sec
As mentioned earlier the progress of the reaction is followed by measuring the conductance
of the reaction mixture due to the hydrobromic acid produced in the reaction It is however known
that bromine undergoes hydrolysis6 in aqueous solution according to the equation:
Br2aq + H2O H+aq + HOBraq
and thus produces extra hydrobromic acid which would contribute to the conductance of the solution.
At early stages of the reaction the concentration of hydrobromic acid formed is small and is
comparable to that produced as a result o f the hydrolysis of bromine. Therefore there is the
possibility of error in estimating its concentration arising out of the bromination reaction. In order to
eliminate this error during the calibration, solutions of hydrobromic acid of various concentrations
are prepared containing bromine at such concentrations as would be occurring at various stages of
the reaction. Any hydrobromic acid arising out of the hydrolysis o f bromine would also contribute to
the total conductance, thereby simulating accurately the conditions occurring during the actual
brominating reaction.
The conductance measurements have a precision of nearly ±1.0%, which introduces an error
of 2% in the final results. The errors due to mixing efficiency and deviation from mass flow are
within 2% while the entities such as the flow rate, area of cross section of the observation tube are
accurately calculated. Hence the overall error in the rate constants is not more than 3%.
It is interesting to note that the solvent has profound influence on the order and specific rate
constant of the reaction. Robertson et al7 have studied the bromination of acetanilide in glacial acetic
acid, in aqueous acetic acid and in other solvents like chloroform and carbon tetrachloride. They
found that the reaction order, mechanism and the activation energy of the reaction depend upon the
relative concentrations of the reactants. Further, the authors found that the influence of water on the
bromination in acetic acid is to increase the rate and cause a gradual change from third order to
second kinetics. The following data give an idea of their work.
Concentration of acetanilide M/20 M/40 M/80 M/160 M/320 M/640
X1(Br2 absorbed in %) 20 20 20 20 20 20
K2M-1Min-1 9.5 4.9 2.5 1.4 0.86 0.57
Reaction order 2.9 3.0 2.9 2.7 2.6
IJSRR, 7(4) Oct. – Dec., 2018 Page 2516
On comparing these studies with the present study in purely aqueous solution it is found that the
rate constant of the reaction in aqueous solution is more than 3000 times higher than those in the
solvents mentioned above.
MECHANISM OF BROMINATION:
It has been widely accepted that bromination in aqueous media is mainly molecular bromine8.
Many authors have shown that molecular bromine is directly involved in the rate determining step.
Thus in aqueous media the rate of bromination is given by
-d[Br2]/dt = K2[ArH] [Br2]
But the bromination in organic solvents such as acetie acid, chloroform, carbon tetrachloride is of
oomplex nature. Robertson at al9 have shown that bromination involves kinetic terms of order higher
than one with respect to bromine. Therefore more general kinetic form of the bromination is given
by10
-d[Br2]/dt = K2[ArH] [Br2] + K3[ArH] [Br2]2 + K4[ArH] [Br2]3
A number of mechanisms have been suggested to interpret the above equation
1) ArH + Br2 → ArHBr2 → Products (Second order)
2) ArH + Br2 → ArHBr2 → Products (Third order)
3) Br2+ Br2 → Br4 + ArH → ArHB4 + Br2 → Products (Fourth order)
Further, bromination is catalysed by strong acids such as perchloric acid, sulphuric acid etc. Thus
the aqueous hypobromous acid in the presence o f perchloric acid becomes a much more active
brominating agent11 than bromine water. Then the bromination is represented in the kinetic form as
-d [BrOH]/dt = k2 [ArH] [BrOH] [ H+]
Bronination in acetic medium involves the hypobromous acidium ion i.e. BrOH+2 or the
brominium ion Br+ obtained by following processes12,13
BrOH + H
+→ BrOH2+ , BrOH2+ + ArH → Products
BrOH + H+ → BrOH2+ → Br+ + H2O
ArH + Br+ → Products
further it is found that the rates of bromination depend upon the acidity function rather than
the pH. There are two types of acidity functions, Hammett’s acidity function H0 given as
H0 = pKBrOH2+ + + log[BrOH]/ BrOH2+
And, J0 function given by
J0 = pKBrOH + log[BrOH]/ [Br+]
Thus if one finds that the rate constants vary with H0 function, then the main brominating
species is BrOH2+ while if the rate constants vary with J0, then the main brominating species is Br+.
IJSRR, 7(4) Oct. – Dec., 2018 Page 2517
Tribromide14 ion is also known to be a brominating agent. But its activity is nearly 200 times
less than that of molecular bromine.
The relative reactivities of the various brominating agents is found to be in the following
order15
Br+ > Br2 > BrOH > Br-3
Further the rate constants of bromination also depend upon the nature of the substituted group
i.e. whether it is electron withdrawing or electron releasing, orientation effects
and steric effects. An excellent account of the effects of these factor has been given by de la Mare in
his book16
The reaction under study has been carried out in purely aqueous medium and hence the main
brominating agent is the molecular bromine. As there is the formation of hydrobromic acid| Br3
-species which are known to be brominating -species are invariably formed, yet its reactivity being
very much less than that of Br3, the bromination due to Br3- can be neglected. Thus the most
probable mechanism would be
CH CH C C C H C H N C O CH3 H H
+
Br BrCH CH C C C H C H N H + C O CH3 H
+
Br BrCH CH C C -C H C H N H + C O CH3 H Br
+
Br- CHCH C C C H C H N H C O CH3 Br
+
H++
Br-The π electrons of the nucleus readily react with the bromine and form an adduct which then
gives rise to the intermediate. The formation of this intermediate is the rate determining step17 while
the removal of proton is very fast18. Therefore the kinetic equation for this mechanism would be
Rate = k2 [Acetanilide] [Br2]
IJSRR, 7(4) Oct. – Dec., 2018 Page 2518
ACKNOWLEDGMENT
Many thanks to my colleagues for constructive criticism especially to Rajeev Tyagi, Saksham
Tyagi, and Vandana Kaushik for assistance, and registrar Dr S.L. Vasisth for utilizing the facilities of
text and e journal access in university library.
1.
REFERENCES
2. K.J.P. orton and A.E. Brandfield, J. chem.. Soc., 98
3. P.W. Robertson, P.B.D. da la Mare and W.T.G. Johnston, J.Chem.Soc. 276
4. R.N.J. Saal, Rec. .trav. chim. 47
5. W.J. Hickinbottom, ‘reaction of organic cpompounds’ Longmans, Green and Co. 3rd Edn,
New York, 1957
6. F.A. cotton and G. willkinson, ‘Advanced inorganic chemistry second edn, Wiley estern Pvt.
Ltd., New York, 1966
7. W.J. Willson and F.G. soper, J. Chem. Soc., 3376
8. P.B.D. de la mare and J.H. Ridd, ‘Aromatic substitution’’Nitration and Halogenation’
Butterworths scientific publications, London 1969 'Hltratlon and Halogonatlott'≫
Butterworths 3elmtifte PublicationsI London, 1969; 123*
9. A.K. Derbyshire and W.A. waters, J. Chem. Soc.,569,
10.P.B.D. de la Maro and J.T. Harvey,J.Chem. Soc.,36
11.S.J. Branch and B. Jones, J. Chem. Soc.,2317
12.E. Berliner and M.C. Bockett, J.Amer. Chem. Soc.,79
13.B.A. Sliilow and N. Kanieev, C.R.Acad., 24
14.F.J.W. Roughton, in ‘Technique of Organic Chemistry’ lnvestigation of rates and
Mechanisms of reaction 2nd edition, page 131-146
15.P.W. K. Mynne-Jones, Trans.Faraday Soc., 32
16.D. Melander, Ariciv Komi.,2: 211
17.R.T. Morrison and R.N. Boyd, ‘Organic Chemistry’ 2nd edition