molecules
Article
NMR Based Metabolomics Comparison of Di
ff
erent
Blood Sampling Techniques in Awake and
Anesthetized Rats
Hongying Du
1,*
,†, Shuang Li
2,†, Yingfeng Zhang
2,3, Huiling Guo
2, Liang Wu
2, Huili Liu
2,3,
Anne Manyande
4, Fuqiang Xu
2,3and Jie Wang
2,3,*
1
College of Food Science and Technology, Huazhong Agricultural University, Wuhan 430070, China
2Key Laboratory of Magnetic Resonance in Biological Systems, State Key Laboratory of Magnetic Resonance
and Atomic and Molecular Physics, Wuhan Institute of Physics and Mathematics, Chinese Academy of
Sciences, Wuhan 430071, China
3
University of Chinese Academy of Sciences, Beijing 100049, China
4
School of Human and Social Sciences, University of West London, Middlesex TW89GA, UK
*
Correspondence: [email protected] (H.D.); [email protected] (J.W.);
Tel.:
+
86-27-87288375 (H.D.);
+
86-27-87197653 (J.W.)
†
Same contribution to the work.
Received: 14 June 2019; Accepted: 11 July 2019; Published: 12 July 2019
Abstract:
The composition of body fluids has become one of the most commonly used methods for
diagnosing various diseases or monitoring the drug responses, especially in serum
/
plasma. It is
therefore vital for investigators to find an appropriate way to collect blood samples from laboratory
animals. This study compared blood samples collected from di
ff
erent sites using the NMR based
metabolomics approach. Blood samples were collected from the saphenous vein (awake state),
tail vein (awake and anesthetized states after administration of sevoflurane or pentobarbital) and
the inferior thoracic vena cava (ITVC, anesthetized state). These approaches from the saphenous
and tail veins have the potential to enable the collection of multiple samples, and the approach from
ITVC is the best method for the collection of blood for the terminate state. The compositions of small
molecules in the serum were determined using the
1H-NMR method, and the data were analyzed
with traditional correlation analysis, principle component analysis (PCA) and OPLS-DA methods.
The results showed that acute anesthesia significantly influenced the composition of serum in a very
short period, such as the significant increase in glucose, and decrease in lactate. This indicates that it
is better to obtain blood samples under the awake state. From the perspective of animal welfare and
multiple sampling, the current study shows that the saphenous vein and tail vein are the best locations
to collect multiple blood samples for a reduced risk of injury in the awake state. Furthermore, it is
also suitable for investigating pharmacokinetics and the e
ff
ects of drug intervention on animals.
Keywords:
blood collection; serum; NMR; metabolomics; saphenous vein
1. Introduction
For clinical applications, the composition of body fluids has become a commonly used standard
for diagnosing various diseases or monitoring of drug responses. There are several kinds of body
fluids, such as urine [
1
], blood plasma [
2
], serum [
3
], cerebrospinal fluid [
4
] etc. Among these samples,
blood
/
serum measurements are the cornerstone of clinical testing; thus, numerous investigations into
the analysis of blood serum composition exist.
Rodents are the most popular animal model for pre-clinical studies; hence, it is very important to
get blood samples as few animals as possible, and to improve data evaluation. Currently, there are
Molecules2019,24, 2542 2 of 16
many common sites for blood collection in rodents, such as the tail vein (easy for catheterization),
retro-orbital sinus, facial vein, saphenous vein, heart or the inferior thoracic vena cava (ITVC) [
5
,
6
].
For terminal stage studies, blood collection sites from the heart or ITVC are preferred, due to the
good quality volume of blood from animals. For the collection of multiple blood samples over a short
period of time, the approaches of retro-orbital sinus, tail vein, or saphenous vein are appropriate.
For the approach of retro-orbital sinus, the operator should be well trained, and the animal needs to be
anaesthetized, or else this simple operation could seriously hurt the animal, resulting in, for instance,
blindness [
7
,
8
]. Furthermore, it should be noted that anesthetics could alter the biochemical and
hematological composition [
9
]. For tail vein collection, the operator should also be well trained,
since some researchers just cut o
ff
the tail [
10
,
11
], which could seriously injure the animal, and the
blood might be obtained from both vein and artery. Among these methods, the blood collection
approaches-lateral saphenous vein
/
tail vein catheterization are relatively quick ways of collecting
blood from all strains of rodents. Furthermore, the animal does not need to be anesthetized, but just
needs slight restraining by hand. Thus, it is proposed that this is the best way of collecting multiple
blood samples.
The protein compositions in the blood serum hold a wealth of information about the health
status of patients. Furthermore, there is an increasing tendency towards studying the composition of
small molecules, such as metabolites, due to the fact that their levels can be significantly influenced
by many diseases, the administration of drugs, or by toxins [
12
,
13
]. Thus, blood measurements of
metabolites have a wide range of applications [
14
] using various technologies, such as proton nuclear
magnetic resonance spectroscopy (
1H-NMR) [
15
], mass spectroscopy (MS) [
16
] and high-performance
liquid chromatography (HPLC) [
17
], etc. Among these methods,
1H-NMR is the most often utilized
to provide chemical and structural information of biological molecules [
18
] in a sample without any
damage. The
1H-NMR spectra of blood serum are dominated by broad resonances from proteins and
lipoproteins decorated by sharper resonances from small molecules. Aside from lipids, the dominant
small molecule in the
1H-NMR spectrum of serum
/
plasma is glucose [
19
]. Furthermore, a number of
amino acids and some organic acids are routinely detected, such as alanine, glutamine, leucine and
histidine, lactate, citrate and succinate, etc. Concentrations of these metabolites are influenced by the
brain state of the animal and the approach used of blood collection from the animal.
Thus, metabolomics studies of di
ff
erent blood collection approaches were investigated in the
current study, i.e., di
ff
erent bleeding sites: saphenous vein
/
tail vein
/
ITVC; di
ff
erent brain states:
awake
/
anesthesia; and di
ff
erent anesthetics: sevoflurane
/
pentobarbital. The chemical compositions of
the serum from these di
ff
erent kinds of approaches were compared. This study verified that acute
anesthesia could have an e
ff
ect on blood compositions and that the bleeding site is also an influencing
factor, especially for ITVC. Furthermore, this study provided e
ffi
cient and convenient approaches for
collecting multiple blood samples in a short period of time from awake animals.
2. Materials and Methods
2.1. Animals
The experimental protocols were approved by the animal care and use committee in Wuhan
Institute of Physics and Mathematics, the Chinese Academy of Sciences. All male rats (
n
=
9; 8 weeks
old) were ordered from VITAL RIVER (Beijing, China) and kept in SPF (Specific pathogen Free) animal
residence (Wuhan, China). Rats were housed in plastic cages in a climate-controlled room with 12 h
of light-dark illumination cycle at 25
±
1
◦C and relative 50
±
10% humidity. During the experiment,
Molecules2019,24, 2542 3 of 16
2.2. Blood Collection
In order to compare the e
ffi
ciency of blood collection methods from di
ff
erent bleeding sites,
the brain states, and the anesthetized states under di
ff
erent anesthetics, six groups of blood samples
were collected from the same animal: two from the saphenous vein under awake state (B
SV0:
n
=
9;
B
SV10:
n
=
8); three from the tail vein under awake (B
TVA:
n
=
6) and di
ff
erent anesthesia states (B
TVS:
n
=
9 and pentobarbital-sample B
TVP:
n
=
7); and the last one from the inferior thoracic vena cava (ITVC)
under anesthetized state (pentobarbital sodium, B
ITVC:
n
=
8). The whole experimental procedure
and operation methods are illustrated in Figure
1
. One animal died during the anesthesia procedure,
and the blood collection operation was ceased after three attempts.
Molecules 2019, 24, x FOR PEER REVIEW 3 of 18
2.2. Blood Collection
In order to compare the efficiency of blood collection methods from different bleeding sites, the
brain states, and the anesthetized states under different anesthetics, six groups of blood samples were
collected from the same animal: two from the saphenous vein under awake state (B
SV0:
n
= 9;
B
SV10:
n
= 8); three from the tail vein under awake (B
TVA:
n
= 6) and different anesthesia states (
B
TVS:
n
= 9 and
pentobarbital-sample B
TVP:
n
= 7); and the last one from the inferior thoracic vena cava (ITVC) under
anesthetized state (pentobarbital sodium, B
ITVC:
n
= 8). The whole experimental procedure and
operation methods are illustrated in Figure 1. One animal died during the anesthesia procedure, and
the blood collection operation was ceased after three attempts.
Figure 1.
Flow chart of the whole experimental procedure (
A
) and demonstrations of the blood
collection from the saphenous vein and the tail vein under awake/anesthesia states (
B
). Note: B: blood;
SV0 or SV10: Blood collection from the saphenous vein after 0
thor 10
thday. TVA, TVS or TVP: Blood
collection from the tail vein under awake or anesthesia state induced by sevoflurane or pentobarbital;
ITVC: Blood collection from the inferior thoracic vena cava.
For saphenous vein (Blood samples: B
SV0and B
SV10): The rat was first restrained by hand, and the
hair on the tarsal joint was shaved. Then the hind limb was extended straight prior to blood collection,
and the skin was smeared with Vaseline to avoid the blood spreading onto the skin and to facilitate
the formation of blood clots. Using a fine 23 G needle, the first puncture was performed on the
saphenous vein to collect the blood sample. Normally once is enough for bleeding, and the puncture
times should not exceed three in one attempt, in line with animal care protocols. The bleeding was
stopped by pressing a gauze or tissue on the puncture site. The animal was return to the home cage
after the bleeding was totally stanched. The steps of blood collection are shown in Video 1
(Supplemental materials).
For tail vein under awake state (Blood sample: B
TVA):
A plastic animal holder and a specially
designed syringe were needed for this approach. The syringe (1 mL) was connected to a fine 23G
needle through a short length (~20 cm) of PE50 (O.D. 0.97
×
I.D. 0.58mm/L1.0m). At first, the awake
animal was restrained in the plastic animal holder. Then, the tail vein catheterization was completed
in the lateral tail vein with the special syringe (requiring more practice to achieve skilled operation)
and the sample (~200 µL) was collected by withdrawing the blood with the syringe. The steps of the
blood collection are illustrated in Video 2 (Supplemental materials).
For tail vein under anesthesia state (Blood samples: B
TVSand B
TVP): Two different anesthetics
were utilized in the current study: A: Sevoflurane (3–4%); B: 1% Pentobarbital (0.7 mL/100 g). In this
step, the rats did not need to be restrained by the animal holder, and the level of anesthesia was
verified by the loss of righting reflex, such as lack of withdrawal response to a foot pinch. Blood
Figure 1.
Flow chart of the whole experimental procedure (
A
) and demonstrations of the blood
collection from the saphenous vein and the tail vein under awake
/
anesthesia states (
B
). Note: B: blood;
SV0 or SV10: Blood collection from the saphenous vein after 0th or 10th day. TVA, TVS or TVP: Blood
collection from the tail vein under awake or anesthesia state induced by sevoflurane or pentobarbital;
ITVC: Blood collection from the inferior thoracic vena cava.
For saphenous vein (Blood samples: B
SV0and B
SV10): The rat was first restrained by hand, and
the hair on the tarsal joint was shaved. Then the hind limb was extended straight prior to blood
collection, and the skin was smeared with Vaseline to avoid the blood spreading onto the skin and
to facilitate the formation of blood clots. Using a fine 23 G needle, the first puncture was performed
on the saphenous vein to collect the blood sample. Normally once is enough for bleeding, and the
puncture times should not exceed three in one attempt, in line with animal care protocols. The bleeding
was stopped by pressing a gauze or tissue on the puncture site. The animal was return to the home
cage after the bleeding was totally stanched. The steps of blood collection are shown in Video 1
(Supplemental Materials).
For tail vein under awake state (Blood sample: B
TVA): A plastic animal holder and a specially
designed syringe were needed for this approach. The syringe (1 mL) was connected to a fine 23G
needle through a short length (~20 cm) of PE50 (O.D. 0.97
×
I.D. 0.58 mm
/
L1.0m). At first, the awake
animal was restrained in the plastic animal holder. Then, the tail vein catheterization was completed in
the lateral tail vein with the special syringe (requiring more practice to achieve skilled operation) and
the sample (~200
µ
L) was collected by withdrawing the blood with the syringe. The steps of the blood
collection are illustrated in Video 2 (Supplemental Materials).
For tail vein under anesthesia state (Blood samples: B
TVSand B
TVP): Two di
ff
erent anesthetics
Molecules2019,24, 2542 4 of 16
verified by the loss of righting reflex, such as lack of withdrawal response to a foot pinch. Blood
samples were directly collected from the lateral tail vein. The detailed steps are demonstrated in Video
3 (Supplemental Materials).
For ITVC (Blood sample: B
ITVC): At this point, a terminal procedure yielding maximal blood
volume was performed. After completing the blood collection from the lateral tail vein in the
anesthetized rat with pentobarbital, the rat chest was immediately opened to collect blood from the
ITVC. At the end, ~200
µ
L blood sample was collected for further analysis.
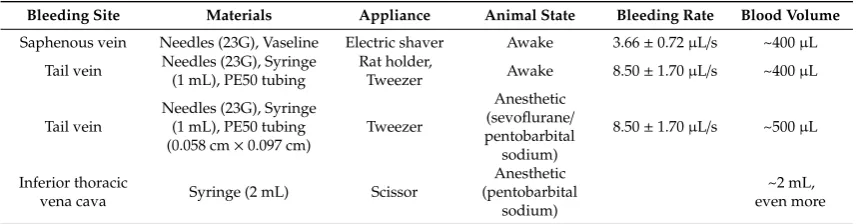
Detailed information about the materials, appliance, bleeding rates and blood volume for di
ff
erent
bleeding sites and brain states are illustrated in Table
1
.
Table 1.
The surgical materials for di
ff
erent kinds of blood sample collection approaches.
Bleeding Site Materials Appliance Animal State Bleeding Rate Blood Volume Saphenous vein Needles (23G), Vaseline Electric shaver Awake 3.66±0.72µL/s ~400µL
Tail vein Needles (23G), Syringe (1 mL), PE50 tubing
Rat holder,
Tweezer Awake 8.50±1.70µL/s ~400µL
Tail vein
Needles (23G), Syringe (1 mL), PE50 tubing (0.058 cm×0.097 cm)
Tweezer
Anesthetic (sevoflurane/
pentobarbital sodium)
8.50±1.70µL/s ~500µL
Inferior thoracic
vena cava Syringe (2 mL) Scissor
Anesthetic (pentobarbital
sodium)
~2 mL, even more
2.3. Sample Preparation
The collected blood samples were immediately centrifuged at 6000
×
g
for 10 min at 4
◦C, and
the supernatant serum withdrawn by pipette and temporally stored on ice. After all the samples had
been collected, the ice-cold serum (50
µ
L) was transferred to a 5 mm NMR tube, and mixed with 50
µ
L
D
2O (contained 5 mM formate) and 400
µ
L phosphate bu
ff
er (0.2 M Na
2HPO
4/
NaH
2PO
4, pH 7.2).
The samples were uniformity mixed by vortex and kept at
−
20
◦C for further NMR analysis.
2.4. H-NMR Detection
To detect the small molecular weight metabolites,
1H-NMR spectra of the serum samples were
obtained with Carr–Purcell–Meiboom–Gill (CPMG) pulse sequence in a Bruker AVANCE III 600 MHz
CryoProbes NMR spectrometer (Bruker, Rheinstetten, Germany). The acquisition parameters were
set as following: size of FID: 32 k; number of scans: 256; number of dummy scans: 4; spectral width:
20 ppm; 90
◦pulse length: 14.2
µ
s; spin-echo delay: 350
µ
s, number of loops: 80; and relaxation
delay: 3.4 s.
2.5. NMR Spectra Processing
All NMR spectral data were analyzed with the commercial software Topspin 2.1 (Bruker Biospin,
GmbH, Rheinstetten, Germany) and a home-made software
NMRSpec
[
20
] in MATLAB (R2018b,
Mathworks Inc. 2018,) (Freely available from the author upon request: [email protected]).
All the FID signals of
1H-NMR spectra were converted by adding the exponential window function
with a width increasing factor of 1Hz before the Fourier transformation (Topspin). Then the phase and
baseline correction were performed manually in Topspin, and the chemical signals were calibrated
with the inner standard-formate signal.
Furthermore, the NMR spectra data were imported to
NMRSpec
for peak alignment and integration.
Then, continuous even spectral bucketing (0.004 ppm) and the areas of the whole peaks [
20
] in all
spectra were automatically integrated in
NMRSpec
, and all bucketed spectra data and the peak areas
Molecules2019,24, 2542 5 of 16
Due to the overlapped signals in the
1H-NMR spectra, the relative concentrations of these
metabolites were calculated based on the following procedures: the average chemical related peak
area in the NMR spectra of S
SV0samples was set as the reference ‘1’. The areas of the same peaks in all
samples were normalized using this reference, and the relative chemical concentration was calculated
by averaging the normalized peak areas in the same locations of the NMR spectra in the same group.
2.6. Statistical Analysis
In order to initially compare the di
ff
erences of the metabolites in these di
ff
erent types of blood
collection approaches, the correlation of the metabolites in the NMR spectra were analyzed using the
PQN normalized areas of the peaks in the NMR spectra.
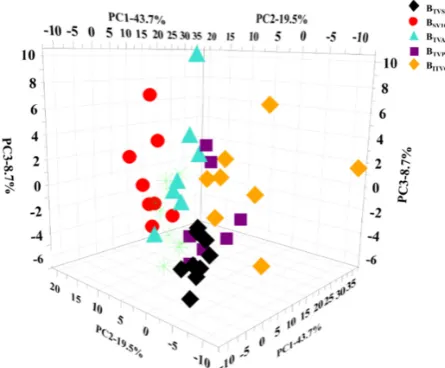
Then, the normalized data was imported into the SIMCA-p
+
software package (v11.0, Umetrics,
Malmö, Sweden) for multivariate statistical analysis. With the adoption of UV standardization of
pre-processing method, Principal component analysis (PCA) is mainly used for the observation of
sample clustering of the whole situation and the existence of outliers.
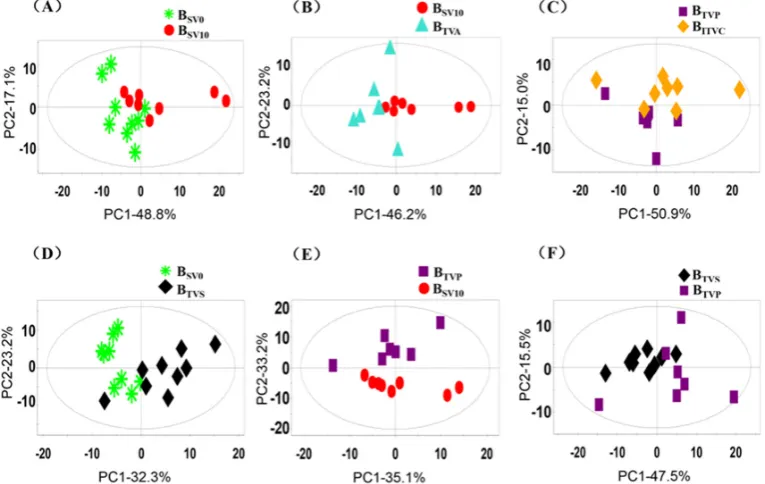
Then, the di
ff
erence between these three di
ff
erent kinds of serum samples were analyzed with
the help of PLS-DA method (Partial Least Squares Discriminant Analysis). The PLS-DA method
is a classification algorithm based on partial least squares algorithm. Its function is to use the
mathematical model established by X to predict the classification of unknown samples in Y, at the same
time maximizing the separation of the two groups, which is helpful to find out the metabolites that
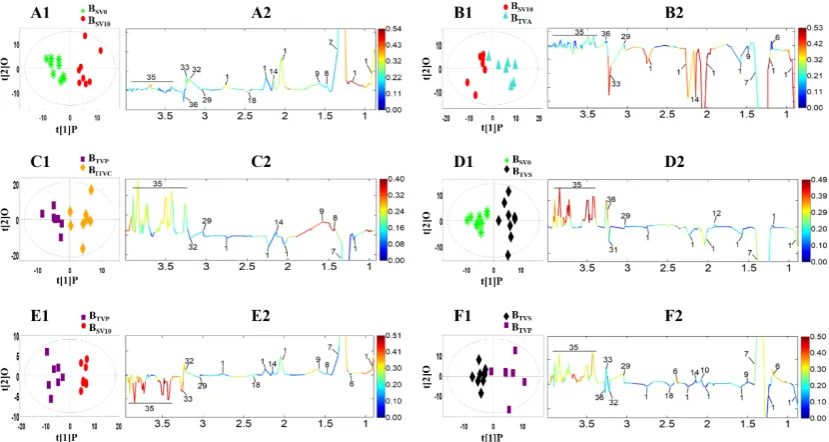
contribute to the classification. The significant varying metabolites were extracted from OPLS-DA
correlation coe
ffi
cient color coded loading plots.
3. Results and Discussion
3.1. Blood Collection Methods
Many blood collection methods have been reported [
5
,
22
]. As stated in the introduction, most of
these methods have adverse e
ff
ects such as tissue damage and contamination from the glands [
8
,
23
]
in awake animals. In order to avoid these problems, the animal could be anesthetized, which could
influence the metabolic components in the serum. Furthermore, most of these methods could not
be utilized with multiple sample collections from the same animal under an awake state. The
saphenous vein and tail vein blood collection methods have the minimum adverse e
ff
ects on the
animals; this approach could be selected as the best representative of peripheral blood samples for
potential multiple samples collection in the same animal.
At first, three animals were appropriately anesthetized with sevoflurane during the second
blood collection. The rats showed a reduction in heart rate and blood pressure following sevoflurane
anesthesia. The blood vessels contracted and the rate of bleeding significantly decreased (almost no
bleeding) after puncture. Thus, the blood samples from the saphenous vein were only collected under
the awake state.
To demonstrate the e
ff
ect of di
ff
erent brain states and body sites on the blood sampling procedure
in rats (
n
=
9), various blood collection methods were implemented under di
ff
erent conditions in the
current study, such as blood collections from di
ff
erent sites-saphenous vein
/
tail vein
/
ITVC, di
ff
erent
brain states-awake
/
anesthesia, di
ff
erent anesthetics-sevoflurane
/
pentobarbital.
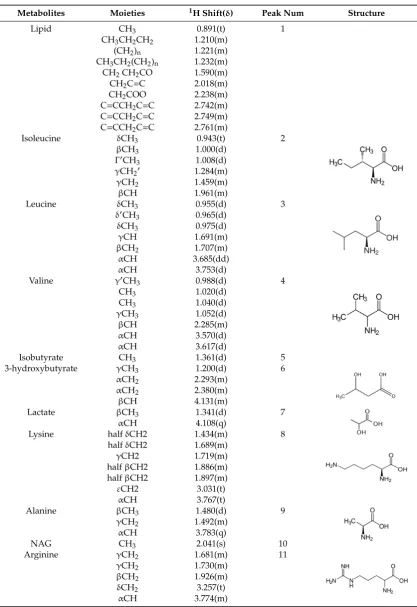
3.2. Variation of
1H-NMR Spectra of Blood under Different Blood Collection Methods
An example of
1H–NMR spectra of the serum is shown in Figures
2
A and
3
-Blood. The peak
assignments and chemical shifts of the signals in
1H-NMR are illustrated in Table
2
. The nuclear
Molecules2019,24, 2542 6 of 16
fatty acid and creatinine as well as other metabolites such as choline metabolite ethanolamine purine
and pyrimidine metabolites.
Table 2.
The NMR related information of the related proton signals in the small molecules in the
serum samples.
Metabolites
Moieties
1H Shift(
δ
)
Peak Num
Structure
Lipid
CH
30.891(t)
1
CH
3CH
2CH
21.210(m)
(CH
2)
n1.221(m)
CH
3CH
2(CH
2)
n1.232(m)
CH
2CH
2CO
1.590(m)
CH
2C
=
C
2.018(m)
CH
2COO
2.238(m)
C
=
CCH
2C
=
C
2.742(m)
C
=
CCH
2C
=
C
2.749(m)
C
=
CCH
2C
=
C
2.761(m)
Isoleucine
δ
CH
30.943(t)
2
Molecules 2019, 24, x FOR PEER REVIEW 6 of 18
Table 2. The NMR related information of the related proton signals in the small molecules in the serum samples.
Metabolites Moieties 1H shift(δ) Peak
Num Structure
Lipid CH3 0.891(t) 1
CH3CH2CH2 1.210(m)
(CH2)n 1.221(m)
CH3CH2(CH2)n 1.232(m)
CH2 CH2CO 1.590(m)
CH2C=C 2.018(m)
CH2COO 2.238(m)
C=CCH2C=C 2.742(m)
C=CCH2C=C 2.749(m)
C=CCH2C=C 2.761(m)
Isoleucine δCH3 0.943(t) 2
βCH3 1.000(d)
Γ′CH3 1.008(d)
γCH2′ 1.284(m)
γCH2 1.459(m)
βCH 1.961(m)
Leucine δCH3 0.955(d) 3
δ′CH3 0.965(d)
δCH3 0.975(d)
γCH 1.691(m)
βCH2 1.707(m)
αCH 3.685(dd) αCH 3.753(d)
Valine γ′CH3 0.988(d) 4
CH3 1.020(d)
CH3 1.040(d)
γCH3 1.052(d)
βCH 2.285(m) αCH 3.570(d) αCH 3.617(d)
Isobutyrate CH3 1.361(d) 5
3-hydroxybutyrate γCH3 1.200(d) 6
αCH2 2.293(m)
αCH2 2.380(m)
βCH 4.131(m)
Lactate βCH3 1.341(d) 7
αCH 4.108(q)
Lysine half δCH2 1.434(m) 8
half δCH2 1.689(m) γCH2 1.719(m) half βCH2 1.886(m) half βCH2 1.897(m) εCH2 3.031(t)
αCH 3.767(t)
Alanine βCH3 1.480(d) 9
γCH2 1.492(m)
αCH 3.783(q)
NAG CH3 2.041(s) 10
Arginine γCH2 1.681(m) 11
γCH2 1.730(m)
βCH2 1.926(m)
δCH2 3.257(t)
β
CH
31.000(d)
Γ
0CH
31.008(d)
γ
CH
20
1.284(m)
γ
CH
21.459(m)
β
CH
1.961(m)
Leucine
δ
CH
30.955(d)
3
Molecules 2019, 24, x FOR PEER REVIEW 6 of 18
Table 2. The NMR related information of the related proton signals in the small molecules in the serum samples.
Metabolites Moieties 1H shift(δ) Peak
Num Structure
Lipid CH3 0.891(t) 1
CH3CH2CH2 1.210(m)
(CH2)n 1.221(m)
CH3CH2(CH2)n 1.232(m)
CH2 CH2CO 1.590(m)
CH2C=C 2.018(m)
CH2COO 2.238(m)
C=CCH2C=C 2.742(m)
C=CCH2C=C 2.749(m)
C=CCH2C=C 2.761(m)
Isoleucine δCH3 0.943(t) 2
βCH3 1.000(d)
Γ′CH3 1.008(d)
γCH2′ 1.284(m)
γCH2 1.459(m)
βCH 1.961(m)
Leucine δCH3 0.955(d) 3
δ′CH3 0.965(d)
δCH3 0.975(d)
γCH 1.691(m)
βCH2 1.707(m)
αCH 3.685(dd) αCH 3.753(d)
Valine γ′CH3 0.988(d) 4
CH3 1.020(d)
CH3 1.040(d)
γCH3 1.052(d)
βCH 2.285(m) αCH 3.570(d) αCH 3.617(d)
Isobutyrate CH3 1.361(d) 5
3-hydroxybutyrate γCH3 1.200(d) 6
αCH2 2.293(m)
αCH2 2.380(m)
βCH 4.131(m)
Lactate βCH3 1.341(d) 7
αCH 4.108(q)
Lysine half δCH2 1.434(m) 8
half δCH2 1.689(m) γCH2 1.719(m) half βCH2 1.886(m) half βCH2 1.897(m) εCH2 3.031(t)
αCH 3.767(t)
Alanine βCH3 1.480(d) 9
γCH2 1.492(m)
αCH 3.783(q)
NAG CH3 2.041(s) 10
Arginine γCH2 1.681(m) 11
γCH2 1.730(m)
βCH2 1.926(m)
δCH2 3.257(t)
δ
0CH
30.965(d)
δ
CH
30.975(d)
γ
CH
1.691(m)
β
CH
21.707(m)
α
CH
3.685(dd)
α
CH
3.753(d)
Valine
γ
0CH
30.988(d)
4
Molecules 2019, 24, x FOR PEER REVIEW 6 of 18
Table 2. The NMR related information of the related proton signals in the small molecules in the serum samples.
Metabolites Moieties 1H shift(δ) Peak
Num Structure
Lipid CH3 0.891(t) 1
CH3CH2CH2 1.210(m)
(CH2)n 1.221(m)
CH3CH2(CH2)n 1.232(m)
CH2 CH2CO 1.590(m)
CH2C=C 2.018(m)
CH2COO 2.238(m)
C=CCH2C=C 2.742(m)
C=CCH2C=C 2.749(m)
C=CCH2C=C 2.761(m)
Isoleucine δCH3 0.943(t) 2
βCH3 1.000(d)
Γ′CH3 1.008(d)
γCH2′ 1.284(m)
γCH2 1.459(m)
βCH 1.961(m)
Leucine δCH3 0.955(d) 3
δ′CH3 0.965(d)
δCH3 0.975(d)
γCH 1.691(m)
βCH2 1.707(m)
αCH 3.685(dd) αCH 3.753(d)
Valine γ′CH3 0.988(d) 4
CH3 1.020(d)
CH3 1.040(d)
γCH3 1.052(d)
βCH 2.285(m) αCH 3.570(d) αCH 3.617(d)
Isobutyrate CH3 1.361(d) 5
3-hydroxybutyrate γCH3 1.200(d) 6
αCH2 2.293(m)
αCH2 2.380(m)
βCH 4.131(m)
Lactate βCH3 1.341(d) 7
αCH 4.108(q)
Lysine half δCH2 1.434(m) 8
half δCH2 1.689(m) γCH2 1.719(m) half βCH2 1.886(m) half βCH2 1.897(m) εCH2 3.031(t) αCH 3.767(t)
Alanine βCH3 1.480(d) 9
γCH2 1.492(m)
αCH 3.783(q)
NAG CH3 2.041(s) 10
Arginine γCH2 1.681(m) 11
γCH2 1.730(m)
βCH2 1.926(m)
δCH2 3.257(t)
CH
31.020(d)
CH
31.040(d)
γ
CH
31.052(d)
β
CH
2.285(m)
α
CH
3.570(d)
α
CH
3.617(d)
Isobutyrate
CH
31.361(d)
5
3-hydroxybutyrate
γ
CH
31.200(d)
6
Molecules 2019, 24, x FOR PEER REVIEW 6 of 18
Table 2. The NMR related information of the related proton signals in the small molecules in the serum samples.
Metabolites Moieties 1H shift(δ) Peak
Num Structure
Lipid CH3 0.891(t) 1
CH3CH2CH2 1.210(m)
(CH2)n 1.221(m)
CH3CH2(CH2)n 1.232(m)
CH2 CH2CO 1.590(m)
CH2C=C 2.018(m)
CH2COO 2.238(m)
C=CCH2C=C 2.742(m)
C=CCH2C=C 2.749(m)
C=CCH2C=C 2.761(m)
Isoleucine δCH3 0.943(t) 2
βCH3 1.000(d)
Γ′CH3 1.008(d)
γCH2′ 1.284(m)
γCH2 1.459(m)
βCH 1.961(m)
Leucine δCH3 0.955(d) 3
δ′CH3 0.965(d)
δCH3 0.975(d)
γCH 1.691(m)
βCH2 1.707(m)
αCH 3.685(dd) αCH 3.753(d)
Valine γ′CH3 0.988(d) 4
CH3 1.020(d)
CH3 1.040(d)
γCH3 1.052(d)
βCH 2.285(m) αCH 3.570(d) αCH 3.617(d)
Isobutyrate CH3 1.361(d) 5
3-hydroxybutyrate γCH3 1.200(d) 6
αCH2 2.293(m)
αCH2 2.380(m)
βCH 4.131(m)
Lactate βCH3 1.341(d) 7
αCH 4.108(q)
Lysine half δCH2 1.434(m) 8
half δCH2 1.689(m) γCH2 1.719(m) half βCH2 1.886(m) half βCH2 1.897(m) εCH2 3.031(t)
αCH 3.767(t)
Alanine βCH3 1.480(d) 9
γCH2 1.492(m)
αCH 3.783(q)
NAG CH3 2.041(s) 10
Arginine γCH2 1.681(m) 11
γCH2 1.730(m)
βCH2 1.926(m)
δCH2 3.257(t)
α
CH
22.293(m)
α
CH
22.380(m)
β
CH
4.131(m)
Lactate
β
CH
31.341(d)
7
Molecules 2019, 24, x FOR PEER REVIEW 6 of 18
Table 2. The NMR related information of the related proton signals in the small molecules in the serum samples.
Metabolites Moieties 1H shift(δ) Peak
Num Structure
Lipid CH3 0.891(t) 1
CH3CH2CH2 1.210(m)
(CH2)n 1.221(m)
CH3CH2(CH2)n 1.232(m)
CH2 CH2CO 1.590(m)
CH2C=C 2.018(m)
CH2COO 2.238(m)
C=CCH2C=C 2.742(m)
C=CCH2C=C 2.749(m)
C=CCH2C=C 2.761(m)
Isoleucine δCH3 0.943(t) 2
βCH3 1.000(d)
Γ′CH3 1.008(d)
γCH2′ 1.284(m)
γCH2 1.459(m)
βCH 1.961(m)
Leucine δCH3 0.955(d) 3
δ′CH3 0.965(d)
δCH3 0.975(d)
γCH 1.691(m)
βCH2 1.707(m)
αCH 3.685(dd) αCH 3.753(d)
Valine γ′CH3 0.988(d) 4
CH3 1.020(d)
CH3 1.040(d)
γCH3 1.052(d)
βCH 2.285(m) αCH 3.570(d) αCH 3.617(d)
Isobutyrate CH3 1.361(d) 5
3-hydroxybutyrate γCH3 1.200(d) 6
αCH2 2.293(m)
αCH2 2.380(m)
βCH 4.131(m)
Lactate βCH3 1.341(d) 7
αCH 4.108(q)
Lysine half δCH2 1.434(m) 8
half δCH2 1.689(m) γCH2 1.719(m) half βCH2 1.886(m) half βCH2 1.897(m) εCH2 3.031(t)
αCH 3.767(t)
Alanine βCH3 1.480(d) 9
γCH2 1.492(m)
αCH 3.783(q)
NAG CH3 2.041(s) 10
Arginine γCH2 1.681(m) 11
γCH2 1.730(m)
βCH2 1.926(m)
δCH2 3.257(t)
α
CH
4.108(q)
Lysine
half
δ
CH2
1.434(m)
8
Molecules 2019, 24, x FOR PEER REVIEW 6 of 18
Table 2. The NMR related information of the related proton signals in the small molecules in the serum samples.
Metabolites Moieties 1H shift(δ) Peak
Num Structure
Lipid CH3 0.891(t) 1
CH3CH2CH2 1.210(m)
(CH2)n 1.221(m)
CH3CH2(CH2)n 1.232(m)
CH2 CH2CO 1.590(m)
CH2C=C 2.018(m)
CH2COO 2.238(m)
C=CCH2C=C 2.742(m)
C=CCH2C=C 2.749(m)
C=CCH2C=C 2.761(m)
Isoleucine δCH3 0.943(t) 2
βCH3 1.000(d)
Γ′CH3 1.008(d)
γCH2′ 1.284(m)
γCH2 1.459(m)
βCH 1.961(m)
Leucine δCH3 0.955(d) 3
δ′CH3 0.965(d)
δCH3 0.975(d)
γCH 1.691(m)
βCH2 1.707(m)
αCH 3.685(dd) αCH 3.753(d)
Valine γ′CH3 0.988(d) 4
CH3 1.020(d)
CH3 1.040(d)
γCH3 1.052(d)
βCH 2.285(m) αCH 3.570(d) αCH 3.617(d)
Isobutyrate CH3 1.361(d) 5
3-hydroxybutyrate γCH3 1.200(d) 6
αCH2 2.293(m)
αCH2 2.380(m)
βCH 4.131(m)
Lactate βCH3 1.341(d) 7
αCH 4.108(q)
Lysine half δCH2 1.434(m) 8
half δCH2 1.689(m) γCH2 1.719(m) half βCH2 1.886(m) half βCH2 1.897(m) εCH2 3.031(t)
αCH 3.767(t)
Alanine βCH3 1.480(d) 9
γCH2 1.492(m)
αCH 3.783(q)
NAG CH3 2.041(s) 10
Arginine γCH2 1.681(m) 11
γCH2 1.730(m)
βCH2 1.926(m)
δCH2 3.257(t)
half
δ
CH2
1.689(m)
γ
CH2
1.719(m)
half
β
CH2
1.886(m)
half
β
CH2
1.897(m)
ε
CH2
3.031(t)
α
CH
3.767(t)
Alanine
β
CH
31.480(d)
9
Molecules 2019, 24, x FOR PEER REVIEW 6 of 18
Table 2. The NMR related information of the related proton signals in the small molecules in the serum samples.
Metabolites Moieties 1H shift(δ) Peak
Num Structure
Lipid CH3 0.891(t) 1
CH3CH2CH2 1.210(m)
(CH2)n 1.221(m)
CH3CH2(CH2)n 1.232(m)
CH2 CH2CO 1.590(m)
CH2C=C 2.018(m)
CH2COO 2.238(m)
C=CCH2C=C 2.742(m)
C=CCH2C=C 2.749(m)
C=CCH2C=C 2.761(m)
Isoleucine δCH3 0.943(t) 2
βCH3 1.000(d)
Γ′CH3 1.008(d)
γCH2′ 1.284(m)
γCH2 1.459(m)
βCH 1.961(m)
Leucine δCH3 0.955(d) 3
δ′CH3 0.965(d)
δCH3 0.975(d)
γCH 1.691(m)
βCH2 1.707(m)
αCH 3.685(dd) αCH 3.753(d)
Valine γ′CH3 0.988(d) 4
CH3 1.020(d)
CH3 1.040(d)
γCH3 1.052(d)
βCH 2.285(m) αCH 3.570(d) αCH 3.617(d)
Isobutyrate CH3 1.361(d) 5
3-hydroxybutyrate γCH3 1.200(d) 6
αCH2 2.293(m)
αCH2 2.380(m)
βCH 4.131(m)
Lactate βCH3 1.341(d) 7
αCH 4.108(q)
Lysine half δCH2 1.434(m) 8
half δCH2 1.689(m) γCH2 1.719(m) half βCH2 1.886(m) half βCH2 1.897(m) εCH2 3.031(t) αCH 3.767(t)
Alanine βCH3 1.480(d) 9
γCH2 1.492(m)
αCH 3.783(q)
NAG CH3 2.041(s) 10
Arginine γCH2 1.681(m) 11
γCH2 1.730(m)
βCH2 1.926(m)
δCH2 3.257(t)
γ
CH
21.492(m)
α
CH
3.783(q)
NAG
CH
32.041(s)
10
Arginine
γ
CH
21.681(m)
11
Molecules 2019, 24, x FOR PEER REVIEW 6 of 18
Table 2. The NMR related information of the related proton signals in the small molecules in the serum samples.
Metabolites Moieties 1H shift(δ) Peak
Num Structure
Lipid CH3 0.891(t) 1
CH3CH2CH2 1.210(m)
(CH2)n 1.221(m)
CH3CH2(CH2)n 1.232(m)
CH2 CH2CO 1.590(m)
CH2C=C 2.018(m)
CH2COO 2.238(m)
C=CCH2C=C 2.742(m)
C=CCH2C=C 2.749(m)
C=CCH2C=C 2.761(m)
Isoleucine δCH3 0.943(t) 2
βCH3 1.000(d)
Γ′CH3 1.008(d)
γCH2′ 1.284(m)
γCH2 1.459(m)
βCH 1.961(m)
Leucine δCH3 0.955(d) 3
δ′CH3 0.965(d)
δCH3 0.975(d)
γCH 1.691(m)
βCH2 1.707(m)
αCH 3.685(dd) αCH 3.753(d)
Valine γ′CH3 0.988(d) 4
CH3 1.020(d)
CH3 1.040(d)
γCH3 1.052(d)
βCH 2.285(m) αCH 3.570(d) αCH 3.617(d)
Isobutyrate CH3 1.361(d) 5
3-hydroxybutyrate γCH3 1.200(d) 6
αCH2 2.293(m)
αCH2 2.380(m)
βCH 4.131(m)
Lactate βCH3 1.341(d) 7
αCH 4.108(q)
Lysine half δCH2 1.434(m) 8
half δCH2 1.689(m) γCH2 1.719(m) half βCH2 1.886(m) half βCH2 1.897(m) εCH2 3.031(t)
αCH 3.767(t)
Alanine βCH3 1.480(d) 9
γCH2 1.492(m)
αCH 3.783(q)
NAG CH3 2.041(s) 10
Arginine γCH2 1.681(m) 11
γCH2 1.730(m)
βCH2 1.926(m)
δCH2 3.257(t)
γ
CH
21.730(m)
β
CH
21.926(m)
δ
CH
23.257(t)
Molecules2019,24, 2542 7 of 16
Table 2.
Cont
.
Metabolites
Moieties
1H Shift(
δ
)
Peak Num
Structure
Acetate
CH
31.914(s)
12
Molecules 2019, 24, x FOR PEER REVIEW 7 of 18
αCH 3.774(m)
Acetate CH3 1.914(s) 12
Acetoacetate CH3 2.273(s) 13
CH2 3.441(s)
OAG CH3 2.140(s) 14
Glutamine γCH2 2.411(m) 15
γCH2 2.465(m)
αCH2 3.677(t)
Threonine γCH3 1.329(d) 16
αCH 3.487(d)
αCH 3.593(d)
Pyruvate CH2 2.318(s) 17
CH3 2.372(s)
Glutamate βCH2 2.077(m) 18
γCH2 2.351(m)
αCH 3.786(t)
Succinate CH2 2.395(s) 19
2-ketoglutarate αCH2 2.437(t) 20
Methionine αCH2 3.858(m) 21
βCH2 2.166(t)
γCH2 2.657(t)
δCH2 2.142(s)
Citrate half CH2 2.523(d) 22
half CH2′ 2.657(d)
Tyrosine half βCH2 3.058(dd) 23
half βCH2 3.158(dd) β′CH2 3.199(dd)
αCH 3.951(dd)
Asparagine half βCH2 2.836(dd) 25
half βCH2 2.941(dd)
βCH2′ 2.948(dd)
αCH 3.997(dd)
Dimethylglycine N-CH3 2.930(s) 26
CH2 3.723(s)
2-ketoisovalerate γCH3 1.111(d) 27
βCH 3.020(m)
Creatine CH3 3.040(s) 28
CH2 3.938(s)
Creatinine CH3 3.051(s) 29
Acetoacetate
CH3
2.273(s)
13
Molecules 2019, 24, x FOR PEER REVIEW 7 of 18
αCH 3.774(m)
Acetate CH3 1.914(s) 12
Acetoacetate CH3 2.273(s) 13
CH2 3.441(s)
OAG CH3 2.140(s) 14
Glutamine γCH2 2.411(m) 15
γCH2 2.465(m)
αCH2 3.677(t)
Threonine γCH3 1.329(d) 16
αCH 3.487(d)
αCH 3.593(d)
Pyruvate CH2 2.318(s) 17
CH3 2.372(s)
Glutamate βCH2 2.077(m) 18
γCH2 2.351(m)
αCH 3.786(t)
Succinate CH2 2.395(s) 19
2-ketoglutarate αCH2 2.437(t) 20
Methionine αCH2 3.858(m) 21
βCH2 2.166(t)
γCH2 2.657(t)
δCH2 2.142(s)
Citrate half CH2 2.523(d) 22
half CH2′ 2.657(d)
Tyrosine half βCH2 3.058(dd) 23
half βCH2 3.158(dd) β′CH2 3.199(dd)
αCH 3.951(dd)
Asparagine half βCH2 2.836(dd) 25
half βCH2 2.941(dd)
βCH2′ 2.948(dd)
αCH 3.997(dd)
Dimethylglycine N-CH3 2.930(s) 26
CH2 3.723(s)
2-ketoisovalerate γCH3 1.111(d) 27
βCH 3.020(m)
Creatine CH3 3.040(s) 28
CH2 3.938(s)
Creatinine CH3 3.051(s) 29
CH2
3.441(s)
OAG
CH
32.140(s)
14
Glutamine
γ
CH
22.411(m)
15
Molecules 2019, 24, x FOR PEER REVIEW 7 of 18
αCH 3.774(m)
Acetate CH3 1.914(s) 12
Acetoacetate CH3 2.273(s) 13
CH2 3.441(s)
OAG CH3 2.140(s) 14
Glutamine γCH2 2.411(m) 15
γCH2 2.465(m)
αCH2 3.677(t)
Threonine γCH3 1.329(d) 16
αCH 3.487(d)
αCH 3.593(d)
Pyruvate CH2 2.318(s) 17
CH3 2.372(s)
Glutamate βCH2 2.077(m) 18
γCH2 2.351(m)
αCH 3.786(t)
Succinate CH2 2.395(s) 19
2-ketoglutarate αCH2 2.437(t) 20
Methionine αCH2 3.858(m) 21
βCH2 2.166(t)
γCH2 2.657(t)
δCH2 2.142(s)
Citrate half CH2 2.523(d) 22
half CH2′ 2.657(d)
Tyrosine half βCH2 3.058(dd) 23
half βCH2 3.158(dd) β′CH2 3.199(dd)
αCH 3.951(dd)
Asparagine half βCH2 2.836(dd) 25
half βCH2 2.941(dd)
βCH2′ 2.948(dd)
αCH 3.997(dd)
Dimethylglycine N-CH3 2.930(s) 26
CH2 3.723(s)
2-ketoisovalerate γCH3 1.111(d) 27
βCH 3.020(m)
Creatine CH3 3.040(s) 28
CH2 3.938(s)
Creatinine CH3 3.051(s) 29
γ
CH
22.465(m)
α
CH
23.677(t)
Threonine
γ
CH3
1.329(d)
16
Molecules 2019, 24, x FOR PEER REVIEW 7 of 18
αCH 3.774(m)
Acetate CH3 1.914(s) 12
Acetoacetate CH3 2.273(s) 13
CH2 3.441(s)
OAG CH3 2.140(s) 14
Glutamine γCH2 2.411(m) 15
γCH2 2.465(m)
αCH2 3.677(t)
Threonine γCH3 1.329(d) 16
αCH 3.487(d)
αCH 3.593(d)
Pyruvate CH2 2.318(s) 17
CH3 2.372(s)
Glutamate βCH2 2.077(m) 18
γCH2 2.351(m)
αCH 3.786(t)
Succinate CH2 2.395(s) 19
2-ketoglutarate αCH2 2.437(t) 20
Methionine αCH2 3.858(m) 21
βCH2 2.166(t)
γCH2 2.657(t)
δCH2 2.142(s)
Citrate half CH2 2.523(d) 22
half CH2′ 2.657(d)
Tyrosine half βCH2 3.058(dd) 23
half βCH2 3.158(dd) β′CH2 3.199(dd)
αCH 3.951(dd)
Asparagine half βCH2 2.836(dd) 25
half βCH2 2.941(dd)
βCH2′ 2.948(dd)
αCH 3.997(dd)
Dimethylglycine N-CH3 2.930(s) 26
CH2 3.723(s)
2-ketoisovalerate γCH3 1.111(d) 27
βCH 3.020(m)
Creatine CH3 3.040(s) 28
CH2 3.938(s)
Creatinine CH3 3.051(s) 29
α
CH
3.487(d)
α
CH
3.593(d)
Pyruvate
CH
22.318(s)
17
Molecules 2019, 24, x FOR PEER REVIEW 7 of 18
αCH 3.774(m)
Acetate CH3 1.914(s) 12
Acetoacetate CH3 2.273(s) 13
CH2 3.441(s)
OAG CH3 2.140(s) 14
Glutamine γCH2 2.411(m) 15
γCH2 2.465(m)
αCH2 3.677(t)
Threonine γCH3 1.329(d) 16
αCH 3.487(d)
αCH 3.593(d)
Pyruvate CH2 2.318(s) 17
CH3 2.372(s)
Glutamate βCH2 2.077(m) 18
γCH2 2.351(m)
αCH 3.786(t)
Succinate CH2 2.395(s) 19
2-ketoglutarate αCH2 2.437(t) 20
Methionine αCH2 3.858(m) 21
βCH2 2.166(t)
γCH2 2.657(t)
δCH2 2.142(s)
Citrate half CH2 2.523(d) 22
half CH2′ 2.657(d)
Tyrosine half βCH2 3.058(dd) 23
half βCH2 3.158(dd) β′CH2 3.199(dd)
αCH 3.951(dd)
Asparagine half βCH2 2.836(dd) 25
half βCH2 2.941(dd)
βCH2′ 2.948(dd)
αCH 3.997(dd)
Dimethylglycine N-CH3 2.930(s) 26
CH2 3.723(s)
2-ketoisovalerate γCH3 1.111(d) 27
βCH 3.020(m)
Creatine CH3 3.040(s) 28
CH2 3.938(s)
Creatinine CH3 3.051(s) 29
CH
32.372(s)
Glutamate
β
CH2
2.077(m)
18
Molecules 2019, 24, x FOR PEER REVIEW 7 of 18
αCH 3.774(m)
Acetate CH3 1.914(s) 12
Acetoacetate CH3 2.273(s) 13
CH2 3.441(s)
OAG CH3 2.140(s) 14
Glutamine γCH2 2.411(m) 15
γCH2 2.465(m)
αCH2 3.677(t)
Threonine γCH3 1.329(d) 16
αCH 3.487(d)
αCH 3.593(d)
Pyruvate CH2 2.318(s) 17
CH3 2.372(s)
Glutamate βCH2 2.077(m) 18
γCH2 2.351(m)
αCH 3.786(t)
Succinate CH2 2.395(s) 19
2-ketoglutarate αCH2 2.437(t) 20
Methionine αCH2 3.858(m) 21
βCH2 2.166(t)
γCH2 2.657(t)
δCH2 2.142(s)
Citrate half CH2 2.523(d) 22
half CH2′ 2.657(d)
Tyrosine half βCH2 3.058(dd) 23
half βCH2 3.158(dd) β′CH2 3.199(dd)
αCH 3.951(dd)
Asparagine half βCH2 2.836(dd) 25
half βCH2 2.941(dd)
βCH2′ 2.948(dd)
αCH 3.997(dd)
Dimethylglycine N-CH3 2.930(s) 26
CH2 3.723(s)
2-ketoisovalerate γCH3 1.111(d) 27
βCH 3.020(m)
Creatine CH3 3.040(s) 28
CH2 3.938(s)
Creatinine CH3 3.051(s) 29
γ
CH2
2.351(m)
α
CH
3.786(t)
Succinate
CH
22.395(s)
19
Molecules 2019, 24, x FOR PEER REVIEW 7 of 18
αCH 3.774(m)
Acetate CH3 1.914(s) 12
Acetoacetate CH3 2.273(s) 13
CH2 3.441(s)
OAG CH3 2.140(s) 14
Glutamine γCH2 2.411(m) 15
γCH2 2.465(m)
αCH2 3.677(t)
Threonine γCH3 1.329(d) 16
αCH 3.487(d)
αCH 3.593(d)
Pyruvate CH2 2.318(s) 17
CH3 2.372(s)
Glutamate βCH2 2.077(m) 18
γCH2 2.351(m)
αCH 3.786(t)
Succinate CH2 2.395(s) 19
2-ketoglutarate αCH2 2.437(t) 20
Methionine αCH2 3.858(m) 21
βCH2 2.166(t)
γCH2 2.657(t)
δCH2 2.142(s)
Citrate half CH2 2.523(d) 22
half CH2′ 2.657(d)
Tyrosine half βCH2 3.058(dd) 23
half βCH2 3.158(dd) β′CH2 3.199(dd)
αCH 3.951(dd)
Asparagine half βCH2 2.836(dd) 25
half βCH2 2.941(dd)
βCH2′ 2.948(dd)
αCH 3.997(dd)
Dimethylglycine N-CH3 2.930(s) 26
CH2 3.723(s)
2-ketoisovalerate γCH3 1.111(d) 27
βCH 3.020(m)
Creatine CH3 3.040(s) 28
CH2 3.938(s)
Creatinine CH3 3.051(s) 29
2-ketoglutarate
α
CH
22.437(t)
20
Molecules 2019, 24, x FOR PEER REVIEW 7 of 18
αCH 3.774(m)
Acetate CH3 1.914(s) 12
Acetoacetate CH3 2.273(s) 13
CH2 3.441(s)
OAG CH3 2.140(s) 14
Glutamine γCH2 2.411(m) 15
γCH2 2.465(m)
αCH2 3.677(t)
Threonine γCH3 1.329(d) 16
αCH 3.487(d)
αCH 3.593(d)
Pyruvate CH2 2.318(s) 17
CH3 2.372(s)
Glutamate βCH2 2.077(m) 18
γCH2 2.351(m)
αCH 3.786(t)
Succinate CH2 2.395(s) 19
2-ketoglutarate αCH2 2.437(t) 20
Methionine αCH2 3.858(m) 21
βCH2 2.166(t)
γCH2 2.657(t)
δCH2 2.142(s)
Citrate half CH2 2.523(d) 22
half CH2′ 2.657(d)
Tyrosine half βCH2 3.058(dd) 23
half βCH2 3.158(dd) β′CH2 3.199(dd)
αCH 3.951(dd)
Asparagine half βCH2 2.836(dd) 25
half βCH2 2.941(dd)
βCH2′ 2.948(dd)
αCH 3.997(dd)
Dimethylglycine N-CH3 2.930(s) 26
CH2 3.723(s)
2-ketoisovalerate γCH3 1.111(d) 27
βCH 3.020(m)
Creatine CH3 3.040(s) 28
CH2 3.938(s)
Creatinine CH3 3.051(s) 29
Methionine
α
CH
23.858(m)
21
β
CH
22.166(t)
γ
CH
22.657(t)
δ
CH
22.142(s)
Citrate
half CH
22.523(d)
22
Molecules 2019, 24, x FOR PEER REVIEW 7 of 18
αCH 3.774(m)
Acetate CH3 1.914(s) 12
Acetoacetate CH3 2.273(s) 13
CH2 3.441(s)
OAG CH3 2.140(s) 14
Glutamine γCH2 2.411(m) 15
γCH2 2.465(m)
αCH2 3.677(t)
Threonine γCH3 1.329(d) 16
αCH 3.487(d)
αCH 3.593(d)
Pyruvate CH2 2.318(s) 17
CH3 2.372(s)
Glutamate βCH2 2.077(m) 18
γCH2 2.351(m)
αCH 3.786(t)
Succinate CH2 2.395(s) 19
2-ketoglutarate αCH2 2.437(t) 20
Methionine αCH2 3.858(m) 21
βCH2 2.166(t)
γCH2 2.657(t)
δCH2 2.142(s)
Citrate half CH2 2.523(d) 22
half CH2′ 2.657(d)
Tyrosine half βCH2 3.058(dd) 23
half βCH2 3.158(dd) β′CH2 3.199(dd)
αCH 3.951(dd)
Asparagine half βCH2 2.836(dd) 25
half βCH2 2.941(dd)
βCH2′ 2.948(dd)
αCH 3.997(dd)
Dimethylglycine N-CH3 2.930(s) 26
CH2 3.723(s)
2-ketoisovalerate γCH3 1.111(d) 27
βCH 3.020(m)
Creatine CH3 3.040(s) 28
CH2 3.938(s)
Creatinine CH3 3.051(s) 29
half CH
20
2.657(d)
Tyrosine
half
β
CH2
3.058(dd)
23
Molecules 2019, 24, x FOR PEER REVIEW 7 of 18
αCH 3.774(m)
Acetate CH3 1.914(s) 12
Acetoacetate CH3 2.273(s) 13
CH2 3.441(s)
OAG CH3 2.140(s) 14
Glutamine γCH2 2.411(m) 15
γCH2 2.465(m)
αCH2 3.677(t)
Threonine γCH3 1.329(d) 16
αCH 3.487(d)
αCH 3.593(d)
Pyruvate CH2 2.318(s) 17
CH3 2.372(s)
Glutamate βCH2 2.077(m) 18
γCH2 2.351(m)
αCH 3.786(t)
Succinate CH2 2.395(s) 19
2-ketoglutarate αCH2 2.437(t) 20
Methionine αCH2 3.858(m) 21
βCH2 2.166(t)
γCH2 2.657(t)
δCH2 2.142(s)
Citrate half CH2 2.523(d) 22
half CH2′ 2.657(d)
Tyrosine half βCH2 3.058(dd) 23
half βCH2 3.158(dd) β′CH2 3.199(dd)
αCH 3.951(dd)
Asparagine half βCH2 2.836(dd) 25
half βCH2 2.941(dd)
βCH2′ 2.948(dd)
αCH 3.997(dd)
Dimethylglycine N-CH3 2.930(s) 26
CH2 3.723(s)
2-ketoisovalerate γCH3 1.111(d) 27
βCH 3.020(m)
Creatine CH3 3.040(s) 28
CH2 3.938(s)
Creatinine CH3 3.051(s) 29
half
β
CH2
3.158(dd)
β
0CH2
3.199(dd)
α
CH
3.951(dd)
Asparagine
half
β
CH
22.836(dd)
25
Molecules 2019, 24, x FOR PEER REVIEW 7 of 18
αCH 3.774(m)
Acetate CH3 1.914(s) 12
Acetoacetate CH3 2.273(s) 13
CH2 3.441(s)
OAG CH3 2.140(s) 14
Glutamine γCH2 2.411(m) 15
γCH2 2.465(m)
αCH2 3.677(t)
Threonine γCH3 1.329(d) 16
αCH 3.487(d)
αCH 3.593(d)
Pyruvate CH2 2.318(s) 17
CH3 2.372(s)
Glutamate βCH2 2.077(m) 18
γCH2 2.351(m)
αCH 3.786(t)
Succinate CH2 2.395(s) 19
2-ketoglutarate αCH2 2.437(t) 20
Methionine αCH2 3.858(m) 21
βCH2 2.166(t)
γCH2 2.657(t)
δCH2 2.142(s)
Citrate half CH2 2.523(d) 22
half CH2′ 2.657(d)
Tyrosine half βCH2 3.058(dd) 23
half βCH2 3.158(dd) β′CH2 3.199(dd)
αCH 3.951(dd)
Asparagine half βCH2 2.836(dd) 25
half βCH2 2.941(dd)
βCH2′ 2.948(dd)
αCH 3.997(dd)
Dimethylglycine N-CH3 2.930(s) 26
CH2 3.723(s)
2-ketoisovalerate γCH3 1.111(d) 27
βCH 3.020(m)
Creatine CH3 3.040(s) 28
CH2 3.938(s)
Creatinine CH3 3.051(s) 29
half
β
CH
22.941(dd)
β
CH
202.948(dd)
α
CH
3.997(dd)
Dimethylglycine
N-CH
32.930(s)
26
Molecules 2019, 24, x FOR PEER REVIEW 7 of 18
αCH 3.774(m)
Acetate CH3 1.914(s) 12
Acetoacetate CH3 2.273(s) 13
CH2 3.441(s)
OAG CH3 2.140(s) 14
Glutamine γCH2 2.411(m) 15
γCH2 2.465(m)
αCH2 3.677(t)
Threonine γCH3 1.329(d) 16
αCH 3.487(d)
αCH 3.593(d)
Pyruvate CH2 2.318(s) 17
CH3 2.372(s)
Glutamate βCH2 2.077(m) 18
γCH2 2.351(m)
αCH 3.786(t)
Succinate CH2 2.395(s) 19
2-ketoglutarate αCH2 2.437(t) 20
Methionine αCH2 3.858(m) 21
βCH2 2.166(t)
γCH2 2.657(t)
δCH2 2.142(s)
Citrate half CH2 2.523(d) 22
half CH2′ 2.657(d)
Tyrosine half βCH2 3.058(dd) 23
half βCH2 3.158(dd) β′CH2 3.199(dd)
αCH 3.951(dd)
Asparagine half βCH2 2.836(dd) 25
half βCH2 2.941(dd)
βCH2′ 2.948(dd)
αCH 3.997(dd)
Dimethylglycine N-CH3 2.930(s) 26
CH2 3.723(s)
2-ketoisovalerate γCH3 1.111(d) 27
βCH 3.020(m)
Creatine CH3 3.040(s) 28
CH2 3.938(s)
Creatinine CH3 3.051(s) 29
CH
23.723(s)
2-ketoisovalerate
γ
CH3
1.111(d)
27
Molecules 2019, 24, x FOR PEER REVIEW 7 of 18
αCH 3.774(m)
Acetate CH3 1.914(s) 12
Acetoacetate CH3 2.273(s) 13
CH2 3.441(s)
OAG CH3 2.140(s) 14
Glutamine γCH2 2.411(m) 15
γCH2 2.465(m)
αCH2 3.677(t)
Threonine γCH3 1.329(d) 16
αCH 3.487(d)
αCH 3.593(d)
Pyruvate CH2 2.318(s) 17
CH3 2.372(s)
Glutamate βCH2 2.077(m) 18
γCH2 2.351(m)
αCH 3.786(t)
Succinate CH2 2.395(s) 19
2-ketoglutarate αCH2 2.437(t) 20
Methionine αCH2 3.858(m) 21
βCH2 2.166(t)
γCH2 2.657(t)
δCH2 2.142(s)
Citrate half CH2 2.523(d) 22
half CH2′ 2.657(d)
Tyrosine half βCH2 3.058(dd) 23
half βCH2 3.158(dd) β′CH2 3.199(dd)
αCH 3.951(dd)
Asparagine half βCH2 2.836(dd) 25
half βCH2 2.941(dd)
βCH2′ 2.948(dd)
αCH 3.997(dd)
Dimethylglycine N-CH3 2.930(s) 26
CH2 3.723(s)
2-ketoisovalerate γCH3 1.111(d) 27
βCH 3.020(m)
Creatine CH3 3.040(s) 28
CH2 3.938(s)
Creatinine CH3 3.051(s) 29
β
CH
3.020(m)
Creatine
CH
33.040(s)
28
Molecules 2019, 24, x FOR PEER REVIEW 7 of 18
αCH 3.774(m)
Acetate CH3 1.914(s) 12
Acetoacetate CH3 2.273(s) 13
CH2 3.441(s)
OAG CH3 2.140(s) 14
Glutamine γCH2 2.411(m) 15
γCH2 2.465(m)
αCH2 3.677(t)
Threonine γCH3 1.329(d) 16
αCH 3.487(d)
αCH 3.593(d)
Pyruvate CH2 2.318(s) 17
CH3 2.372(s)
Glutamate βCH2 2.077(m) 18
γCH2 2.351(m)
αCH 3.786(t)
Succinate CH2 2.395(s) 19
2-ketoglutarate αCH2 2.437(t) 20
Methionine αCH2 3.858(m) 21
βCH2 2.166(t)
γCH2 2.657(t)
δCH2 2.142(s)
Citrate half CH2 2.523(d) 22
half CH2′ 2.657(d)
Tyrosine half βCH2 3.058(dd) 23
half βCH2 3.158(dd) β′CH2 3.199(dd)
αCH 3.951(dd)
Asparagine half βCH2 2.836(dd) 25
half βCH2 2.941(dd)
βCH2′ 2.948(dd)
αCH 3.997(dd)
Dimethylglycine N-CH3 2.930(s) 26
CH2 3.723(s)
2-ketoisovalerate γCH3 1.111(d) 27
βCH 3.020(m)
Creatine CH3 3.040(s) 28
CH2 3.938(s)
Creatinine CH
CH
23.938(s)
3 3.051(s) 29Creatinine
CH
33.051(s)
29
Molecules 2019, 24, x FOR PEER REVIEW 8 of 18
CH2 4.066(s0
Phenylalanine βCH2 3.119(dd) 30
Β′CH2 3.260(dd)
αCH 3.962(dd)
αCH 3.991(dd)
Choline N(CH3)3 3.208(s) 31
NCH2 3.657(m)
OCH 4.072(m)
Phosphocholine N(CH3)3 3.218(s) 32
N CH2 3.585(m)
OCH2 4.142(m)
Glycerophosphochline N(CH3)3 3.233(s) 33
α-glucose H4 3.429(t) 35
H2 3.542(dd) H3 3.708(t) half CH2-C6 3.732(dd)
H5 3.822(dd) H6 3.840(dd)
β-glucose H2 3.242(dd) 35
H4 3.398(t)
H5 3.468(dd)
H3 3.503(t)
H6 3.743(dd)
H6′ 3.898(dd)
Betaine N(CH3)3 3.271(s) 36
OCH2 3.915(s)
Taurine CH2SO3 3.271(t) 37
CH2SO3 3.414(t)
Scyllo-inositol CHOH 3.355(s) 38
Glycine CH2 3.558(s) 39
Glycerol half CH2 3.552(dd) 40
half CH2 3.649(dd)
CH 3.795(m)
Triglycerides CH2O 4.072(m) 41
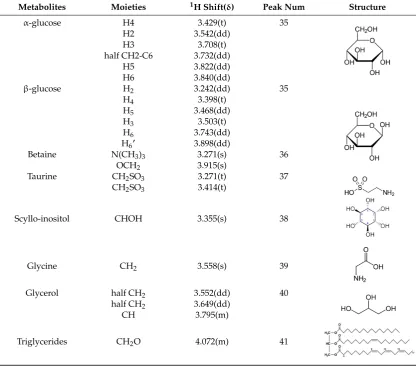
Note: The peak assignments were identified based on former publications [12,13,15,18,24–26].
CH
24.066(s0
Phenylalanine
β
CH
23.119(dd)
30
Molecules 2019, 24, x FOR PEER REVIEW 8 of 18
CH2 4.066(s0
Phenylalanine βCH2 3.119(dd) 30
Β′CH2 3.260(dd)
αCH 3.962(dd)
αCH 3.991(dd)
Choline N(CH3)3 3.208(s) 31
NCH2 3.657(m)
OCH 4.072(m)
Phosphocholine N(CH3)3 3.218(s) 32
N CH2 3.585(m)
OCH2 4.142(m)
Glycerophosphochline N(CH3)3 3.233(s) 33
α-glucose H4 3.429(t) 35
H2 3.542(dd) H3 3.708(t) half CH2-C6 3.732(dd)
H5 3.822(dd) H6 3.840(dd)
β-glucose H2 3.242(dd) 35
H4 3.398(t)
H5 3.468(dd)
H3 3.503(t)
H6 3.743(dd)
H6′ 3.898(dd)
Betaine N(CH3)3 3.271(s) 36
OCH2 3.915(s)
Taurine CH2SO3 3.271(t) 37
CH2SO3 3.414(t)
Scyllo-inositol CHOH 3.355(s) 38
Glycine CH2 3.558(s) 39
Glycerol half CH2 3.552(dd) 40
half CH2 3.649(dd)
CH 3.795(m)
Triglycerides CH2O 4.072(m) 41
Note: The peak assignments were identified based on former publications [12,13,15,18,24–26].
B
0CH
23.260(dd)
α
CH
3.962(dd)
α
CH
3.991(dd)
Choline
N(CH
3)
33.208(s)
31
Molecules 2019, 24, x FOR PEER REVIEW 8 of 18
CH2 4.066(s0
Phenylalanine βCH2 3.119(dd) 30
Β′CH2 3.260(dd)
αCH 3.962(dd)
αCH 3.991(dd)
Choline N(CH3)3 3.208(s) 31
NCH2 3.657(m)
OCH 4.072(m)
Phosphocholine N(CH3)3 3.218(s) 32
N CH2 3.585(m)
OCH2 4.142(m)
Glycerophosphochline N(CH3)3 3.233(s) 33
α-glucose H4 3.429(t) 35
H2 3.542(dd) H3 3.708(t) half CH2-C6 3.732(dd)
H5 3.822(dd) H6 3.840(dd)
β-glucose H2 3.242(dd) 35
H4 3.398(t)
H5 3.468(dd)
H3 3.503(t)
H6 3.743(dd)
H6′ 3.898(dd)
Betaine N(CH3)3 3.271(s) 36
OCH2 3.915(s)
Taurine CH2SO3 3.271(t) 37
CH2SO3 3.414(t)
Scyllo-inositol CHOH 3.355(s) 38
Glycine CH2 3.558(s) 39
Glycerol half CH2 3.552(dd) 40
half CH2 3.649(dd)
CH 3.795(m)
Triglycerides CH2O 4.072(m) 41
Note: The peak assignments were identified based on former publications [12,13,15,18,24–26].
NCH
23.657(m)
OCH
4.072(m)
Phosphocholine
N(CH
3)
33.218(s)
32
Molecules 2019, 24, x FOR PEER REVIEW 8 of 18
CH2 4.066(s0
Phenylalanine βCH2 3.119(dd) 30
Β′CH2 3.260(dd)
αCH 3.962(dd)
αCH 3.991(dd)
Choline N(CH3)3 3.208(s) 31
NCH2 3.657(m)
OCH 4.072(m)
Phosphocholine N(CH3)3 3.218(s) 32
N CH2 3.585(m)
OCH2 4.142(m)
Glycerophosphochline N(CH3)3 3.233(s) 33
α-glucose H4 3.429(t) 35
H2 3.542(dd) H3 3.708(t) half CH2-C6 3.732(dd)
H5 3.822(dd) H6 3.840(dd)
β-glucose H2 3.242(dd) 35
H4 3.398(t)
H5 3.468(dd)
H3 3.503(t)
H6 3.743(dd)
H6′ 3.898(dd)
Betaine N(CH3)3 3.271(s) 36
OCH2 3.915(s)
Taurine CH2SO3 3.271(t) 37
CH2SO3 3.414(t)
Scyllo-inositol CHOH 3.355(s) 38
Glycine CH2 3.558(s) 39
Glycerol half CH2 3.552(dd) 40
half CH2 3.649(dd)
CH 3.795(m)
Triglycerides CH2O 4.072(m) 41
Note: The peak assignments were identified based on former publications [12,13,15,18,24–26].
N CH
23.585(m)
OCH
24.142(m)
Molecules2019,24, 2542 8 of 16
Table 2.
Cont
.
Metabolites
Moieties
1H Shift(
δ
)
Peak Num
Structure
α
-glucose
H4
3.429(t)
35
Molecules 2019, 24, x FOR PEER REVIEW 8 of 18
CH2 4.066(s0
Phenylalanine βCH2 3.119(dd) 30
Β′CH2 3.260(dd)
αCH 3.962(dd)
αCH 3.991(dd)
Choline N(CH3)3 3.208(s) 31
NCH2 3.657(m)
OCH 4.072(m)
Phosphocholine N(CH3)3 3.218(s) 32
N CH2 3.585(m)
OCH2 4.142(m)
Glycerophosphochline N(CH3)3 3.233(s) 33
α-glucose H4 3.429(t) 35
H2 3.542(dd) H3 3.708(t) half CH2-C6 3.732(dd)
H5 3.822(dd) H6 3.840(dd)
β-glucose H2 3.242(dd) 35
H4 3.398(t)
H5 3.468(dd)
H3 3.503(t)
H6 3.743(dd)
H6′ 3.898(dd)
Betaine N(CH3)3 3.271(s) 36
OCH2 3.915(s)
Taurine CH2SO3 3.271(t) 37
CH2SO3 3.414(t)
Scyllo-inositol CHOH 3.355(s) 38
Glycine CH2 3.558(s) 39
Glycerol half CH2 3.552(dd) 40
half CH2 3.649(dd)
CH 3.795(m)
Triglycerides CH2O 4.072(m) 41
Note: The peak assignments were identified based on former publications [12,13,15,18,24–26].
H2
3.542(dd)
H3
3.708(t)
half CH2-C6
3.732(dd)
H5
3.822(dd)
H6
3.840(dd)
β
-glucose
H
23.242(dd)
35
H
43.398(t)
H
53.468(dd)
Molecules 2019, 24, x FOR PEER REVIEW 8 of 18
CH2 4.066(s0
Phenylalanine βCH2 3.119(dd) 30
Β′CH2 3.260(dd)
αCH 3.962(dd)
αCH 3.991(dd)
Choline N(CH3)3 3.208(s) 31
NCH2 3.657(m)
OCH 4.072(m)
Phosphocholine N(CH3)3 3.218(s) 32
N CH2 3.585(m)
OCH2 4.142(m)
Glycerophosphochline N(CH3)3 3.233(s) 33
α-glucose H4 3.429(t) 35
H2 3.542(dd) H3 3.708(t) half CH2-C6 3.732(dd)
H5 3.822(dd) H6 3.840(dd)
β-glucose H2 3.242(dd) 35
H4 3.398(t)
H5 3.468(dd)
H3 3.503(t)
H6 3.743(dd)
H6′ 3.898(dd)
Betaine N(CH3)3 3.271(s) 36
OCH2 3.915(s)
Taurine CH2SO3 3.271(t) 37
CH2SO3 3.414(t)
Scyllo-inositol CHOH 3.355(s) 38
Glycine CH2 3.558(s) 39
Glycerol half CH2 3.552(dd) 40
half CH2 3.649(dd)
CH 3.795(m)
Triglycerides CH2O 4.072(m) 41
Note: The peak assignments were identified based on former publications [12,13,15,18,24–26].
H
33.503(t)
H
63.743(dd)
H
60
3.898(dd)
Betaine
N(CH
3)
33.271(s)
36
OCH
23.915(s)
Taurine
CH
2SO
33.271(t)
37
Molecules 2019, 24, x FOR PEER REVIEW 8 of 18
CH2 4.066(s0
Phenylalanine βCH2 3.119(dd) 30
Β′CH2 3.260(dd)
αCH 3.962(dd)
αCH 3.991(dd)
Choline N(CH3)3 3.208(s) 31
NCH2 3.657(m)
OCH 4.072(m)
Phosphocholine N(CH3)3 3.218(s) 32
N CH2 3.585(m)
OCH2 4.142(m)
Glycerophosphochline N(CH3)3 3.233(s) 33
α-glucose H4 3.429(t) 35
H2 3.542(dd) H3 3.708(t) half CH2-C6 3.732(dd)
H5 3.822(dd) H6 3.840(dd)
β-glucose H2 3.242(dd) 35
H4 3.398(t)
H5 3.468(dd)
H3 3.503(t)
H6 3.743(dd)
H6′ 3.898(dd)
Betaine N(CH3)3 3.271(s) 36
OCH2 3.915(s)
Taurine CH2SO3 3.271(t) 37
CH2SO3 3.414(t)
Scyllo-inositol CHOH 3.355(s) 38
Glycine CH2 3.558(s) 39
Glycerol half CH2 3.552(dd) 40
half CH2 3.649(dd)
CH 3.795(m)
Triglycerides CH2O 4.072(m) 41
Note: The peak assignments were identified based on former publications [12,13,15,18,24–26].
CH
2SO
33.414(t)
Scyllo-inositol
CHOH
3.355(s)
38
Molecules 2019, 24, x FOR PEER REVIEW 8 of 18
CH2 4.066(s0
Phenylalanine βCH2 3.119(dd) 30
Β′CH2 3.260(dd)
αCH 3.962(dd)
αCH 3.991(dd)
Choline N(CH3)3 3.208(s) 31
NCH2 3.657(m)
OCH 4.072(m)
Phosphocholine N(CH3)3 3.218(s) 32
N CH2 3.585(m)
OCH2 4.142(m)
Glycerophosphochline N(CH3)3 3.233(s) 33
α-glucose H4 3.429(t) 35
H2 3.542(dd) H3 3.708(t) half CH2-C6 3.732(dd)
H5 3.822(dd) H6 3.840(dd)
β-glucose H2 3.242(dd) 35
H4 3.398(t)
H5 3.468(dd)
H3 3.503(t)
H6 3.743(dd)
H6′ 3.898(dd)
Betaine N(CH3)3 3.271(s) 36
OCH2 3.915(s)
Taurine CH2SO3 3.271(t) 37
CH2SO3 3.414(t)
Scyllo-inositol CHOH 3.355(s) 38
Glycine CH2 3.558(s) 39
Glycerol half CH2 3.552(dd) 40
half CH2 3.649(dd)
CH 3.795(m)
Triglycerides CH2O 4.072(m) 41
Note: The peak assignments were identified based on former publications [12,13,15,18,24–26].
Glycine
CH
23.558(s)
39
Molecules 2019, 24, x FOR PEER REVIEW 8 of 18
CH2 4.066(s0
Phenylalanine βCH2 3.119(dd) 30
Β′CH2 3.260(dd)
αCH 3.962(dd)
αCH 3.991(dd)
Choline N(CH3)3 3.208(s) 31
NCH2 3.657(m)
OCH 4.072(m)
Phosphocholine N(CH3)3 3.218(s) 32
N CH2 3.585(m)
OCH2 4.142(m)
Glycerophosphochline N(CH3)3 3.233(s) 33
α-glucose H4 3.429(t) 35
H2 3.542(dd) H3 3.708(t) half CH2-C6 3.732(dd)
H5 3.822(dd) H6 3.840(dd)
β-glucose H2 3.242(dd) 35
H4 3.398(t)
H5 3.468(dd)
H3 3.503(t)
H6 3.743(dd)
H6′ 3.898(dd)
Betaine N(CH3)3 3.271(s) 36
OCH2 3.915(s)
Taurine CH2SO3 3.271(t) 37
CH2SO3 3.414(t)
Scyllo-inositol CHOH 3.355(s) 38
Glycine CH2 3.558(s) 39
Glycerol half CH2 3.552(dd) 40
half CH2 3.649(dd)
CH 3.795(m)
Triglycerides CH2O 4.072(m) 41
Note: The peak assignments were identified based on former publications [12,13,15,18,24–26].
Glycerol
half CH
23.552(dd)
40
Molecules 2019, 24, x FOR PEER REVIEW 8 of 18
CH2 4.066(s0
Phenylalanine βCH2 3.119(dd) 30
Β′CH2 3.260(dd)
αCH 3.962(dd)
αCH 3.991(dd)
Choline N(CH3)3 3.208(s) 31
NCH2 3.657(m)
OCH 4.072(m)
Phosphocholine N(CH3)3 3.218(s) 32
N CH2 3.585(m)
OCH2 4.142(m)
Glycerophosphochline N(CH3)3 3.233(s) 33
α-glucose H4 3.429(t) 35
H2 3.542(dd) H3 3.708(t) half CH2-C6 3.732(dd)
H5 3.822(dd) H6 3.840(dd)
β-glucose H2 3.242(dd) 35
H4 3.398(t)
H5 3.468(dd)
H3 3.503(t)
H6 3.743(dd)
H6′ 3.898(dd)
Betaine N(CH3)3 3.271(s) 36
OCH2 3.915(s)
Taurine CH2SO3 3.271(t) 37
CH2SO3 3.414(t)
Scyllo-inositol CHOH 3.355(s) 38
Glycine CH2 3.558(s) 39
Glycerol half CH2 3.552(dd) 40
half CH2 3.649(dd)
CH 3.795(m)
Triglycerides CH2O 4.072(m) 41
Note: The peak assignments were identified based on former publications [12,13,15,18,24–26].
half CH
23.649(dd)
CH
3.795(m)
Triglycerides
CH
2O
4.072(m)
41
Molecules 2019, 24, x FOR PEER REVIEW 8 of 18
CH2 4.066(s0
Phenylalanine βCH2 3.119(dd) 30
Β′CH2 3.260(dd)
αCH 3.962(dd)
αCH 3.991(dd)
Choline N(CH3)3 3.208(s) 31
NCH2 3.657(m)
OCH 4.072(m)
Phosphocholine N(CH3)3 3.218(s) 32
N CH2 3.585(m)
OCH2 4.142(m)
Glycerophosphochline N(CH3)3 3.233(s) 33
α-glucose H4 3.429(t) 35
H2 3.542(dd) H3 3.708(t) half CH2-C6 3.732(dd)
H5 3.822(dd) H6 3.840(dd)
β-glucose H2 3.242(dd) 35
H4 3.398(t)
H5 3.468(dd)
H3 3.503(t)
H6 3.743(dd)
H6′ 3.898(dd)
Betaine N(CH3)3 3.271(s) 36
OCH2 3.915(s)
Taurine CH2SO3 3.271(t) 37
CH2SO3 3.414(t)
Scyllo-inositol CHOH 3.355(s) 38
Glycine CH2 3.558(s) 39
Glycerol half CH2 3.552(dd) 40
half CH2 3.649(dd)
CH 3.795(m)
Triglycerides CH2O 4.072(m) 41
Note: The peak assignments were identified based on former publications [12,13,15,18,24–26].
Note: The peak assignments were identified based on former publications [12,13,15,18,24–26].
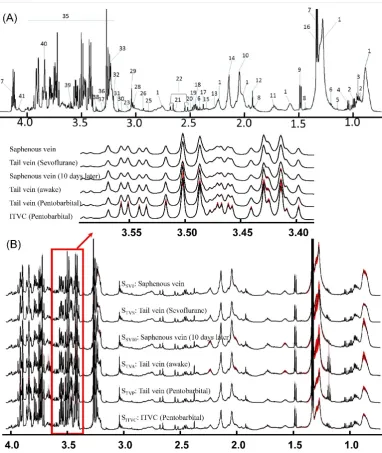
In order to evaluate the stability of these di
ff
erent blood collection methods, the average and the
standard error of the mean (SEM) of the
1H-NMR spectrum in every group were calculated point
by point after the spectral peak alignment was achieved (Figure
2
B) [
27
]. The major metabolites
in the blood sample are more stable with the blood collection methods in the awake animal from
the saphenous vein (0 day-S
SV0or 10 days later-S
SV10) or tail vein (S
TVsor S
TVA). The anesthesia
could contribute to the variation of the components especially for pentobarbital (S
TVP). Furthermore,
the bleeding site of ITVC could be used to obtain blood samples as often as necessary; however,
the metabolic components are too varied, especially for glucose (S
ITVC).
Molecules2019,24, 2542 9 of 16
to do the statistical analysis in order to describe the di
ff
erence and estimate the e
ff
ect of anesthesia on
the blood composition.
Molecules 2019, 24, x FOR PEER REVIEW 10 of 18Figure 2.
1H-NMR Spectra of blood samples. (
A
) Peak assignments of
1H-NMR spectroscopy of one
random blood sample; (
B
) Averaged
1H-NMR spectra plus its’ SEM values point by point for various
blood samples from different collection methods. Note: S:
1H-NMR signals of various blood samples;
Subscript: Please see Figure 1; Labels in Figure 2A are demonstrated in Table 2.
Molecules2019,24, 2542 10 of 16
Molecules 2019, 24, x FOR PEER REVIEW 11 of 18
Figure 3.
Differenc