http://www.sciencepublishinggroup.com/j/ajma doi: 10.11648/j.ajma.20190703.14
ISSN: 2376-6115 (Print); ISSN: 2376-6131 (Online)
Research on the RC Panel Experiments with Cushion Layer
Upon Rockfall Impact
Mei Xuefeng
1, Hu Xiewen
1, 2, *, Wu Jianli
11
Faculty of Geosciences and Environment Engineering, Southwest Jiaotong University, Chengdu, China 2
Engineering Laboratory Combined with National and Local of Spatial Information Technology of High Speed Railway Operation Safety, Southwest Jiaotong University, Chengdu, China
Email address:
*
Corresponding author
To cite this article:
Mei Xuefeng, Hu Xiewen, Wu Jianli. Research on the RC Panel Experiments with Cushion Layer Upon Rockfall Impact. American Journal of Mechanics and Applications. Vol. 7, No. 3, 2019, pp. 56-63. doi: 10.11648/j.ajma.20190703.14
Received: August 22, 2019; Accepted: November 16, 2019; Published: November 18, 2019
Abstract:
Reinforced concrete (RC) panels are widely used in the prevention and control of rockfall disasters in mountainous areas. In order to avoid the rigid damage caused by rockfalls that directly impact RC panels, the energy dissipation layer is often added to cushion the impact of rockfalls. In order to study the dynamic response of RC panels to different cushion layers under impact, a series of rockfall tests are carried out based on outdoor test platform. At the same thickness, the maximum impact force of EPS and sand composite cushion reduces by 50% compared with that of sand cushion, and the impact contact time is obviously longer than that of sand. Under the same impact condition, the center position of EPS material is crushed and collapsed, and a large number of radial cracks occur. The composite cushion layer can effectively reduce the mid-span displacement of RC Panel. At the falling height of 3 m, 5 m and 7 m, respectively, the mid-span displacement of RC Panel decreases by 37% to 46%. When sand is used as the cushion layer, the visible cracks in the middle of RC span increase from the bottom to the top. At the falling height of 7 m, the strain rate of concrete ranges from 101 ms-1 to 102 ms-1, while the strain rate of Reinforced ranges from 102 ms-1 to 103m s-1. Therefore, EPS and sand composite cushion layer is superior to sand in terms of energy dissipation effect. Compared with large-scale cluster rockfall prevention, the composite cushion layer has more advantages in preventing and treating single rockfall because of its easy damage, high cost of maintenance and replacement.Keywords:
RC Panel, Impact Test, EPS Material, Composite Cushion1. Introduction
Rock fall is one of the three geological disasters in mountainous area. In view of the Wenchuan earthquake in "5.12" in 2008, a large number of dangerous rockfall disasters [1-5], a large number of active and passive protective measures have been proposed and used, in which RC rock-shed structure and pile-slab retaining wall are widely used because of their stiffness and impact resistance property [6] (Figure 1). But if the rockfall and the concrete structure contact directly, the protective structure rigid failure will happen, besides, the rockfall may have a very big rebound or the broken spatter, thus causing the secondary threat. In order to solve this problem, the cushion distribution layer is usually added on the top of the concrete rock-shed or in front of the pile-plate
Figure 1. Common engineering structure.
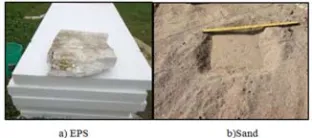
The EPS is characterized by Lightweight and good cushioning property. Using cushion material instead of part of sand to form composite cushion to improve the impact resistance of rigid structure, it can ensure the reinforced concrete structure to maintain the elastic working state, thus increasing the durability of the protective structure. At present, there are few researches on EPS and sand composite cushion. Some scholars have studied the cushion property of EPS by numerical simulation method [18, 19] and obtained the ideal energy consumption effect. However, the numerical simulation and practical application have significant differences. There is no reliable physical experiment model to verify it. In view of these problems, this paper designs the rockfall impact test platform, based on which a series of rockfall impact tests are carried out, and the cushioning properties of sand or EPS and sand composite cushion layer are compared.
Figure 2. Impact test set-up.
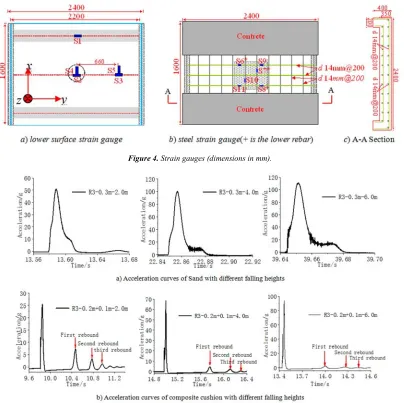
stone=1:0.5:1.5:2.8. The coarse aggregate uses continuous graded gravels of 5~15mm. The fine aggregate is natural river sand, the board vertical orthogonal up and down laying two layers of d =14mm@200 mm steel mesh, and the concrete protective layer is 20 mm thick. The rockfall hammer is made of cast concrete, including one cube, numbered R2, with a side length of 0.35 m and a mass of 107.3 kg. Two balls were numbered R1, R3 32.4 kg and 70.7 kg, respectively. The acceleration sensor in the rockfall hammer is used to collect the acceleration curves during the impact process, and the displacement sensor is placed at the center of the surface under the RC plate to monitor the mid-span displacement of the concrete slab. The lower surface of RC Panel and the inner Reinforced are bonded to the strain gauge to reflect the dynamic response of RC Panel under impact. The adhesive mode of RC panel is shown in Figure 4. Sand with uniform particle size and EPS blocks are shown in Figure 3. The EPS cushion is laid in two layers, and each layer is 10 cm thick. The impact conditions of the whole test process are shown in Table 1.
Table 1. The conditions for each experiment.
Group number
Cushion layer/m
Weight of rockfall/Kg
Falling height/m
Maximum impact energy/KJ
Sand 1 0.3 32.4 1~7 2.2
Sand 2 0.3 107.3 1~7 7.4
Sand 3 0.3 70.7 1~7 4.9
EPS-Sand 1 0.2+0.1 32.4 1~7 2.2 EPS-Sand 2 0.2+0.1 107.3 1~7 7.4 EPS-Sand 3 0.2+0.1 70.7 1~6 4.2
3. Test Results and Analysis
3.1. Acceleration Analysis
For the convenience of recording, the rules of test number are as follows: rockfall hammer number-cushion layer thickness-Falling height. For example, R1-0.2m+ 0.1m-3m represents the number.1 hammer, 0.2m thickness EPS, 0.1m sand and 3m of falling height.
Figure 4. Strain gauges (dimensions in mm).
Figure 5. Time history curve of impact acceleration under different working conditions.
Table 2.Maximum impact force and contact time.
Falling height /m
1 3 5 7
R1-0.3m
A (g) 28.0 96.7 137.7 170.6 T (ms) 36.0 25.0 18.0 16.0 F (KN) 8.9 30.7 43.8 54.2
R2-0.3m
A (g) 44.1 96.7 137.6 201.7 T (ms) 53.0 33.0 27.0 22.0 F (KN) 46.4 101.8 144.8 212.3
R3-0.3m
A (g) 33.2 73.5 111.4 141.1 T (ms) 35.0 24.0 20.0 20.0 F (KN) 23.0 51.0 77.3 97.9
R1-0.2m+0.1m
A (g) 19.5 36.3 61.2 70.2 T (ms) 88.0 74.0 69.0 63.0 F (KN) 6.2 11.5 19.5 22.3
R2-0.2m+0.1m
A (g) 18.9 47.4 95.8 162.8 T (ms) 90.0 87.0 74.0 63.0 F (KN) 19.9 49.9 100.8 171.4
R3-0.2m+0.1m
A (g) 15.0 44.9 82.7 - T (ms) 109.0 85.0 74.0 - F (KN) 10.4 31.1 57.4 -
A is peak acceleration, T is contact time and F is Maximum impact force
Figure 6. Relationship between peak acceleration and falling height.
Figure 5 shows that the acceleration time-history curve is divided into two stages: rising (compression) and falling (rebound). The total thickness is 0.3 m, the peak acceleration increases with the increase of the falling height. At the height of 2m, 4m and 6m, respectively, the acceleration peaks are 51g, 100g, 114g, respectively, and the peak acceleration of the composite cushion is 25g, 70g, 96g, respectively. The peak
1 2 3 4 5 6 7
0 30 60 90 120 150 180 210
A
c
c
e
l
e
r
a
t
i
o
n
/
g
Falling height/m R1-0.3m
R2-0.3m
R3-0.3m
R1-0.2m+0.1m
R2-0.2m+0.1m
different cushion layer impact peak acceleration with height change curve, and the results show that in both cases, peak acceleration and falling height present linear relationship. Table 1 summarizes the peak acceleration, contact time and maximum impact force under several impact conditions, in general, the contact time increases as the falling height increases. The larger the drop weight, the longer the contact time. The contact time of composite cushion layer is much greater than that of sand cushion at the same height. Therefore, increased contact time is another cause of the decrease of the maximum impact. Compared with the sand cushion impact, the ejection splash of sand particles in the process of the combined cushion layer impact (Figure 8) is also an important factor for energy dissipation.
Figure 8 shows that under the composite cushion layer impact conditions, all the rocks have to undergo several large rebounds, because the compressed EPS is partially converted into kinetic energy of the rock and the other part is converted into sand’s kinetic energy when the deformation is restored. The kinetic energy can cause sand rebound and outward splash. Under the impact of the sand cushion layer, all the rocks have no rebound, and the impact energy is absorbed by the cushion. Table 1 summarizes the peak acceleration, impact contact time and maximum impact force under different impact conditions. The maximum impact force is Newton's law:
the composite cushion layer is much longer than that of the sand layer. This is also the reason why the composite buffer layer is better than the sand buffer layer.
Corresponding to the peak acceleration is the maximum impact force. The impact force can directly indicate the maximum force generated during the impact process. For example, the R2 rockfall falling height is 5m. The maximum impact force of the sand layer is 144.8KN, and the composite layer. The maximum impact force is only 100.8KN, and the maximum impact force is reduced by 30%. In general, the impact force generated by the rockfall impact composite layer is much smaller than that of the sand layer. Because the composite cushion impact condition of R3 at 7m falling height is not done, a group data is missing in Table 2.
Figure 7 shows that the impulse time history curves of the two different cushion layers are different. The sand cushion layer impulse curve increases and then becomes gentle, while the EPS-Sand composite cushion layer impulse curve increases with time and then becomes decreases. Due to the longer impact time of the composite cushion layer, the maximum impulse is significantly larger than the maximum impulse of the sand layer. Under the falling height of 2m, 4m, 6m, the maximum impulse of the sand buffer layer is 450N•S, 610N•S, 890N•S, the maximum impulse of the composite cushion layer is 610N•S, 900N•S, 990N•S. Therefore, impulse can be used to measure the energy dissipation effect.
3.2. Analysis of EPS Failure Characteristics
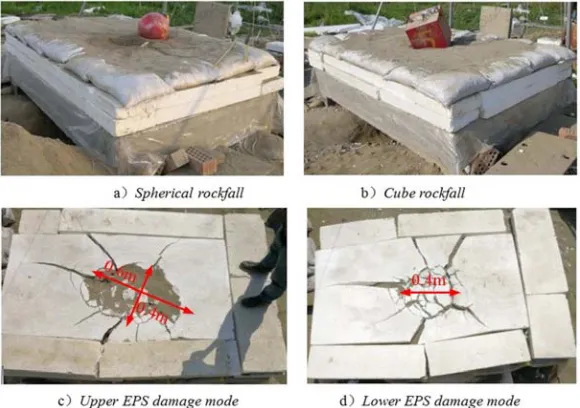
Figure 9 is the final failure form of EPS, and the two layers of EPS are all seriously deformed and damaged, in
Figure 8. Test impact process.
which the upper part of the central fracture zone is all sunk, forming an ellipsoidal crater of 0.6 m×0.4 m, and the lower
part of the central fracture zone of 0.4 m near the spherical crater, but the lower part is better than the upper one. The upper layer EPS all formed several radial cracks along the crater edge, and the crack density and extension length of the upper layer were higher than those of the lower layer. The above analysis shows that composite cushion layer have better effect than sand cushion through more energy dissipation. However, EPS is prone to plastic irrecoverable damage, and maintenance and replacement of EPS materials need to clean the upper bulk particles, resulting in a large amount of work.
3.3. RC Panel Strain and Displacement Characteristics
The time-history curves of the strain during the impact process were obtained by using RC panel base bonded with concrete strain gauge and internal reinforcing steel mesh
bonded with the strain gauge. The results (Figure 10) show that the cushion layer effect of EPS-sand combination is obviously better than that of sand, and the center point 33 sand cushion layer is 92 uε, while the composite cushion layer strain value of the same position is 34uε. The total strain reduced by 64%. Similarly, for the strain of the rebar, the two different cushion layer have the highest strain at Point 6, the sand cushion is 900 uε, and the composite cushion is 580 uε, which is reduced by 36%.
In addition, the strain in the plate direction (x-direction) is greater than that in the width direction (y-direction), the strain of the rebar and concrete under the condition of sand impact has residual deformation, while there is no residual strain in the composite cushion layer. According to the present research, both rebar and concrete materials belong to rate-related materials, which is different from static or quasi-static and mechanical properties under impact.
Figure 10. Strain characteristics of R2 rockfall at 7m falling height.
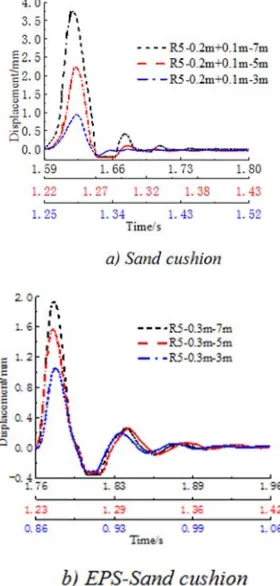
Figure 11. RC panel mid-span displacement characteristics.
Figure 12. RC plate mid-span crack.
Table 3. Reinforced and concrete strain characteristics.
Sand EPS-sand
R1 R2 R3 R1 R2
Point 1 ε (%) 6.0 26.8 12.8 3.6 20.6 γ (ms-1) 8.5 85.6 28.4 4.2 50.1
Point 2 ε (%) 8.9 92.4 46.7 3.2 31.8 γ (ms-1) 8.8 124.2 12.8 6.1 70.8
Point 3 ε (%) 7.3 12.8 11.1 6.1 10.3 γ (ms-1) 9.4 64.8 30.5 9.0 8.0
Point 6 ε (%) 140.1 903.9 303.8 96.0 552.5 γ (ms-1) 218.4 1308.4 29.2 71.8 567.0
Point 7 ε (%) 24.6 207.6 17.7 37.5 61.5 γ (ms-1) 109.6 802.1 7.6 131.0 105.6
the study [20]. The strain rate at this order of magnitude is high for dynamic impact tests.
The deflection of RC panel mid-span of sand cushion layer is 1.6mm, 2.2mm, 3.7mm, Composite cushion layer is 1.0mm, 1.5mm, 2mm, Decrease 37.5%, 31.8%, 45.9% under the same impact condition (Figure 11). However, under the impact of the two cushion layers, no large residual deformation occurred in the mid- span of the concrete panel.
In addition, in the course of the sand test, it is observed that vertical cracks visible to the naked eye appear in the span of the RC panel, and with the increase of falling height, the crack gradually extends from the bottom to the top (Figure 12). Therefore, the composite cushion layer can effectively reduce the damage of RC panel.
4. Conclusion
Impact tests are carried out to study the energy dissipation effect of sand and composite cushion layer. The results are as follows:
1)Under the same rockfall hammer impact, the peak acceleration and falling height change linearly. Compared with the sand cushion layer, the composite cushion layer can obviously lower the impact force. 2)Compared with the sand cushion layer, the contact time
of the composite cushion layer is longer, the rebound times and height are larger, and the reaction force of EPS on the overlying sand soil is greater, which is the main reason why the energy dissipation effect of the composite cushion layer is superior to that of the sand. 3)The composite cushion layer can effectively reduce the
mid-span displacement of the RC panel. At the falling height of 3 m, 5 m and 7 m, respectively, the mid-span displacement of the RC panel decreases by 37% to 46%. When the sand is used as the cushion layer, the cracks can be seen in the mid-span of the RC slab, and the composite cushion layer can protect the RC slab better. 4)At the falling height of 7 m, the strain rate of the
concrete ranges from 101 ms-1 to 102 ms-1, and the strain rate of the steel ranges from 102 ms-1 to 103 ms-1, the rate dependence of steel and concrete materials is obvious.
5)The experimental results show that although the EPS composite cushion layer has better energy dissipation, it is easy to destroy, so it will cause serious damage to EPS material because of the collision between the large-scale rockfall and the cushion layer, which will increase the maintenance and replacement cost of the structure, but the sand will only be compressed and compacted during the collision process, and will not be destroyed in a broad sense.
Acknowledgements
This work is supported by The Major Scientific and Technological Support Research Subject for the Prevention and Control of Ecological Geological Disasters in
“8.8”Jiuzhaigou Earthquake StrickenArea of Department of Natural Resources of Sichuan Province (No. KJ-2018-20).
References
[1] S M HE, D P WANG, Y WU. Formation mechanism and key prevention technology of rockfalls Chinese Journal of Nature, 2014, 36 (5): 336-345.
[2] L Q ZHANG, Z F YANG. Risk analysis of encountering rockfalls on a highway-a case study. Chinese Journal of Rock Mechanics and Engineering, 2004, 23 (21): 3700-3708.
[3] S M He, W L Zhuang, Zhang X, et al. Research on rock-fall impact prevention of Chediguan bridge pier, Duwen road. Chinese Journal of Rock Mechanics and Engineering, 2013, 32 (Suppl 2): 3421―3427.
[4] X J PEI, R Q HUANG, Z PEI, et al. Analysis on the movement characteristics of rolling rockon slope caused by intensive earthquake. Journal of Engineering Geology, 2011, 19 (4): 498-504.
[5] X F MEI, X W HU, G LUO, et al. A Study on The Coefficient of Restitution and Peak Impact of Rockfall Based on Elastic-Plastic Theory. Journal of Vibration and Shock, 2019, 27 (1): 123-133.
[6] X W HU, X F MEI, Y YANG, e t al. Dynamic Response of Pile-Plate Rock Retaining Wall Under Impact of Rockfall. Journal of Engineering Geology, 2019, 27 (1): 123-133.
[7] H Luo, W L Cooper, H Lu. Effect of Moisture on the Compressive Behavior of Dense Eglin Sand Under Confinement at High Strain Rates. International Journal of Impact Engineering, 2014, 65 (65): 40-55.
[8] J C Li, G W Ma. Experimental study of stress wave propagation across a filled rock joint. International Journal of Rock Mechanics and Mining Sciences, 2009, 46 (3): 471-478.
[9] Y Boguslavskii, S Drabkin, I Juran, et al. Theory and Practice of Projectile's Penetration in Soils. Journal of Geotechnical Engineering, 1996, 122 (10): 806-812.
[10] S Kawahara, T Muro. Effects of dry density and thickness of sandy soil on impact response due to rockfall. Journal of Terramechanics, 2006, 43 (3): 329-340.
[11] D P Visco, S Saravanan, T R K Mohan, et al. Impulse penetration into idealized granular beds: behavior of cumulative surface kinetic energy. Phys Rev E Stat Nonlin Soft Matter Phys, 2004, 70 (1): 051306.
[12] L SEAMAN. One-dimensional stress wave propagation in soils: Defense Atomic Support Agency, 1966.
[13] X YU, L CHEN, Q FANG. Experimental study on the attenuation of stress wave in coral sand. Chinese Journal of Rock Mechanics and Engineering, 2018, 37 (6): 1520-1529.
[14] Krauthammer. Modern Protective Structures, Second Edition. Crc Press, 2017.