IJEDR1803112
International Journal of Engineering Development and Research (
www.ijedr.org
)
675
Machine Learning and Artificial Neural Network
Process – Viability and Implications in Stock
Market Prediction
1T. Vanitha, 2Dr. V. Thiagarasu 1Ph.D. Scholar, 2Principal
Gobi Arts & Science College, Gobichettipalayam, Tamilnadu India
_____________________________________________________________________________________________________ Abstract-The modern world happenings are presented and stored in the form of different types of information which might not mean anything unless probed with a purpose. Data Mining is one of the methods wherein this hidden information can be extracted and disseminated to the objective. Due to the abundance of such information in different formats, manipulation of the same has also increased. In this paper, an attempt is done on predicting the movements in Indian stock market and an Indian stock market is a place where every type of investors – small and large – try to maximize their returns by understanding the price movements. But, their returns would be better if they know when the price would fall and increase. Prediction of these movements basically rests on ordinary linear regression. But after the advent of Artificial Intelligence, this has become easier by the application of Artificial Neural Network (ANN). Using different algorithms, the accuracy rate of prediction is enabled. This can be done with the help of the ANN tools and deep learning tools. In this research, the researcher made an attempt to predict the direction flow of the market using ANN tools and deep learning tools like Random Forest for the accuracy. Using BSE Sensex, the present study tries to predict the output and to find evidence to support the efficiency of the ANN. In this paper, both classification and regression are performed to find the prediction accuracy
.
Index Terms: Machine Learning, ANN, Deep Learning, Random Forest, Stock Market, Price Movements, Prediction. _____________________________________________________________________________________________________ INTRODUCTION
Data Mining is a technique where one can play with data in huge amount in size (Giga and Terabytes) of data in various fields. This kind of voluminous data is prevalently found in the stock market. Fluctuations in the market lead to a rise and fall in index number which is the barometer. The reasons behind these extreme changes are attributed to the company performance, the public image of the company, political issues, etc. Price movements can be beforehand predicted by selecting an apt algorithm for training and testing the data for accuracy. This prediction becomes difficult due to the inherent volatility of stock prices and hence accuracy in the next price movement is highly random in nature. Selection of algorithm helps the researcher to come out with the dependable output. The investors can protect them from losing if they are aware of the marker flow direction and the stability of the stock. By using the historical data the prediction of the stock price or the flowing trends is possible with the help of ANN algorithm and Machine learning algorithm. Using yearly, monthly, weekly, daily, hourly and minutes data the price is predicted accurately to the maximum. Indian Stock market data are available with BSE and NSE. In the stock market movement was calculated for daily data of NSE and BSE[1].In the prediction of the stock market for particular companies like Larsen and Turbo, Canara Bank and Ashok Leyland are found using machine learning method[2]. In this research, the researcher works on BSE(Sensex) monthly data from April 2011 to January 2018 with 82 observation and 7 variables. R studio open source language is used to predict market as bull or bear.
In stock market prediction Efficient Market Hypothesis and Random Walk are the methods which are followed by the analyst for appropriate prediction[3]. Random Walk method is used in predicting the accuracy of long-term, whereas in the short term prediction the data are in high volatility[4]. The trends can predict as bull or bear using the increase or decrease in the close index value. In this paper, the researcher tries to present the result using the classification method. The close value which is in the form of numeric value is converted into factor value and it is used to predict the value as up or down. The close value is taken as a predicted value and the other six variables are taken as the predictor variables. This study attempts to perform a basic linear regression, random forest and ANN Backpropagation for its accuracy.
LITERATURE SURVEY
IJEDR1803112
International Journal of Engineering Development and Research (
www.ijedr.org
)
676
combining online data source with traditional time-series and technical indicators are used to forecast the AAPL stock by using machine learning model, decision tree, neural network and support vector machine[10].SCOPE OF RESEARCH
The present study attempts to predict price movements in the Indian Stock Market with the help of BSE Sensex only. The same effect might not be observed in other indices. The results of this study are useful to analyst and investor to a certain extent. Replication of the same is left to future research.
STATEMENT OF THE PROBLEM
Basically, the Indian stock market follows a weak form of the efficiency of EMH theory, where price does not correctly reflect the influencing factors. Hence there is always a reason to believe that hidden information in the price of the past periods has a certain pattern which might be the strongestase for next price level that a traders quotes in the market. This study attempts to predict the direction movement of the Indian stock market. Direction flow of the stock market is predicted with monthly series of data through regression and classification method using the random forest, ANN, and linear regression algorithms. There is certainly a gap between monthly and daily observation of the stock market, which is not captured in earlier studies. This study tries to find whether this gap could be learned through proper algorithm put through the machine learning process. Through which, price movement in Indian stock market is attempted.
DESIGN OF THE STUDY
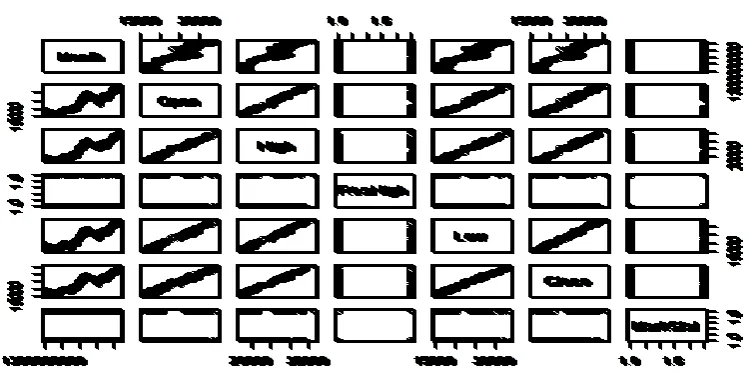
The research design is analytical and experimental. For testing the learning, data from the Bombay Stock Exchange (BSE) and National Stock Exchange (NSE) is used. Only the Market Index is taken to experiment, viz., BSE Sensex and NSE Nifty. Table 1 represents the source of the data used for the research. The data is characterized by 82 observation (monthly) of seven variables. Data used for this study is from April 2011 to January 2018 only covering six years and ten months.
Table 1 Source of Data
Data Details
Research period 1st April 2011 to 1st January 2018 Training data: Testing data 60:22
Data selection for both Random method
Data type Monthly data of the stock indices
Stock indices BSE(Sensex)
Market status Bear or Bull (UP/DOWN)
Data Mining tool and Machine learning tool.
Linear Regression, Backpropagation, Random Forest by R program.
The matrix size of the data is 82X7. The data set is divided into two sections one as a training data set and the other as testing data set. Training the data is used by applying the appropriate algorithm. Finally, the prediction is done by coupling the test data. This method is very similar to the human prediction depends on their past events. Fig 1 explains the overall structure of the data used for the research.
Fig 1. Data flow direction representation.
Monthly observation is taken to avoid noise that prevails in high-frequency data. Also, to train and test the data, very few observation goes into the system, which is not enough to get the desired outcome. Table 2 shows the different indicators adopted for forecasting.
Table 2
IJEDR1803112
International Journal of Engineering Development and Research (
www.ijedr.org
)
677
Indicators Name FormulasMonth -
Open -
High -
Low -
Close -
MarkStatu 𝑐𝑡− 𝑐𝑡−1
ResHigh 𝑐𝑡− 𝑐𝑡−1
Using open source R program, the entire forecasting is implemented. Linear regression function is used with “Close” as the dependent variable and all other variables as independent variables. Whereas in ANN and Random Forest “MarkStat” is the dependent parameter and the remaining input parameters are treated as an independent[11]. In Random Forest the MeanDecreaseGini is calculated as 12.428304 for parameter “Open” that helps in prediction accuracy.
The sensitivity and the specificity of the Random forest are calculated by the following method: Accuracy = (TP+TN)/ (TP+TN+FP+FN) (1)
Sensitivity = TP/ (TP+FN) (2) Specificity = TN/ (TN+FP) (3)
(Where TP is True Positive, TN is True Negative, FN is False Negative and FN is False Negative is used in the equation (1), (2) and (3))
DATA MINING TOOLS
The movement of the market is predicted using traditional, ANN and Machine learning algorithms. In traditional learning method, the linear regression is used.In ANN method the Backpropagation algorithm and in Machine learning method the Random Forest algorithm are used to predict the direction (UP or DOWN) efficiently with accuracy[12].
RESULTS AND DISCUSSION
Random Forest algorithm is used to predict the stock market trends, i.e., whether it is bullish or bearish by utilizing the BSE Sensex. In this process, “MarkStat” is kept as predicted variable and remaining six variables as predictors. This, in turn, helps to support the accuracy of prediction. Random Forest is trained with 500 number of trees and with 4 variables, each then is split to get the desired output. The results are exhibited in Table 3, where the error rate is 35 per cent and the accuracy rate is 65 per cent during the training period.
Table 3
Random Forest Prediction Confusion matrix
MeanDecreaseGini
Predictions with class
0 1
Best-mtry m-try OOB Error
0 1
0 24 12 1 18 6
Low 6.437664 Open 12.428304 High 9.464698
0 8 5 1 1 8
2.O OB 0.01666667 3.OOB 0.01
4.OOB 0.01
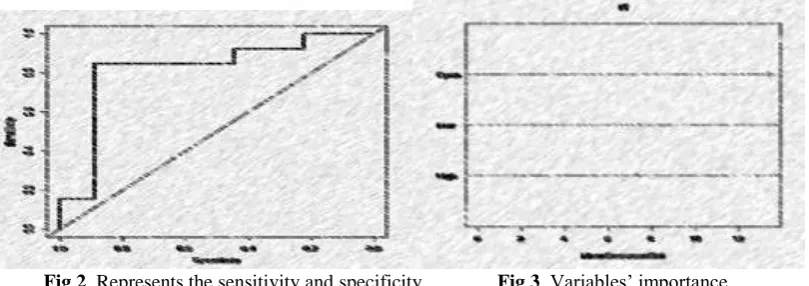
The variable “Open” plays an important role in the prediction process. Next, to “Open” it is ”High”, and “Low” are shown as the order of importance. During the testing process, the accuracy is calculated as 73 per cent and the error rate is calculated as 27 per cent. In Fig 2, sensitivity and the specificity of the prediction results are shown.
Fig 2. Represents the sensitivity and specificity Fig 3. Variables’ importance
In this stage, the prediction accuracy is increased by 12 per cent in the testing process, the best try is calculated for 3 and 4 variables split with an error out of the bag as zero, whereas in two variables split it is 0.01666667. In Fig 3 the importance of parameters is explained.
The overall accuracy of the predicted class is calculated as 73 per cent during the testing data process. The increase in a number of trees or the number of tries does not make any changes in the accuracy it found as saturated at a particular point.
IJEDR1803112
International Journal of Engineering Development and Research (
www.ijedr.org
)
678
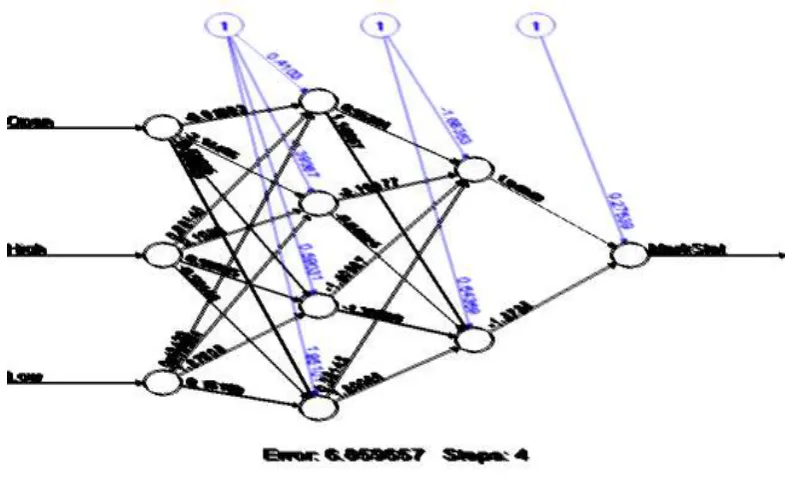
of four neurons and the other one with two neurons, a single neuron as the final outcome is considered as a dependent variable. Input layers are with the input parameters and all the neurons in hidden layers are connected to its weights and bias values to produce the output layer as a predicted outcome. In Fig 4 the outcome value is predicted with the error value of 6.859657 is found in four iterations.Fig 4. ANN Back Propagation Algorithm with input, hidden and output layers.
Random Forest representation (Fig 4) with three input neurons, 2 hidden layers with 4 and 2 neurons and 1 neuron output layer.In this ANN model “Open”,“High” and “Low” are the input layer neurons and the output layer neuron as “MarkStat”.
In this, the whole data sets are divided into two, one as training and other as testing. The data are selected in a random way, every time of execution with different sets of testing and training. The predicted output plotted is debited in Fig 5 and Fig 6.
Fig 5. Predicted value during classification Fig 6. Predicted value during regression Every time the executed values are also different. Each layer neurons are connected to its corresponding weight and bais evaluated from the previous layers should be accounted to get the resultant value. Mean square error is calculated as 0.2508862427 and root mean square error is calculated as 0.7551132406 eq. (4) and (6), and with eq.(5) and eq.(7) MAPE and RSQ are calculated with accuracy prediction as -1.804004149 and 0.9295741676. The predicted results show the appropriate accuracy. The predicted values and actual values are found as 0.44 and 0.25. In prediction, the variable “Open” indicates the higher significant variable the ANN algorithm. Variables “High” and “low” are the next significant variables in predicting the MarkStat variable.
Mean Square Error(MSE) = 1
𝑛∑ 𝑒𝑡
2 𝑛
𝑡=1 (4)
Mean Absolute Percentage Error(MAPE) = 1
𝑛∑ |𝑃𝐸𝑡|
𝑛
𝑡=1 (5)
Root Mean Square Error(RMSE) = √1
𝑛∑ 𝑒𝑡
2 𝑛
IJEDR1803112
International Journal of Engineering Development and Research (
www.ijedr.org
)
679
R-Square = ∑(𝑦̂−𝑦)̅̅̅2(𝑦−𝑦̅)2 (7)
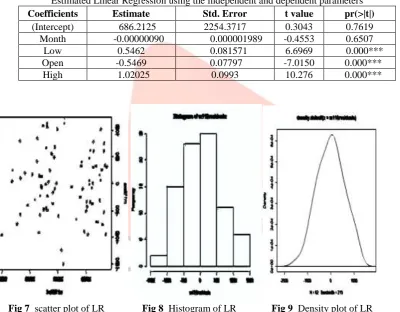
Linear regression is used to predict the accuracy with significant variables is Low and the prediction accuracy and error. The database with seven variables, but only five variables are taken for the process. All are numeric values the two-factor variables are not taken for the prediction. The predicted variable is “Close” all the other variables are taken as predictors variables in Table 4. In prediction the significant variables are “Low”,”Open” and “High” and the variable ”Month” does not give any support for the accuracy. Parameter “High” is more significant when comparing to the other two parameters. All most all the values are equal to zero. R – Square and the adjusted R - square value is representing the same value as one. Table 5 represents the prediction through linear regression with the significant variables, which is found as 55% accuracy whereas the error rate is calculated as 45%. Every time the data selection is random both in test and train data set.
Table 4
Residual value during linear regression
Min 1Q Median 3Q Max
827.55777 -219.28368 -7.98267 221.28295 761.64183
Table 5
Estimated Linear Regression using the independent and dependent parameters Coefficients Estimate Std. Error t value pr(>|t|)
(Intercept) 686.2125 2254.3717 0.3043 0.7619
Month -0.00000090 0.000001989 -0.4553 0.6507
Low 0.5462 0.081571 6.6969 0.000***
Open -0.5469 0.07797 -7.0150 0.000***
High 1.02025 0.0993 10.276 0.000***
Fig 7 scatter plot of LR Fig 8 Histogram of LR Fig 9 Density plot of LR
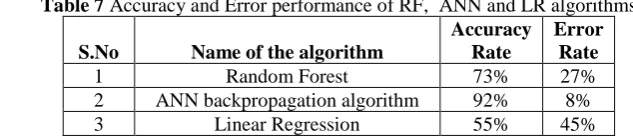
Further significance of the output is measured through Analysis of Variance Test. This is represented in Table 6, which reveals that except for MarkStat, all the remaining variables turned out to be significant. This proves the accuracy test as appropriate, which again is tabled in Table 7.
Table 6 Anova analysis
Df Sum Sq Mean Sq F value Pr(>F)
Month 1 508558673 508558673 4162.7725 < 2.2e-16 ***
Open 1 47051806 47051806 385.1394 4.822e-11 ***
High 1 11027788 11027788 90.2672 3.248e-07 ***
Low 1 2985584 2985584 24.4383 0.0002685 ***
MarkStat 1 441632 441632 3.6149 0.0796584
ResHigh 1 850529 850529 6.9619 0.0204523 *
Residuals 13 1588187 122168
IJEDR1803112
International Journal of Engineering Development and Research (
www.ijedr.org
)
680
Table 7 Accuracy and Error performance of RF, ANN and LR algorithmsS.No Name of the algorithm
Accuracy Rate
Error Rate
1 Random Forest 73% 27%
2 ANN backpropagation algorithm 92% 8%
3 Linear Regression 55% 45%
CONCLUSION AND RECOMMENDATION
The present study contributes significantly to the current perception and the effectiveness of Machine Learning as a tool in prediction. The traditional approach of regression algorithm is outperformed by ANN and Random Forest. This adequately helps an analyst and an investment advisor of the forthcoming market movements. The study used only monthly observation for forecasting. This can be further probed with daily and hourly observation also. This surely will enhance the accuracy level of forecasted outcome.
REFERENCES
[1] S. D. Patel, D. Quadros, V. Patil, M. Pawale, and H. Saxena, “www.ijemr.net Stock Prediction using Neural Networks,” Int. J. Eng. Manag. Res., vol. 7, no. 2, pp. 490–493, 2017.
[2] K. S. Mathad, S. Chittal, S. Sharma, S. Mulik, and K. Rajhansh, “Share Market Analysis and Prediction System using Machine Learning,” vol. 7, no. 6, pp. 12795–12800, 2017.
[3] E. Chong, C. Han, and F. C. Park, “Deep learning networks for stock market analysis and prediction: Methodology, data representations, and case studies,” Expert Syst. Appl., vol. 83, pp. 187–205, 2017.
[4] X. Zhong and D. Enke, “A comprehensive cluster and classification mining procedure for daily stock market return forecasting,” Neurocomputing, vol. 267, pp. 152–168, 2017.
[5] Y. Kara, M. Acar Boyacioglu, and Ö. K. Baykan, “Predicting direction of stock price index movement using artificial neural networks and support vector machines: The sample of the Istanbul Stock Exchange,” Expert Syst. Appl., vol. 38, no. 5, pp. 5311–5319, 2011.
[6] J. Patel, S. Shah, P. Thakkar, and K. Kotecha, “Predicting stock and stock price index movement using Trend Deterministic Data Preparation and machine learning techniques,” Expert Syst. Appl., vol. 42, no. 1, pp. 259–268, 2015. [7] T. Vanitha and V. Thiagarasu, “Artificial Neural Network in Predicting Price Movements in Stock Market – A Literature
Survey,” vol. 13, no. 1, pp. 185–193, 2018.
[8] M. Göçken, M. Özçalici, A. Boru, and A. T. Dosdoʇru, “Integrating metaheuristics and Artificial Neural Networks for improved stock price prediction,” Expert Syst. Appl., 2016.
[9] Y. Pan, Z. Xiao, X. Wang, and D. Yang, “A multiple support vector machine approach to stock index forecasting with mixed frequency sampling,” Knowledge-Based Syst., vol. 122, pp. 90–102, 2017.
[10] B. Weng, M. A. Ahmed, and F. M. Megahed, “Stock market one-day ahead movement prediction using disparate data sources,” Expert Syst. Appl., vol. 79, pp. 153–163, 2017.
[11] A. Oztekin, R. Kizilaslan, S. Freund, and A. Iseri, “A data analytic approach to forecasting daily stock returns in an emerging market,” Eur. J. Oper. Res., vol. 253, no. 3, pp. 697–710, 2016.
[12] P.-C. Chang, C.-H. Liu, J.-L. Lin, C.-Y. Fan, and C. S. P. Ng, “A neural network with a case based dynamic window for stock trading prediction,” Expert Syst. Appl., vol. 36, no. 3, pp. 6889–6898, 2009.