Abstract—As widely noted by researched in last decades, an automotive brake system works by transforming kinetic energy of vehicle into thermal energy, and dissipating the energy through heat conduction. The typical concerns in this kind of system are the noise problems in high frequency which can be figured the vibration characteristics out though modal analysis of the system. As noted in recent research, the mentioned problem is mainly related with the specific modes of components where potentially can be superposed. The separation of these modes should be handled as a crucial design consideration at the initial stage of development. The rotor is a significant contributor of noise and vibration, hence the modal separation is to be considered in designing detail shapes of the component, since the shape of the object generally affects the mode frequencies. In this study, frequency sensitivity analysis through finite element method by design of experimental process has conducted to find the dominant shape factors among the multiple designable figures of the rotor body. Several shape factors are selected as design variables for the implementation of the modal separation process. The contribution of the shape factor to the mode frequency transition has calculated to achieve the optimal design of given component.
Index Terms—Disc brake, squeal noise, taquchi method, modal separation.
I. INTRODUCTION A. Brake Noise
Research of automotive brakes has been practiced by automotive manufacturers for decades due to the importance of the brake system as a significant contributor to the safe operation of vehicles as well as the safety of the vehicle’s occupants. Recently, vehicle issues such as quietness and passenger comfort have become a major concern. As a result, researchers for the automotive industry face the challenging problem of managing the noise, vibration and hardness (NVH) issues of brake systems [1], [2]. In previous reviews, Millner et al. [3] listed a wide classification of brake noise and vibration phenomena such as judder and squeal. For the case of squeal noise, it is well known that the noise is due to friction induced vibration or self-excited vibration of the rotating disc during the late stage of the braking sequence [4], [5].
It is assumed from former studies that the squeal noise is
Manuscript received May 10, 2017; revised July 12, 2017. This work was supported by Global Competitive Technology Development Program, Grant No. 10052284, funded by Korea Evaluation Institute of Industrial Technology.
Bawoo Cha, Taeksu Jung, Yunhwa Hong, and Chongdu Cho are with the Department of Mechanical Engineering, Inha University, Incheon, 22212, South Korea (e-mail: [email protected]).
Cheongmin Kim and Younghoon Hong are with R&D Center of HanYang-Precision, Kimpo, 10048, South Korea
induced by dynamic instability, circumstances during the braking sequence, and the constitution of the braking system itself. However, identifying all the mentioned factors required for designing a squeal preventive brake starting from an initial drawing is not a simple task. Therefore, several research efforts have been published regarding the discovery of applicable methods in an attempt to understand, predict, and prevent squeal occurrence through experimental, analytical, and numerical methods [6]. Moreover, the use of complex eigenvalue analysis for brake squeal has been widely accepted in industry [7], [8]. Mode frequency based research has been used to predict brake squeal occurrence since the early 2000’s. It was determined from numerical simulation and experimental results for disc brake systems that unstable modes were generated at the frequency of the particular mode superposition [9].
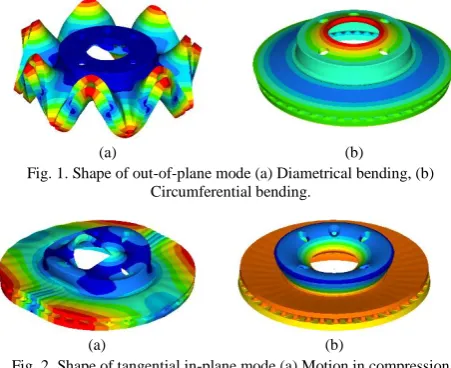
The mode shape of the brake rotor can be classified as in-plane mode or out-of-plane mode by the prior direction of the motion as shown in Figs. 1 and 2. In-plane modes are further categorized as tangential or radial modes. The tangential modes have two prior directions of motion, i.e., compression direction or shear direction. In addition, the tangential modes are a significant contributor to the dynamic instability of the brake rotor. The tangential and radial modes, which experience different prior motion directions, were previously studied using analytical and experimental methods by other researchers. Subsequently, it was determined that the compression directional tangential in-plane mode played a dominant role in the generation of dynamic instability [10]. Out-of-plane modes were further classified as diametrical bending or circumferential bending modes. Chen et al. [11] assumed the coupling of two adjacent modes (compression directional tangential in-plane mode and diametrical bending mode) as the dominant cause of the squeal noise.
Fig. 1. Shape of out-of-plane mode (a) Diametrical bending, (b) Circumferential bending.
Fig. 2. Shape of tangential in-plane mode (a) Motion in compression direction, (b) Motion in shear direction.
Bawoo Cha, Taeksu Jung, Yunhwa Hong, Sungsu Park, Cheongmin Kim, Younghoon Hong, and Chongdu Cho
Design Optimization of Disc Brake for Reducing Squeal
Noise by Frequency Sensitivity Analysis
(a) (b)
B. Design of Experiment Taguchi Method
The Taguchi method is an approach for planning and analyzing experiments that allows for optimization of functional properties at the initial design stage and is widely adopted program used in various fields of research. A well-planned set of experiments, in which all parameters of interest varied over a specified range, will obtain systematic data for presenting the effect of the control factors to the functional properties [12].
A product generally has functional properties which have desirable goals and are identified as the ideal values. These ideal values can be divided into several categories in accordance with the Taguchi method including the smaller-is-better case, the larger-is-better case or, finally, the nominal-is-better-case. Researchers have made efforts to determine the ideal cases; however, there are obvious obstacles such as usage, environment, product deterioration and production imperfections. These obstacles are termed as noise factors that cause functional properties to separate from the ideal cases. The Taguchi method adopts a loss function to quantify the separation as
* ( )+ {
}
{
}
(1)where represents the functional properties, is the expected value, is the expected loss, is the variance of , and is the average of .
In addition, the Taguchi method is based on orthogonal array experiments that provide a significantly reduced variance based on the optimum settings of the control parameters. The orthogonal arrays provide a set of well-balanced experiments and signal-to-noise ratios (S/N) that assists in data analysis and prediction of optimum results [13].
C. Subject of the Research
The effective design method for squeal noise reduction by separation of specific coupled modes will be introduced in following chapters. This type of design method, known as modal separation, presents discrepancies regarding the output of the application for single part or an assembled system. For this aspect, Lee et al. [14] calculated the level of contribution for the modes that were related to the squeal noise for each component that constitute the brake system. The vector contribution method and kinetic energy contribution method were adopted for this calculation. In addition, it was revealed that the rotor was the dominant contributor, representing 51.3 % of the squeal noise among 13 different parts including the rotor, knuckle and hub. For this connection, a rotor that has a significant relationship with the occurrence of squeal noises should be controlled to avoid mode coupling from the initial design stage.
In this research, the design variables, which are related to squeal noise, have been selected and arrayed by the Taguchi method using a commercially available rotor. Additionally, the rotor will be analyzed by a finite element method to understand the frequency sensitivity. Through this analysis, the dominant factors among the multiple designable shapes on the rotor body are prioritized for practical application on the rotor design, and analyzed for understanding their effect
on the mode frequency transition.
II. DESIGN OF EXPERIMENT A. Overview
This paper increases the understanding of the relationship between mode frequency transition and shape modification, which is practiced in accordance with the procedure described in Fig. 3. The control factor in this study is focused on the rotor, as a single part, given that it was a dominant contributor to the squeal noise. The experiment and analysis plan based on the Taguchi method was designed at the initial stage of this study. It was aimed to translocate the frequency of the squeal-related modes such as the compression directional tangential in-plane mode and diametrical bending mode. The ideal value was set as the larger-the-better case, since a large distance between squeal-related modes created a dynamically stable condition for the rotor.
Fig. 3. Flow chart of the research.
The reliability of the finite element analysis model was achieved by the correlation between the modal test result and the modal analysis result based on the original shaped rotor. According to the orthogonal array, the shape-modified geometry and finite element model were made based on the reliable analysis model where the modal analysis was practiced for these models. Finally, the results were evaluated by the S/N ratio where it was discovered that the particular shape modification for the rotor could ensure the modal transition was an outcome.
B. Constitution of Finite Element Model
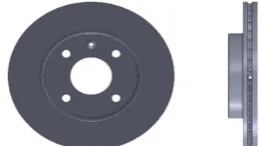
The geometry of the selected target component is shown in Fig. 4. The component was a 13-inch commercial rotor for a lightweight vehicle, which has 236 mm outer diameter and a height of 41 mm.
The material properties of the rotor used for the analysis was adopted from a general library. The brake rotors were made with gray case iron, which has material properties mentioned in Table I [15].
TABLEI:MATERIAL PROPERTIES OF GRAY CAST IRON
Material Gray Cast Iron
Density 7070 kg/m³
Poisson’s Ratio 0.29
Modulus of Elasticity 121 GPa
The finite elements of the selected rotor geometry were constituted as shown in Fig. 5. The model was organized using 8-node hexahedron elements and 6-node triangular prism elements. The total number of elements and nodes used were 153,783 and 183,757, respectively. To ensure the performance of a reliable simulation the nodes and elements were constrained for the other modified models in the orthogonal array.
Fig. 5. Finite element model of 13-inch disc brake.
The boundary conditions for the analysis were applied as free-free conditions to allow the structure to vibrate freely without any interference from other objects [16]. For the frequency range of interest, the region from 1 Hz to 21,000 Hz was selected for simulating the desired compression directional tangential in-plane mode, which generally occurred three times within the chosen frequency range.
C. Correlation with Experimental Result
For the purpose of validating the test data with the analysis results, the modal test result was measured based on the original brake rotor using the equipment shown in Fig. 6.
Fig. 6. Experiment equipment for frequency response function.
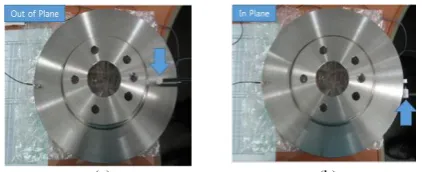
Frequency response functions were measured at the free-free boundary conditions by exciting the component with an impact hammer in two different directions, as shown
in Fig. 7. The modal frequencies related to the out-of-plane mode resulted from the perpendicular directional excitation as shown in Fig. 7(a). Alternately, the frequencies for the in-plane mode resulted from the transverse directional excitation as shown in Fig. 7(b).
(a) (b)
Fig. 7. Excitation direction for modal test (a) out-of- plane direction, (b) in-plane direction.
Each excitation for the two different directions was carried out five times. The outcomes were calculated as the average frequency of the peak occurrence. The modal test results from the original rotor was plotted as shown in Fig. 8.
The correlation of the frequency response function between the actual part and the analysis model was accomplished by modifying the material properties of the model to be within the nominal range of the gray cast iron.
Table Ⅱ shown below, provides the correlation results after finite element model modification. The average of the difference between the analysis result and the measured data was calculated as 0.47 %, which is considered to be in good agreement.
Fig. 8. Frequency response function as measured.
D. Design Parameters
A brake system represents an assembly of several individual parts such as pads, caliper and a hub. Therefore, the assembled condition of the rotor and connected parts act as a factor restricting the designed shapes. In this study, the goal was to analyze the shapes that are not related to the connected parts of the brake system. Therefore, the shape of the vane on the rotor was the primary focus of our research. The design parameters reviewed in this paper were selected
TABLEII:CORRELATION BETWEEN EXPERIMENT AND ANALYSIS
Index
Out-of-plane modes In-plane modes
2nd 3rd 4th 5th 6th 7th 8th 9th 10th 11th 1st 2nd 3rd
Analysis [Hz] 1347 3154 5143 7281 9497 11750 14020 16310 18610 20930 9166 13750 19090
Experiment [Hz] 1355 3163 5139 7253 9448 11678 13959 16231 18538 20881 9204 13860 19262
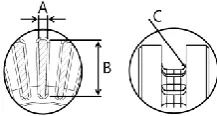
as shown in Fig. 9. The control factors were located on the vane. Additionally, the control factors did not have any effect on the adjacent parts.
Fig. 9. Design parameters of the vane on the brake rotor.
The design of the experiment was planned based on the three factors shown on Fig. 9. Additionally, each of the factors were controlled in three dimensions as shown in Table Ⅲ.
TABLEIII:DESIGN PARAMETERS
A (Width) B (Length) C (Fillet)
1 4.2 mm 41.25 mm 2 mm
2 4.7 mm 41.75 mm 2.5 mm
3 5.2 mm 42.25 mm 3 mm
Based on the three dimensions and the three levels, the orthogonal array as organized as shown in Table IV. Nine cases in total were developed for understanding relationship of the frequency transition through shape modification. These cases were modeled for following steps.
TABLEIV:ORTHOGONAL ARRAY WITH DESIGN PARAMETER ON VANE
Model A (Width) B (Length) e C (Fillet)
Case 1 1 1 1 1
Case 2 1 2 2 2
Case 3 1 3 3 3
Case 4 2 1 2 3
Case 5 2 2 3 1
Case 6 2 3 1 2
Case 7 3 1 3 2
Case 8 3 2 2 3
Case 9 3 3 1 1
III. FINITE ELEMENT ANALYSIS
A. Finite Element Analysis Result
Table V shows the results of the modal analysis based on the vane modified cases in accordance with the orthogonal array. The results include eleven out-of-plane modes and three in-plane modes within the region of interest from 1 Hz to 21,000 Hz. For understanding the trend of the modal separation, the position of the in-plane mode frequency was analyzed for all cases. Cases 1, 2 and 9 had a 1st in-plane mode frequency between the 6th and 7th out-of-plane mode frequency. Otherwise, the other cases 1st in-plane mode was located between the 5th and 6th out-of-plane mode frequency. Also, for the 2nd in-plane mode frequency, Cases 4, 7 and 8 experienced at the next 7th out-of-plane mode frequency. However, the 2nd in-plane mode for the other cases were located at the next 8th out-of-plane mode frequency.
This means that the transition tendency of the in-plane mode and out-of-plane mode frequencies indicated separated behavior for each case. For this connection, the S/N ratios for the in-plane mode and out-of-plane mode frequencies were calculated separately.
B. Calculation for Contributions
Table VI shows the average of the levels and the amount of contributions for the out-of-plane mode frequencies, where u is average value for overall levels. Based on the mentioned table, the S/N ratio was calculated and plotted as shown in Fig. 10.
The calculated S/N ratios show that the contribution from factors A and C with a level 3 value provided the dominant portion of the out-of-plane mode frequency transition.
TABLEVI:THE AVERAGE LEVELS AND AMOUNT OF CONTRIBUTION FOR OUT-OF-PLANE MODES
Level Average
Amount of contribution
u 10356.6
A (Width)
A1 10218.9 a1 -137.5
A2 10342.2 a2 -14.4
A3 10508.6 a3 152
B (Length)
B1 10443 b1 86.5
B2 10329.6 b2 -27
B3 10297 b3 -59.5
C (Fillet)
C1 10248.6 c1 -108
C2 10310.8 c2 -45.9
C3 10510.8 c3 153.9
TABLEV:MODAL ANALYSIS RESULTS
Model
Out-of-plane modes In-plane modes
2nd 3rd 4th 5th 6th 7th 8th 9th 10th 11th 1st 2nd 3rd
Case 1 1337 3092 4989 6995 9058 11150 13280 15440 17630 19850 9295 13880 19350
Case 2 1300 3015 4874 6849 8883 10950 13040 15160 17310 19490 8988 13450 18710
Case 3 1309 3047 4943 6967 9055 11180 13320 15490 17680 19890 8971 13440 18670
Case 4 1309 3066 5005 7088 9247 11440 13660 15890 18130 20400 8957 13410 18650
Case 5 1302 3027 4906 6905 8967 11060 13180 15320 17480 19670 8952 13410 18640
Case 6 1309 3050 4951 6983 9080 11220 13370 15550 17740 19960 8960 13430 18660
Case 7 1308 3064 5004 7090 9250 11450 13660 15890 18130 20390 8926 13370 18600
Case 8 1315 3090 5060 7190 9405 11660 13930 16220 18510 20820 8936 13400 18600
(a) (b)
(c)
Fig. 10. S/N ratio of out-of-plane modes. (a) factor A, (b) factor B, (c) factor C.
(a) (b)
(c)
Fig. 11. S/N ratio of in-plane modes. (a) factor A, (b) factor B, (c) factor C.
The average levels and the amount of contributions for in-plane mode frequencies are described in Table VII. The S/N ratio was plotted in Fig. 11 by calculating the results from the data mentioned in Table VIII. It is observed from the S/N ratio that the contribution for in-plane mode frequency transition was dominantly made by factor Cat level 1. The amount of contribution indicated considerable difference with the other outcomes of factors A and B.
Therefore, it is understood that the fillet radius (C) of the vane shape was the dominant frequency sensitive control factor, and the amount of contribution exhibited a significant difference when compared with the other factors. Additionally, the tendency was where the design factors for the rotor vane were principally related with in-plane mode frequency transition.
TABLEVIII:THE AVERAGE LEVELS AND AMOUNT OF CONTRIBUTION FOR IN-PLANE MODES
Level Average
Amount of contribution
u 13784.4
A (Width)
A1 13861.7 a1 77.1
A2 13674.3 a2 -110.1
A3 13817.3 a3 33
B (Length)
B1 13826.3 b1 42
B2 13676.3 b2 -108.2
B3 13850.3 b3 66.2
C (Fillet)
C1 14005.7 c1 221.3
C2 13677.3 c2 -107.3
C3 13670.7 c3 -114
IV. VERIFICATION BY EXPERIMENT A. Experiment for Modified Part
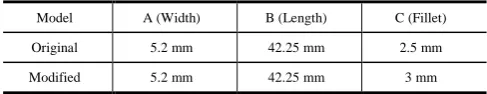
The dominant design factor of the vane’s fillet radius was discussed in the previous sections. This result was verified for this research by experimental methods. From the factors revealed, the fillet radius was modified from the original part for verification in accordance with the analyzed model dimensions. Table VIII shows the dimensional comparison of the control factors between the original part and modified part. Additionally, as shown in the table, only the fillet radius was modified from 2.5 mm to 3 mm.
TABLEVIII:DIMENSION COMPARISON OF CONTROL FACTORS BETWEEN ORIGINAL PART AND MODIFIED PART
Model A (Width) B (Length) C (Fillet)
Original 5.2 mm 42.25 mm 2.5 mm
Modified 5.2 mm 42.25 mm 3 mm
The modified fillet radius part was tested in accordance with the experimental conditions previously explained in Section 2.3 above. The excitations for the two different directions were carried out five times. The outcome was calculated as the average frequency of the peak occurrence.
B. Result of Verification
The correlation between the modified part and the original part was accomplished in accordance with the frequency response functions as measured for each part. The outcomes from each test are shown in Table Ⅸ. The frequency response function from the modified rotor was plotted in Fig. 12. Plots on the figure indicate the frequency response function from in-plane mode and out-of-plane mode. Additionally, the peaked points on the plot were considered as critical frequencies.
Fig. 12. Frequency response function measured from the modified part.
separation between the original part and the modified part are shown in Table X.
TABLEX:MODAL SEPARATION OF ORIGINAL AND MODIFIED PART
Model
Modal Separation
1st IP 2nd IP 3rd IP
Front OP
Back OP
Front OP
Back OP
Front OP
Back OP Original
[Hz] 1951 244 2183 99 724 1620 Modified
[Hz] 1738 455 1826 433 263 2077 Compare
[%] -10.9 86.4 -16.3 337.3 -63.6 28.2
The results shown in Table X indicated that the distance from the IP (in-plane mode) to the OP (out-of-plane mode) was dispersed at the 1st and 2nd in-plane modes. For the 3rd in-plane mode, the frequency difference decreased creating dynamic instability. However, the modified part had a more robust design for the squeal occurrence even for the 3rd in-plane mode case around 19,000 Hz since the prior frequency range for squeal occurrence was from 1,000 Hz to 16,000 Hz.
V. CONCLUSION
This study was based on prior research which revealed the relationship between brake squeal noise and modal superposition. The study then attempted to classify the design factors of the brake rotor to determine the dominant factors affecting modal separation. As a result of the analysis, the fillet radius of the vane was identified as having considerable influence over the modal separation. The calculated S/N ratio indicated the distinct tendency of the in-plane and out-of-plane mode to undergo a factor value change. This resulted in a relatively small modal transition of the out-of-plane mode, while for the in-plane mode a larger value for the factors brought about a larger mode movement.
These results indicate that the selected controllable factor was suitable to achieve the modal separation. Additionally, the modal separation was necessary to divide the compression directional tangential in-plane mode and the diametrical bending mode. This division occurred because the in-plane mode can only be transferred in accordance with an increase of the controllable factors since the out-of-plane mode did not move significantly.
This outcome, as a measure of squeal reduction, could be applied at the initial design stage by brake system manufacturers. However, it should be noted that for this application, decreased structural stiffness may occur because of the proposed vane modification. Moreover, the results will be more valuable based on an understanding of the quality control of the vane fabrication since it was revealed that the vane had a significant relationship with the occurrence of brake squeal.
REFERENCES
[1] M. S. Qatu, “Recent research on vehicle noise and vibration,” International Journal of Vehicle Noise and Vibration, vol. 8, no. 4, pp. 289-301, 2012.
[2] S. Brandl, W. Biermayer, B. Graf, and T. Resch, “Hybrid vehicle’s NVH challenges and influences on the NVH development,” SAE
Technical Paper, 2016.
[3] N. Millner, “An analysis of disc brake squeals,” SAE Technical Paper, No. 780332, 1978.
[4] A. Rahman, M. Arsyad, M. K. A. Hamid, M. Lazim, and A. Razimi, “The road particle effect on squeal noise of disc braking system,”
Applied Mechanics and Materials, vol. 819, pp. 563-568, 2016.
[5] M. S. Xie, G. R. Zhang, J. H. Li, R. Fritsch, “Brake pad taper wear on brake moan noise,” International Journal of Automotive Technology, vol. 15, no. 4, pp. 565-571, 2016.
[6] N. M. Kinkaid, O. M. O'reilly, P. Papadopoulos, “Automotive disc brake squeal,” Journal of Sound and Vibration, vol. 267, no. 1, pp. 105-166, 2003.
[7] P. Liu, H. Zheng, C. Cai, Y. Y. Wang, C. Lu, K. H. Ang, and G. R. Liu, “Analysis of disc brake squeal using the complex eigenvalue method,” Applied Acoustics, vol. 68, no. 6, pp. 603-615, 2007. [8] S. Carvajal, D. Wallner, R. Helfrich, and M. Klein, “Excellent brake
NVH comfort by simulation-use of optimization methods to reduce squeal noise,” SAE Technical Paper, 2016.
[9] D. N. Vanderlugt, “Analytical and experimental study of automotive disc brake squeal vibration,” M.S. thesis, Dept. Mechanical. Eng., Purdue Univ, Indiana, United States, 2004.
[10] A. Papinniemi, J. Zhao, D. Stanef, and J. Ding, “An investigation of in-plane vibration modes in disc brake squeal noise,” SAE Technical
Paper, 2005.
[11] F. Chen, D. Mckillip, J. Luo, and S. F. Wu, “Measurement and analysis of rotor in-plane mode induced disc brake squeal and beyond,” SAE
Technical Paper, 2004.
[12] G. Taguchi, “Introduction to quality engineering: designing quality into products and processes,” Asian Productivity Organization, Tokyo, 1986.
[13] G. Taguchi and S. Konishi, “Orthogonal arrays and linear graphs: tools for quality engineering,” American Supplier Institute, 1987.
[14] J. G. Lee, H. S. Lim, H. Y. Kim, and J. W. Baek, “The prediction of brake corner module squeal noise using participation factor analysis,” Transactions of the Korean Society of Mechanical
Engineers A, vol. 33, no. 10, pp. 1074-1080, 2009.
[15] H. T. Angus, “Cast iron: Physical and engineering properties,” Elsevier, 2013
[16] S. W. Kung, K. B. Dunlap, and R. S. Ballinger, “Complex eigenvalue analysis for reducing low frequency brake squeal,” SAE Technical
Paper, No. 2000-01-0444, 2000.
Chongdu Cho has been teaching as a professor of mechanical engineering at Inha University, Incheon, South Korea since 1992. He has won a fellow professorship at Inha University since 2008. Dr. Chongdu Cho received his Ph.D. in mechanical engineering and applied mechanics from the University of Michigan, Ann Arbor, Michigan, USA. He received in mechanical engineering his bachelor of science at Seoul National University and a Master in Science at KAIST, South Korea. His major research area is the thermo-mechanical behavior of materials and composites and their fracture mechanics. He also has numerous publications on NEMS/MEMS in the field of Carbon nanotubes, micro switches and biosensors. He has published more than 160 SCI(e) peer reviewed international papers, 135 international conference proceedings and numerous domestic articles and papers.
TABLEIX:COMPARISON BETWEEN ORIGINAL AND MODIFIED PARTS
Model
Out-of-plane In-plane
2nd 3rd 4th 5th 6th 7th 8th 9th 10th 11th 1st 2nd 3rd
Original [Hz] 1355 3163 5139 7253 9448 11678 13959 16231 18538 20881 9204 13860 19262