Abstract—We used observational data and numerical simulation technology for evaluating the rate at which that key polluters contribute to air pollutants in the Huancui district of the city of Weihai, China. We evaluated air quality monitoring data, meteorological data, high-altitude sounding data and the emissions intensity of key polluters as provided by the Shandong Provincial Department of Environmental Protection. We adopted the Aermod System, an atmospheric environmental impact assessment system, to simulate pollutant concentrations released from key polluters at each monitoring point in Weihai. Then, we compared the results with values from each monitoring point established by the Department of Environmental Protection of Shandong Province. The results showed the rates that key polluters contribute to air pollutants in the city of Weihai. The analysis concluded that contribution rates of sulphur dioxide and nitrogen oxides from key polluters in the Huancui district of Weihai were higher in the Huaxia Technical School zone at 32.72% and 81.39%, respectively, while they were lower for the remaining five monitoring sites. This study provides data support for the relevant government departments alongside a simple and convinient method to use for related research by using existing official monitoring statistics.
Index Terms—Contribution rate, nitrogen oxides, sulphur dioxide, numerical simulation.
I. INTRODUCTION
Most of the world's cities suffer severe air quality problems, which have received increasing attention. According to the World Health Organization, worldwide urban air pollution causes 800,000 deaths and years of life lost of approximately 4.6 million each year [1]. In China, with the sustained and rapid growth of economy, the expansion of urban population and the development of industry, China’s cities are experiencing serious air pollution
Manuscript received September 20, 2016; revised November 14, 2016. This work was supported in part by the Shandong Provincial Natural Science Foundation, China (ZR2014BQ033), the Guangzhou Key Laboratory of Environmental Exposure and Health (No. GZKLEEH201613) and a China Postdoctoral Science Foundation funded project (2013M540297). The Natural Scientific Research Innovation Foundation in Harbin Institute of Technology (HIT.NSRIF.2014126) is also acknowledged.
Zhenxing Chi is with School of Marine Science and Technology, Harbin Institute of Technology, Weihai, China, he is also with State Key Laboratory of Urban Water Resource and Environment, Harbin Institute of Technology, Harbin, China and Guangzhou Key Laboratory of Environmental Exposure and Health, School of Environment, Jinan University, Guangzhou, China (e-mail: [email protected]).
Jia Guan, Lin Zhong, Xunuo Zhang, and Ye Shan are with School of Marine Science and Technology, Harbin Institute of Technology, Weihai, China.
in recent years [2]. Environmental pollution in China has become a problem that cannot be ignored [3]. To resolve the problem, understanding the rate that all kinds of pollution sources contribute to air pollutant concentrations is necessary [4]. This understanding is the basis for developing air pollution reduction programs.
The AMS/EPA Regulatory Model Improvement Committee (AERMIC) developed an atmospheric environmental impact assessment system, named AERMOD. The system is based on the statistical theory of diffusion, assuming that the distribution of pollutant concentrations, to a certain extent, follows Gaussian distribution theory. The system allows for a mode system that can be used for various emission sources (including point source, line source, non-point source and body source) [5]. It can also be used to simulate and predict the emission and diffusion situation anywhere in a rural or urban environment, flat or complex terrain, ground or elevated source [5]. It can be used to calculate dry and wet deposition and other scavenging processes [6]. Inputting values for parameters with the AERMOD model system is easy and clear. In accordance with the needs of users, outputting files having multiple formats and requirements at the same time is possible. Not only can it sort the pollutant concentrations, but it can make three types of contour maps, including the annual average, the daily average and the hourly value, using the predicted results. Langner and Klemm’s experiments have shown that the predictions of the model are closer to field observations [7]. In cases with complex and urban terrain, AERMOD is the stronger model compared with AUSTAL2000. However, AERMOD does not take into account chemical reactions [8]. So, when used in model domains within 50 km × 50 km (e.g., small and medium sized cities), the predicted results with the model can have a high precision and accuracy [8].
We used Weihai, a city in the Shandong Province, as an example. We chose the levels of sulphur dioxide (SO2) and
nitrogen oxides (NOX), two important air quality indexes, as
research objects using the Aermod System, with AERMOD as the core model, as the atmospheric environmental impact assessment system. Combining the data regarding the emission of pollutants of key polluters and ambient air quality, which is published on the website of the Shandong Provincial Department of Environmental Protection, we researched the contribution rates of SO2 and NOX discharged
from key polluters in Weihai and compared them to corresponding pollutant concentrations in discrete points. From this study, it can be roughly understood the extent that key polluters in Huancui district of Weihai influence air quality and can provide a basis for the government to plan air
Using Numerical Simulation Technology to Assess the
Contribution of Key Polluters to Air Pollution in the
Huancui District, Weihai, China
pollution reduction programs and to develop other relevant policies.
II. METHODS
A. AERMET Meteorology Pre-treatment
For this experiment, the ground meteorological data was forecasted by inputting two months (March and April 2014) of meteorological material provided by the weather station of Weihai, including wind speed, wind direction, total cloud cover, low cloud cover and dry bulb temperature. High-altitude sounding data was downloaded online by the software.
Near-ground parameters (surface albedo at noon, daytime Bowen ratio and ground roughness length), used in the AERMOD system, according to the differences among the four seasons of the year, could be selected by referring to the user manual. The roughness data came from relevant experimental observation data. The corresponding parameters are shown in Table I.
TABLEI:AERMODNEAR-GROUND PARAMETERS
B. AERMAP Terrain Pre-treatment
We imported the Google map of the Huancui district of the city of Weihai. We outputted the geographic elevation files and read a total of 577 grid points at the interval of 1500 m × 1500 m. The terrain data was imported automatically. We set the latitude and longitude coordinates (122°7′7.57″E, 37°25′12.98″N) as the coordinate of the reference grid point (0, 0). After implementing the AERMAP process, we obtained the actual geographical elevation, the effective height of each point on the grid and each of the discrete points (interest points and monitoring points) and the actual elevation data of various pollution sources.
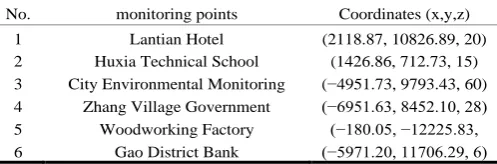
TABLEII:COORDINATES OF DISCRETE MONITORING POINTS (M) No. monitoring points Coordinates (x,y,z)
1 Lantian Hotel (2118.87, 10826.89, 20) 2 Huxia Technical School (1426.86, 712.73, 15) 3 City Environmental Monitoring
Station
(−4951.73, 9793.43, 60) 4 Zhang Village Government
Building
(−6951.63, 8452.10, 28) 5 Woodworking Factory (−180.05, −12225.83,
76)
6 Gao District Bank (−5971.20, 11706.29, 6)
There are six air quality monitoring sites in Weihai: the Lantian Hotel, the Huaxia Technical School, the City Environmental Monitoring Station, the Zhang village government building, a woodworking factory and the Gao District Bank. The coordinates and location map of the six discrete points are shown in Table II and Fig. 1.
C. AERMOD Inputting Pollution Sources
For the values of the parameters for pollutant sources, we used the emissions intensity of enterprises, which we
obtained from the website of the Shandong Provincial Department of Environmental Protection. Emission rates of pollutants were calculated by using the average concentration values of SO2 and NOX released from each business during
March and April 2014. The basic situation for each source of pollution is shown in Table III.
3 km
Fig. 1. location map of discrete points.
D. Checking and Analyzing Results
The Aermod System inputs the predicted concentrations of SO2 and NOX at the six discrete points affected by the key
polluters, including a 1h average concentration and a 24h average concentration. Using the real-time monitoring data of SO2 and NOX at the six discrete points, obtained from
Shandong Provincial Department of Environmental Protection, the rate of the contribution to SO2 pollution of key
polluters in Weihai and the concentration of NOx at discrete points were calculated from two aspects of the 1h average concentration and the 24h average concentration. Then, we determined which enterprises contributed to air pollution at the highest rate.
III. RESULTS AND DISCUSSION
A. Analysis of the Rates of Contribution to SO2 of Key
Polluters
The city’s SO2 pollution is part of the overall regional
environmental problem. It is mainly caused by the residents’ lifestyle, heating and industrial production processes [9], 10]. SO2 is a pollution mainly resulting from burning coal [11],
having harmful effects on the human body. The toxicity of SO2 in the air mainly is manifested as acute and chronic
poisoning caused by contact [12]. When concentrations of SO2 and soot in the atmosphere are larger, the incidence of
respiratory diseases can increase, and the condition of patients with chronic diseases can worsen [13]. After the SO2
in atmosphere is oxidized to sulphuric acid mist, it can enter directly into the alveoli with the fly ash [14]. Additionally, the SO2 emitted into the atmosphere will eventually be
oxidized to form acid rain. The leading position of coal in China’s energy production and consumption structure will not change for a long time [15], so SO2 will be an important
index indicating the long-term effects on China’s air quality. Albedo Bowen ratio Roughness length
Winter 0.35 1.5 0.38
Spring 0.14 1.0 0.38
Summer 0.16 2.0 0.38
Fall 0.18 2.0 0.38
TABLEIII:EMISSION SITUATION OF MAJOR INDUSTRIAL POLLUTION SOURCES IN HUANCUI DISTRICT OF WEIHAI CITY
No. Names
Coordinates of the basement of the exhaust
pipes Emission rates (g/s)
Xs[m] Ys[m] Zs[m] SO2 NOX
1 Xinli Thermal Power Plant 2306.17 2834.24 16.99 1.26921056 7.78226472
2 Botong Thermal Power Plant 3687.66 −2744.94 19.71 6.877255 22.2692067
3 Xijiao Thermal Power Plant −5036.42 9505.76 14.74 1.90187611 2.27297389
4 Weihai Thermal Power Plant 1112.33 7944.77 5.29 8.85354806 39.7489086
5 Blue Star Glass 53.33 −11283.18 68.81 2.51821139 20.4020783
6 Huaneng Weihai Power Plant 7625.57 2009.74 29.82 64.247035 239.065896
TABLEIV:1 H AND 24 H AVERAGE CONCENTRATION OF SO2 IN EACH DISCRETE POINT
No. Discrete points
Average time (1 h) Average time (24 h)
Predicted values [mg/m3]
Standard values [mg/m3]
The ratio of the predicted concentration
to standard concentration [%]
Predicted values [mg/m3]
Standard values [mg/m3]
The ratio of the predicted concentration
to standard concentration [%]
1 Lantian Hotel 0.00096 0.5 0.19168 0.00005 0.15 0.03549
2 Huaxia Technical School 0.00427 0.5 0.85342 0.00024 0.15 0.15804
3 City Environmental
Monitoring Station 0.00069 0.5 0.13866 0.00004 0.15 0.02568
4 Zhang Village
Government 0.00046 0.5 0.09167 0.00003 0.15 0.01698
5 Woodworking Factory 0.00089 0.5 0.17749 0.00005 0.15 0.03287
6 Gao District Bank 0.00074 0.5 0.14759 0.00004 0.15 0.02733
TABLEV:THE CONTRIBUTION RATE OF KEY POLLUTERS IN WEIHAI TO THE CONCENTRATIONS OF SO2 IN EACH DISCRETE POINT (1H AND 24H AVERAGE
CONCENTRATION)
No. Discrete points
Average time (1 h) Average time (24 h) Predicted
values [mg/m3]
Monitoring values [mg/m3]
Contribution rate (%)
Predicted values [mg/m3]
Monitoring values [mg/m3]
Contribution rate (%)
1 Lantian Hotel 0.00096 0.01655 5.80 0.00005 0.0165 0.30
2 Huaxia Technical School 0.00427 0.01305 32.72 0.00024 0.01395 1.72
3 City Environmental
Monitoring Station 0.00069 0.01645 4.19 0.00004 0.015 0.27
4 Zhang Village
Government 0.00046 0.01155 3.98 0.00003 0.0125 0.24
5 Woodworking Factory 0.00089 0.02635 3.38 0.00005 0.0282 0.18 6 Gao District Bank 0.00074 0.01945 3.80 0.00004 0.019 0.21
Fig. 2 shows the Aermod System’s predictions of the SO2
pollution levels of the Huancui district of the city of Weihai caused by key polluters. The predicted concentrations of SO2
at six discrete points are shown in Table IV. It can be seen that the concentrations of SO2 caused by the key polluters
were far below the standard values.
mg/m3
Fig. 2. The effect of SO2 emitted from key polluters in Weihai.
The real-time monitoring data of SO2 at the six discrete
points was obtained from the Shandong Provincial Department of Environmental Protection. We evaluated the rate that key polluters in Weihai contributed to the concentrations of SO2 at the six discrete points from two
aspects: a 1h average concentration and a 24h average concentration. Table V shows the results.
As seen in Table V, when the 1-h average concentration of SO2 is the largest, the contribution rates of key polluters in
Weihai, ordered from highest to lowest, is as follows: 32.72% at the Huaxia Technical School, 5.80% at the Lantian Hotel, 4.19% at the City Environmental Monitoring Station, 3.98% at the Zhang village government building, 3.80% at the Gao District Bank and 3.38% at the woodworking factory. The rate at which the key polluters contributed to SO2
concentration at the Huaxia Technical School was higher, while the rates at the remaining five monitoring points were lower. The reason might be that the key enterprise, Huaneng Weihai, has a large amount and a high concentration of emissions; also, the Huaxia Technical School is the nearest of all the discrete point to Huaneng Weihai.
Table V, the rates that key polluters contribute to the pollution at the Lantian Hotel, the Huaxia Technical School, the City Environmental Monitoring Station, the Zhang village government building, the woodworking factory and the Gao District Bank were respectively 0.30%, 1.72%, 0.27%, 0.24%, 0.18% and 0.21%. The rate that the key polluters in Weihai contribute to the SO2 concentration of the
Huaxia technical school zone is still higher than the contribution rates at the other five monitoring points.
B. Analysis of the Rates of Contribution to NOX of Key
Polluters
NOX comprises NO, NO2, N2O5, N2O3, NO3, N2O4 and
similar compounds. The atmospheric pollutants are mainly NO and NO2 [16]. The percentage of NOX from fuel
combustion is the largest, accounting for more than 30%, 70% of which comes from the direct combustion of coal. Stationary sources are the main source of NOX emissions,
and the rest is mainly from motor vehicles [17]. The affinity of NO to haemoglobin is very strong. Inhalation of high concentration of NO2 could lead to acute bronchospasm,
late-onset pulmonary edema and late bronchiolitis obliterans [18]. Besides, NOX can result in the formation of
photochemical smog. High temperature
combustion-generated NO can form acid rain. N2O can be
converted to NO, destroying the ozone layer [19]. NOX is an
important root of a series of atmospheric environmental issues in China [20]. The percentage of NOx in the air is an
important indicator when monitoring ambient air quality [21].
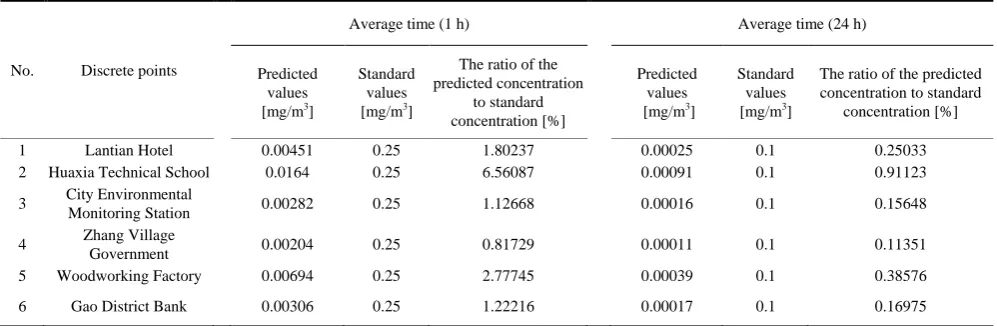
Fig. 3 shows the Aermod System’s predicted result of NOX
pollution of the Huancui district of Weihai caused by key polluters. The predicted concentrations of NOX at six discrete
points are shown in Table VI. The concentrations of NOX
caused by the key polluters were far below the standard values (Table VI).
mg/m3
Fig. 3. The effect of NOX emitted from key polluters in Weihai.
The real-time monitoring data of NOX at the six discrete
points were obtained from the Shandong Provincial Department of Environmental Protection. We evaluated the contribution rate of key polluters in Weihai to the concentrations of NOX at the six discrete points from two
aspects: a 1h average concentration and a 24h average concentration. Table VII shows the results.
TABLEVI:1-H AND 24-H AVERAGE CONCENTRATION OF NOX IN EACH DISCRETE POINT
No. Discrete points
Average time (1 h) Average time (24 h)
Predicted values [mg/m3]
Standard values [mg/m3]
The ratio of the predicted concentration
to standard concentration [%]
Predicted values [mg/m3]
Standard values [mg/m3]
The ratio of the predicted concentration to standard
concentration [%]
1 Lantian Hotel 0.00451 0.25 1.80237 0.00025 0.1 0.25033
2 Huaxia Technical School 0.0164 0.25 6.56087 0.00091 0.1 0.91123
3 City Environmental
Monitoring Station 0.00282 0.25 1.12668 0.00016 0.1 0.15648
4 Zhang Village
Government 0.00204 0.25 0.81729 0.00011 0.1 0.11351
5 Woodworking Factory 0.00694 0.25 2.77745 0.00039 0.1 0.38576
6 Gao District Bank 0.00306 0.25 1.22216 0.00017 0.1 0.16975
TABLEVII:THE CONTRIBUTION RATE OF KEY POLLUTERS IN WEIHAI TO THE CONCENTRATIONS OF NOX IN EACH DISCRETE POINT (1H AND 24H AVERAGE
CONCENTRATION)
No. Discrete points
Average time (1 h) Average time (24 h)
Predicted values [mg/m3]
Monitoring values [mg/m3]
Contribution rate (%)
Predicted values [mg/m3]
Monitoring values [mg/m3]
Contribution rate (%)
1 Lantian Hotel 0.00451 0.0282 15.99 0.00025 0.02275 1.10 2 Huaxia Technical School 0.0164 0.02015 81.39 0.00091 0.0137 6.64
3 City Environmental
Monitoring Station 0.00282 0.04045 6.97 0.00016 0.02615 0.61
4 Zhang Village
Government 0.00204 0.018 11.33 0.00011 0.0165 0.67
5 Woodworking Factory 0.00694 0.01955 35.50 0.00039 0.0191 2.04 6 Gao District Bank 0.00306 0.01545 19.81 0.00017 0.01535 0.11
As shown in Table VII, when the 1-h average concentration of NOX is the largest, the contribution rates of
key polluters in Weihai, ordered from the highest to lowest, is as follows: 81.39% at the Huaxia Technical School, 35.50% at the woodworking factory, 19.81% at the Gao District Bank, 15.99% at the Lantian Hotel, 11.33% at the Zhang village government building and 6.97% at the City Environmental Monitoring Station. The rate at which the key polluters in Weihai contributed to the NOX concentration at Huaxia
Technical School zone was higher, while the rates at the remaining five monitoring points were lower. The reason might be that the key enterprise, Huaneng Weihai, has a large amount and a high concentration of emissions; also, the Huaxia Technical School is the nearest of all the discrete points to Huaneng Weihai.
When referring to 24h average concentrations, as shown in Table VII, the rates that key polluters contribute to the pollution at the Lantian Hotel, the Huaxia Technical school, the City Environmental Monitoring Station, the Zhang village government building, the woodworking factory and the Gao District Bank were respectively 1.10%, 6.64%, 0.61%, 0.67%, 2.04% and 0.11%. The rate that key polluters in Weihai contribute to NOX concentration at the Huaxia
technical school zone is still higher than the contribution rates at the other five monitoring points.
In terms of the contribution rate of key polluters in Weihai to pollutants concentrations at each monitoring point, NOX is
significantly higher than SO2. This might be because the
proportion of nitrogen oxide emissions in total emissions of the key polluters in Weihai city is much higher than their emissions of sulphur dioxide. In addition, we find that, when comparing the one-hour average concentrations with the conditions during the 24-hour average concentrations, the contribution rate is more stable and reliable.
IV. CONCLUSION
In this research, by using the atmospheric environmental impact assessment system Aermod System, with air-quality monitoring data, meteorological data, high-altitude sounding data and the emissions intensity of key polluters, we investigated on the contribution rates of key polluters to air pollution in the city of Weihai, China. The results show that the rates that key polluters in Weihai contribute to SO2 and
NOX concentrations at the Huaxia Technical School zone are
higher, respectively, 32.72% and 81.39%, than the rates found at other monitoring sites. The rate of contribution was as follows: Contributions to SO2 levels were 5.80% at the
Lantian Hotel, 4.19% at the City Environmental Monitoring Station, 3.98% at the Zhang village government building, 3.80% at the Gao District Bank and 3.38% at the woodworking factory. Contributions to NOX were 35.50% at
the woodworking factory, 19.81% at the Gao District Bank, 15.99 % at the Lantian Hotel, 11.33% at the Zhang village government building and 6.97% at the Environmental Monitoring Station of the City.
This study provides reference and support to the relevant government departments when planning air pollution reduction programs and developing other environmental protection policies. The simulation method used in this study
could also provide helpful ideas for determining contribution rates of pollutants in other regions by using existing official monitoring statistics.
REFERENCES
[1] World Health Organization, “The world health report 2002: Reducing risks, promoting healthy life,” Geneva Switzerland, 2002.
[2] K. He, H. Huo, and Q. Zhang, “Urban air pollution in China: Current status, characteristics, and progress,” Annual Review of Energy and the
Environment, vol. 27, pp. 397-431, 2002.
[3] G. Han, W. Gong, J. H. Quan, J. Li, and M. Zhang, “Air pollution and its control in China,” Frontiers of Environmental Science &
Engineering in China, vol. 1, pp. 129-142, 2007.
[4] B. Zhao, J. Xu, and J. Hao, “Impact of energy structure adjustment on air quality: A case study in Beijing, China,” Frontiers of
Environmental Science & Engineering in China, vol. 5, pp. 378-390,
2011.
[5] A. J. Cimorelli, S. G. Perry, A. Venkatram, J. C. Weil, R. J. Paine, R. B. Wilson, R. F. Lee, W. D. Peters, and R. W. Brode, “AERMOD: A dispersion model for industrial source applications. part I: General model formulation and boundary layer characterization,” Journal of
Applied Meteorology, vol. 44, pp. 682-693, 2005.
[6] S. G. Perry, A. J. Cimorelli, R. J. Paine, R. W. Brode, J. C. Weil, A. Venkatram, R. B. Wilson, R. F. Lee, and W. D. Peters, “AERMOD: A dispersion model for industrial source applications. Part II: Model performance against 17 field study databases,” Journal of Applied
Meteorology, vol. 44, pp. 694-708, 2005.
[7] C. Langner and O. Klemm, “A comparison of model performance between AERMOD and AUSTAL2000,” Journal of the Air & Waste
Management Association, vol. 61, pp. 640-646, 2011.
[8] M. D. Gibson, S. Kundu, and M. Satish, “Dispersion model evaluation of PM2.5, NOx and SO2 from point and major line sources in Nova
Scotia, Canada using AERMOD Gaussian plume air dispersion model,” Atmospheric Pollution Research, vol. 4, pp. 157-167, 2013. [9] T. Bellander, N. Berglind, P. Gustavsson, T. Jonson, F. Nyberg, G.
Pershagen, and L. Järup, “Using geographic information systems to assess individual historical exposure to air pollution from traffic and house heating in Stockholm,” Environmental Health Perspectives, vol. 109, pp. 633-639, 2001.
[10] R. S. Bhopal, S. Moffatt, T. Pless-Mulloli, P. R. Phillimore, C. Foy, C. E. Dunn, and J. A. Tate, “Does living near a constellation of petrochemical, steel, and other industries impair health?” Occupational
and Environmental Medicine, vol. 55, pp. 812-822, 1998.
[11] S. Pongpiachan, K. Thumanu, P. W. Na, P. Hirunyatrakul, I. Kittikoon, K. F. Ho, and J. Cao, “Diurnal variation and spatial distribution effects on sulfur speciation in aerosol samples as assessed by X-ray absorption near-edge structure (XANES),” Journal of Analytical Methods in
Chemistry, vol. 2012, pp. 486-490, 2012.
[12] Y. Liu, W. Cen, Z. Wu, X. Weng, and H. Wang, “SO2 poisoning
structures and the effects on pure and Mn doped CeO2: A first
principles investigation,” The Journal of Physical Chemistry C, vol. pp. 116, 22930-22937, 2012.
[13] C. Peng, X. Wu, G. Liu, T. Johnson, J. Shah, and S. Guttikunda, “Urban air quality and health in China,” Urban Studies, vol. 39, pp. 2283-2299, 2002.
[14] A. Podgórski, T. R. Sosnowski, and L. Gradoń, “Deactivation of the pulmonary surfactant dynamics by toxic aerosols and gases,” Journal
of Aerosol Medicine, vol. 14, pp. 455-466, 2001.
[15] B. B. Li, Q. M. Liang, and J. C. Wang, “A comparative study on prediction methods for China's medium- and long-term coal demand,”
Energy, vol. 93, pp. 1671-1683, 2015.
[16] F. Normann, K. Andersson, B. Leckner, and F. Johnsson, “Emission control of nitrogen oxides in the oxy-fuel process,” Progress in Energy
and Combustion Science, vol. 35, pp. 385-397, 2009.
[17] B. C. Mcdonald, T. R. Dallmann, E. W. Martin, and R. A. Harley, “Long-term trends in nitrogen oxide emissions from motor vehicles at National, State, and air basin scales,” Journal of Geophysical Research, vol. 117, pp. 119-130, 2011.
[18] T. L. Guidotti, “The higher oxides of nitrogen: inhalation toxicology,”
Environmental Research, vol. 15, pp. 443-472, 1978.
[19] B. C. McDonald, T. R. Dallmann, E. W. Martin, and R. A. Harley, “Nitrous oxide (N2O): The dominant ozone-depleting substance
emitted in the 21st century,” Science, vol. 326, pp. 123-125, 2009. [20] Y. Jin, M. C. Veiga, and C. Kennes, “Bioprocesses for the removal of
nitrogen oxides from polluted air,” Journal of Chemical Technology
International Journal of Environmental Science and Development, Vol. 8, No. 4, April 2017
[21] G. Han, W. Gong, J. H. Quan, J. Li, and M. Zhang, “Spatial and temporal distributions of contaminants emitted because of Chinese New Year's eve celebrations in Wuhan,” Environmental Science: Processes & Impacts, vol. 16, pp. 916-923, 2014.
Zhenxing Chi graduated from the School of
Environmental Science and Engineering of Shandong University, 2012. He worked as a lecturer at the Department of Environmental Engineering, School of Marine Science and Technology, Harbin Institute of Technology, Weihai. His research interests are in environmental pollution and health.
Jia Guan was born in November 1992. She got the
master of marine science in 2016 from Harbin Institute of Technology; and the bachelor of environmental engineering in 2014 from Harbin Institute of Technology, Weihai. She worked as an assistant engineer at Harbin Drainage Refco Group Ltd.
Lin Zhong was born in August 1995. She is pursuing a
bachelor’s degree in environmental engineering at Harbin Institute of Technology, Weihai.
Xunuo Zhang was born in April 1993. She got the
bachelor of environmental engineering in 2016 from Harbin Institute of Technology, Weihai. She is pursuing a master’s degree in environmental science and engineering at Harbin Institute of Technology.