Implementing Energy Saving Techniques for Sensor
Nodes in IoT Applications
Huan Minh Vo
Ho Chi Minh University of Technology and Education, Vietnam
Abstract
The technique is designed to optimize the energy consumption for sensor processing layer in Internet Of Things (IoT). Sleep time calculation algorithm is built on the gateway to predict the sleep time of sensor nodes according to information quality, information history, and remaining battery capacity. The power reduction techniques are designed to turn offthe functions of node sensors in sleep mode. Sensor Node consumes 2.84% of battery power compared to 12.52% of reading data in a given cycle in 2 hours. Transmission results are 100% successful rate with distances less than 500m. The sensor node consumes 4.47mAh to 28.8mA, corresponding to one AA battery that can sustain the node from 15.6 hours to 11 days. The study also calculates the solar cell solution provided for sensor nodes.
Receivedon19 June 2018;acceptedon27 November 2018;publishedon19 December 2018 Keywords: Wirelesssensornetwork,IoT,datacollection,lowpower,sleepmode.
Copyright ©2018 Huan MinhVo, licensedtoEAI. Thisisan open access articledistributedunderthe terms ofthe Creative Commons Attributionlicense (http://creativecommons.org/licenses/by/3.0/), which permits unlimited use,distributionandreproductioninanymediumsolongastheoriginalworkisproperlycited.
doi:10.4108/eai.19-12-2018.156076
1. Introduction
Emerging issues such as big data, Distributed Denial of Service attack (DDoS), information processing, low energy, etc., have emerged as issues that need to be addressed in the development of Internet of Things (IoT). In particular, addressing energy savings is considered to be the most important element of the realization of the IoT idea [1–3]. Some the techniques that reduce power consumption for sensor nodes in IoT systems include filtering data to send less packets [4] [4], compressing information using high compression algorithms or combining compression with a low-power hardware design [5], or using the system’s operation characteristics to scheduling the tasks which the microcontroller unit (MCU) behaves according to requirements of speed and energy consumption [6]. Hardware algorithms put the circuit into sleep state when MCUs are not working [5–8]. The previous publication solutions has met the energy efficiency criteria of the battery but the quality of the data collection is not optimal because there is trade-off in the cost of sending information that may be lost and amount of power saving. It means that the penalty of saving power is loss of information quality.
Due to the above factors, this paper presents combi-nation architecture between sleep time calculation and
low power techniques for Node Sensors. Recently, an algorithm was published to predict the sleep interval for sensors [9]. However, if the energy increases or decreases, the sleep interval should vary according the sensor’s energy status. In this research, advanced sleep time calculation algorithm on gateway that allows the system to predict and control the sleep time based on an environmental monitoring data collection in terms of battery status, information history and collected information quality is also investigated. Moreover, the study proposes power reduction techniques to disable the unnecessary functions of the MCU in order to save more efficiency energy at the sensor nodes.
Not only ensuring the quality of collected informa-tion is the most accurate but also ensuring the Node Sensor to operate for the longest time is very necessary for environmental monitoring systems. It is because of the topography and the harshness of the sensing environment. Our system consists of two main parts. The first part consists of a data collector called a Node Sensor which operates using battery power. The Node Sensor is responsible for collecting data from the envi-ronment such as the temperature. Temperature values are measured from the DS18B20 sensor, and their infor-mation is shown on the Organic Light-Emitting Diode (OLED) display so that users can visually observe the
Research Article
EAI Endorsed Transactions
on Industrial Networks and Intelligent Systems
environmental temperature and power consumption of the Node Sensor at the installation site. Node Sensor will then send the information to the central controller via Lora wireless transmission technology. The second part is the central controller, called the gateway which receives the data and then calculates the Node Sensor sleep time while ensuring the quality of the collected information is the most reliable. After that MCU moves to sleep mode to save battery power.
In this system, the author uses an Intel Edison board and a breakout board to perform the task of gateway [10]. Node Sensor uses the Arduino Pro mini board [11], which communicates data transmission using the Lora SX1278 433Mhz module [12] because of the low power loss characteristic during transmission as well as sleep mode when not transmitting. Packet size is also emphasized by minimizing packets for the most secured information. The Node Sensor is designed by low power techniques by selecting the appropriate supply source, optimizing the hardware, and disabling unnecessary functions.
The paper objective is to develop a model of environmental management monitoring system with self-monitored algorithm to ensure the longest life time of the system as well as the best quality of information. When information is sent from the Node Sensor, the Gateway controller processes and computes the received data and returns that Node Sensor to the next sleep cycle time. Then, gateway transmits the received data up on the Web server for online monitoring.
2. DESIGN OF ENERGY SAVING
ARCHITECTURE
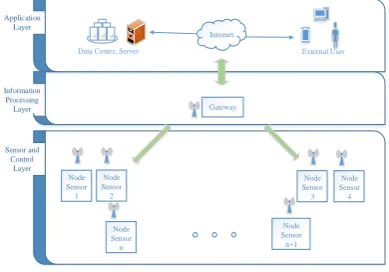
The proposed architecture exploits the fact that sensor nodes consume little power in sleep mode. With this architecture, the sensor nodes will switch to sleep mode over time calculated by the information processing layer as shown in fig. 1. The Sensing and Control Layer
Sensor and Control
Layer Information
Processing Layer Application
Layer
Internet
Node Sensor 2
Node Sensor 3 External User Data Center, Server
Gateway
Node Sensor 1
Node Sensor 4
Node Sensor n+1 Node
Sensor n
.
Figure 1. IoT system architecture.
consists of hardware elements in the IoT system. It collects raw data in large volumes and sends them to the data analyzer. The main component of this layer is Sensor Node (SN).
The Sensor Node is responsible for collecting data, and sends it to the Gateway Node (GN). Based on the frequency of data acquisition and transmission, SNs collect and transmit data over time. The Gateway Node calculates result when a query is made. SNs have the limited energy supply. A SN is considered to be active if it has a high energy level and is collecting information to the GN. This energy-saving architecture allows the SN to enter sleep mode by turning offthe transceivers after the data transmission ends and continues to sleep until the time that GN has sent information to it. SNs can even be turned off without having to collect environmental information for long time periods, so sensors will efficiently use their battery power by automatically switching between active modes and sleep mode.
Gateway Node is the main contributor to calculating sleep time for SN to save energy. It not only provides storage media for sensor data but also acts as a controller unit for the SN connected to it. It calculates the sleep time of each SN according to step by step by following formula:
tni =Tni−1+∆ti (1)
Where,tni is next sleep cycle. Tni−1 is previous sleep
time.∆ti is calculated difference time.
In formula (1),Tni−1is the previous sleep time, while
thetinis next sleep cycle. The initial sleep time value,T0 depends on the associated application and is constant for each application. The value of∆ti can be either 0, positive or negative and also depends on the current temperature value as well as the current battery’s energy. In cyclic sensing, the ∆ti depends on various factors and is represented by the following formula:
∆ti = αδi
EiV aSignedE
(2)
Va is the variance of information computed by formula (3).
Ei is the remaining battery capacity of the Node Sensor.
SignedE is the sign factor.
δi is the quality of the received information.
alpha is the coefficient of selection for each type of data.
of extracted information and energy consumption. To maintain this balance, sensor nodes contact to the data analyzer to extract quality information. The information quality (δi) here is divided into 100 levels from 1 to 100. Lower level means that information quality is low. So, sleep interval should be shorter for sensor node to sense more data. Higher level means that sleep internal should be longer for sensor to save power loss. Gateway receives data from Sensor Nodes to estimate the information quality. Battery level (Ei) corresponds to the remaining battery level ofSNi. The battery life can vary from very low (less than 20%) to very high (greater than 80%). When the battery level is high, the sleep interval should be shortened. On the other hand, with reduced battery life, sleep time can gradually increase for energy efficiency. The Va parameter is monitored by the Gateway Node for the difference between the current value and the previously known values. If the current value does not show significant change, then the sleep duration can be extended to better use energy. On the other hand, if the value of the difference is large, the sleeping time is reduced to monitor the environment more effectively.
V a=
pP
(xi−µ)2
µ (3)
Where,xi is the sensed value, is mean of the sensed value.
The selection coefficient (α) is chosen for each application and for different types of sensors. With the temperature monitoring model, the sampling cycle does not need to be too fast, so we can choose larger coefficient to increase the sampling cycle. In a nutshell, the energy-saving architecture demonstrates the efficiency in energy saving while SCL ensure the information quality of the collection. Battery saving level extends the sensor life of the IoT system.
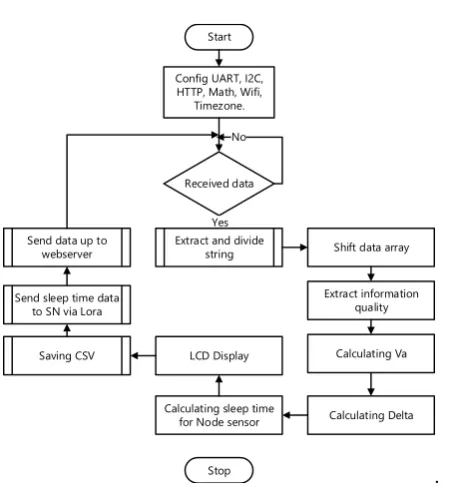
Intel Edison, when powered up, will automatically launch the program files that are added to boot system and will proceed as a separate operating system process. When the program launches, it will first set up and configure the General-purpose Input/Output (GPIO), Serial port as well as support packages as shown in figure 2. The board will then wait for the data to be received. When data is received, the data is put into the buffer to separate fields of the temperature, remaining battery, delta sign in the received data. Once the data has been separated, the necessary parameters such as information quality and Va will be calculated, and then deduct the Delta and next sleep time for Node Sensor. Data continues to display on Liquid Crystal Display (LCD) and save backups in memory. Then the next sleeping information is sent back to Node Sensor through the LoRa network and finally sent to the webserver. After the end of the cycle, Intel Edison board will wait to the next data cycle from the Node Sensor.
Start
Received data
Shift data array
Extract information quality
Stop No
Yes Config UART, I2C, HTTP, Math, Wifi,
Timezone.
Calculating Va
Calculating Delta Calculating sleep time
for Node sensor Saving CSV
Send data up to
webserver Extract and divide string
LCD Display Send sleep time data
to SN via Lora
.
Figure 2. Flow chart to process data at Gateway.
The Gateway receives data from Node Sensor in packet designed in format of n1a22b33c1#. Here, character 1 presents the Node Sensor identifier. The character 22 here presents the temperature in the real type format, the character 33 presents the amount of Node Sensor’s remaining battery and character 1 presents the sign of delta t which is used for next calculation of Node. Explaining more clearly when Gateway receives the ’n’ character, it will understand that the first Node Sensor sends the packet. The parameter that is located after the letter a and before the letter b is the temperature value, and then the battery time as well as the sign of the delta parameter. When it receives the ’#’ character, it understands that the packet ends and begins to stop receiving data to process the packet separately.
.
Figure 3. Relation between supply current and supply voltage of ATMEGA328 [12].
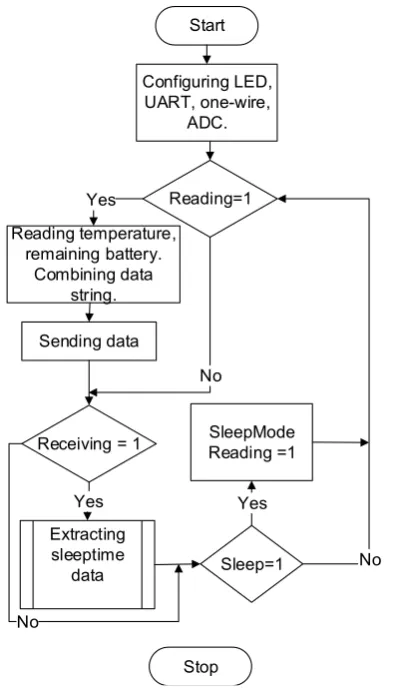
MCU is designed to check the received data to ensure that the MCU will not perform continuous operations with the peripheral such as OLED display, reading temperature sensor and the battery remaining. To better understand the algorithm, when Node Sensor is powered up, Arduino Promini will configure the peripheral, communication module. It will then read the parameters like remaining battery, temperature, then send the data to the gateway and switch to receiving mode. After receiving the sleep time data that Gateway calculated to switching to sleep mode, Sensor Node switches to active mode to reading parameters, then a new process cycle is continued. The process is shown in Figure 4 below.
In next, when the Node receives the time data from the Gateway in the format of "axxx!", The Node will check whether the first character received is ’a’. If it is ’a’, the Node understands that it is starting the process of receiving time data, then putting ’a’ in the temporary variable and starting to get sleep time data and putting it in the array [i ++]. The end of the frame is the character ’!’ The Sensor Node will test whether the first character of the string is ’a’ and the end of the string is character ’!’. If this is the right case, the Node will finish the process of getting the time data and converting the array [i++] to the integer value using the atol function and putting the sleep mode to 1. Then the Node switches to sleep mode with above calculated time.
The Intel Edison board with mini breakout is designed specifically for IoT system at gateway. The low energy consumption is the advantage of Intel Edition compared to some embedded computers such as Raspberry pi, Intel Galileo. ‘Intel Edison Modules consume less power but offer high performance with dual-core processors, 500MHz, 1GB RAM and up to 4GB of Flash memory. Also, Javascript Node programming language is used to design due to be the most popular programming language. It is developed for multiple platforms, specially, IoTs.
The ATMEGA328P MCU is supplied at 3.3 V as shown in Figure 3 at sensor nodes. Thus, the ASM1117
Start
Reading=1
Reading temperature, remaining battery.
Combining data string.
Stop Yes
Configuring LED, UART, one-wire,
ADC.
Receiving = 1
Sleep=1 SleepMode Reading =1
Yes
No
Yes
No No
Extracting sleeptime
data Sending data
.
Figure 4. Flow chart to process data at Sensor Node.
shifts the battery voltage from 6 V to 3.3 V so that the module operates at optimum power level as shown in fig. 5. In addition, the sleep mode is fully processed by turning offredundant functions when not in use such as ADC, Pulse Width Modulation (PWM), Timer on the MCU.
.
3. Simulation results
We synchronize the data transmission with the gateway using the HTTP protocol via the Get data method, create and manage data on the SQL database. A website page is designed to show the curves of temperature, battery capacity, sleep time, and delta in online monitoring system. After completing the hardware product, experiment measurement is conducted in field to compare the performance of the battery usage at Node Sensor with/without using the algorithm. In addition, we investigate the efficiency of transmission distance and provide an expansive direction when using solar energy through consumption power calculation. The study compares the battery life time of two Node Sensors in real time and sleep time when using and not using the algorithm. The study makes the three experiments as following:
Experiment 1: At the first attempt, Node Sensor 1 will be applied by the sleep time algorithm as well as the power reduction techniques on the MCU and associated modules such as OLED display, Lora kit, DS18b20 board with the initial coefficientsα = 5, t = 3 minutes. Node Sensor 2 will not be applied by any algorithms. Node Sensor 2 is allowed to read and send data at a given interval of 3 minutes.
.
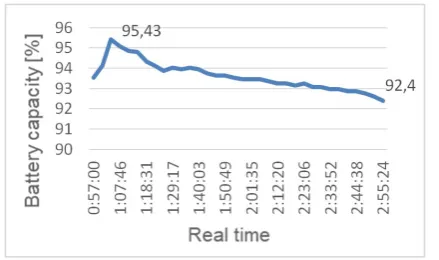
Figure 6. Real-time battery capacity at Node 1 using both sleep time algorithm and power reduction techniques.
.
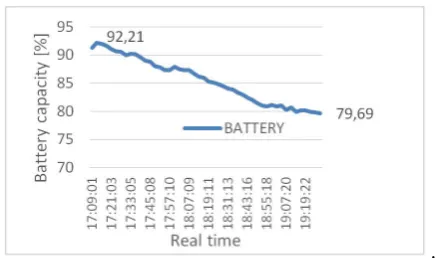
Figure 7. Real-time battery capacity at Node 2 when applying a 3-minute cycle of reading data, without applying power reduction techniques and sleep time algorithm for the sensor node. The X axis shows the short summary of real time.
Conclusion 1: Fig. 6 and fig 7 show that Node 1 is decreased to 2.84% (from 98.83% to 95.99 %) of battery capacity in the period of two hours. Node 2 is decreased to 12.52% (from 92.21% to 76.69%) when not using the sleep time algorithm and power reduction power.
According to the above design formula, consider the battery level change with sleep time, it is realized when the battery capacity is reduced, the sleep time of the Node will also increase to ensure enough power for Node Sensor operation. Fig. 8 shows the trigger times to sense data during two hours.
.
Figure 8. Battery capacity and sleep time of Node 1. X-asis defines the trigger times.
Conclusion 2: We can see that sleeping time is inversely proportional to the amount of battery life. When the battery capacity is reduced, the sleep time increases and when the battery rises, then the sleeping time will decrease. This proves that the formulation of the architecture offered here is reasonable and works well with the requirements while trying to maintain the node lifetime if the battery capacity is exhausted.
Experiment 2: At this time, the Node Sensor 2 will be applied by a sleep-time algorithm without using power reduction techniques. Here, the coefficients areα = 5 and t = 3 minutes as conducted in the first experiment.
Conclusion 3: In this experiment, we see clearly that the battery life decreases by 4.4% from 90.82% to 86.42% as shown in fig. 9. Compared to Fig. 7, the sleep time algorithm is more adaptive to the environment. Compared with Fig. 6, it was found that combination of the sleep-time algorithm and power reduction techniques consumes only 2.84% less than only applying the sleep time calculating algorithm that consumes 4.4% for battery-operated sensors.
Experiment 3: In the third experiment, Node Sensor 2 will be applied by the power minimization techniques without applying the sleep time calculation algorithm. Node 2 takes the sampling in a 3-minute cycle
.
Figure 9. Real-time battery capacity at Node 2 uses a sleep-time algorithm without power reduction techniques.
.
Figure 10. The battery energy of Node 2 only applies circuit power mitigation technique without the sleep time calculation algorithm.
loss of battery life without the sleep time algorithms is negligible (2.84% and 3.03%), but system is able to be self-adaptation to the lateral environment. Here, the sampling frequency is decided by depending on the battery condition and sensed temperature. If battery has low energy level, the sleep time should be longer for saving energy and keep sensor node longer life. In addition, if temperature does not change, the sensing data is not significant improvement. Thus, sleep time should be longer for saving energy.
To evaluate the transmission performance using reliable data transmission protocol, we conducted an experiment as following. First, we are still working on this Node Sensor circuit, but we apply only two modules that transmit data together. The data of the transmitted data is only 1 byte. When A sends to B, B receives and responds to A. It receives the first data with i as the counter variable. Then, each time we try to send the request packet 10 times, each time 1 byte. Transmission distance is from 100m to 1500m outside the actual environment with limited obstacles, good weather, away from the high voltage power line as well as placing two antennas up.
Table 1. Successful rate in distance transmission experiment. Distance (meter) Successful rate (%)
100 100%
200 100%
300 100%
500 100%
800 60%(obstacle existing )
1000 80%
1500 60%
Table 2. LiPo solar panel specifications
Size 250x250x17 (mm)
Weight 1 kg
Max. power 6 W
Max. voltage 20.7 V
Max. current 0.29 A
Table 1 can be seen that the transmission efficiency can reach to 100% successful rate with distance less than 500m. The success rate is the same as the number of data packets received over the number of transmissions. Unsuccessful transmission occurs due to distance too far, interference from the external environment and due to obstructions in the transmission and reception environment. In addition, the power consumption is investigated in both sleep and wake mode. The power consumption of the sensor node is only 28.82 mA in active mode. When sensor node and its component are put into sleep mode, the its consumption current was only 4.47 mA, which is equal to 1/7 compared to Node Sensor in normal working mode. Thus, the system is designed to consume very low energy consumption from 4.47 mAh (minimum) to 28.8 mAh (maximum). With supply power of AA batteries (about 450mAh 1200mAh), it can maintain Node Sensor at least from 15.6 hours to 11 days depending on the Node’s sleep time. If solar cells are used, the Node Sensors will be guaranteed power supply full day with the following designed solar power as Table 2.
Table 3. Charge time with AA battery (450mAh)
Solar power
Output current (mA)
Con-sumption
current (mA)
Charge current (mA)
Full charge
time (hour)
100% 290 28.8 261.2 1.722818
50% 145 28.8 116.2 3.872633
35% 101.5 28.8 72.7 6.189821
100% 290 4.47 285.53 1.576017
50% 145 4.47 140.53 3.202163
For example, when the capacity of the battery is ½ the output current which is 0.145A (145mA), except that the current consumed by the node from 4.47mA to 28.8mA, the remaining current is about 116.2mA to 140.53mA which charges into AA batteries. So the time to fully charge a battery with a capacity of 450mAh is about 3 to 6 hours as in Table 3 and Sensor Node can run continuously about 15.6 hours to 11 days as analyzed above.
4. Conclusion
The proposed algorithm builds a formula on gateway to calculate the sleep time and applies power reduction techniques for the Node Sensor that increases the lifetime of the Node Sensor. The study also applies solar panels to the system to estimate the battery life. Sensor Node consumes 2.84% of battery power compared to 12.52% of reading data in a given cycle in 2 hours. Transmission results are 100% successful rate with distances less than 500m. The sensor node consumes 4.47mAh to 28.8mA, corresponding to one AA battery that can sustain the node from 15.6 hours to 11 days.
References
[1] Tang J., Z. Zhou, J. Niu, and Q. Wang. (2014) An energy efficient hierarchical clustering index tree for facilitating time-correlated region queries in the Internet of things.J. Netw. Comput. Appl.40: 1-11.
[2] Tao F., Y. Zuo, L. D. Xu, L. Lv, and L. Zhang. (2014) Internet of things and BOM-based life cycle assessment of energy-saving and emission-reduction of products.IEEE Trans. Ind. Informat.10 ( 2): 252–1261.
[3] Liang J. , J. Chen, H. Cheng, and Y. Tseng. (2013) An energy-efficient sleep scheduling with QoS consideration
in 3GPP LTE-advanced networks for Internet of things. IEEE J. Emerging Sel. Topics Circuits Syst.3 (1): 13–22. [4] Vo Minh Huan. (2017) Online Working Condition
Monitoring System Integrated Power Saving and Security Using Zigbee Wireless Sensor Network. The 2017 International Conference On Advanced Technologies for Communications. 140-143.
[5] Chacko John Deepu, Chun-Huat Heng, and Yong Lian. (2017) A Hybrid Data Compression Scheme for Power Reduction in Wireless Sensors for IoT. IEEE Transactions On Biomedical Circuits And Systems11 (2): 245 – 254. [6] Masanori Hayashikoshi, Hideyuki Noda, Hiroyuki
Kawai, and Hiroyuki Kondo. (2016) Low-power multi-sensor system with normally offsensing technology for IoT applications.2016 International SoC Design Conference (ISOCC), 195 – 196.
[7] Zhang Feng ; Min Liu; Zhuo Zhou; Weiming Shen. An IoT-Based Online Monitoring System for Continuous Steel Casting.IEEE Internet of Things Journal3 (6): 1355 – 1363. [8] Duy-Hieu Bui; Diego Puschini; Simone Bacles-Min; Edith Beigné; Xuan-Tu Tran. (2016) Ultra low-power and low-energy 32-bit datapath AES architecture for IoTapplications. 2016 International Conference on IC Design and Technology (ICICDT), 1-4.
[9] Navroop Kaur, Sandeep K. Sood. (2017) An Energy-Efficient Architecture for the Internet of Things (IoT). IEEE Systems Journal11 (2): 796-805.
[10] Intel Edison board. Datasheet available at: https://www.intel.com/content/dam/ support/us/en /documents/edison/sb/edison-module_HG_331189.pdf. [11] Arduino Pro mini board. Datasheet available at
https://store.arduino.cc/usa/arduino-pro-mini.