Asian Journal of Pharmaceutical Research and Development
(An International Peer-Reviewed Journal of Pharmaceutical Research and Development)www.ajprd.com
ISSN 2320-4850
Research Article
“FORMULATION, CHARACTERIZATION AND
OPTIMIZATION OF MOUTH DISSOLVING TABLETS OF
DIACEREIN:
β
-CYCLODEXTRIN SOLID DISPERSION
Gupta Khemchand* and Singhvi Indrajeet
Pacific College of Pharmacy, Udaipur (Rajasthan) -313024.
Received: August 2015 Revised and Accepted: September2015
ABSTRACT
Diacerein is a poorly water soluble drug and bioavailability from its crystalline form is very low. The purpose of the present investigation was to increase the solubility and dissolution rate of Diacerein by preparing a solid dispersion with β
-cyclodextrin (β-CD) using Kneading method. The dissolution profiles of developed formulations in acetate buffer pH 4.5 containing 0.45% SLS were studied. The prepared complexes were characterized by Fourier transform infra red spectroscopy (FTIR), differential scanning calorimetry (DSC) and powder X-ray diffractometry (PXRD). For the preparation of Diacerein mouth dissolving tablets, a 1:2 (Diacerein: β-CD, Batch DK3) solid dispersion was used with L-HPC and croscarmellose sodium as a superdisintegrant. A 32 full-factorial design was employed to study the effect of independent variables, the amounts of L-HPC (X1) and croscarmellose sodium (X2) on dependent variables disintegration time and percentage friability. FTIR, DSC and PXRD data indicate that Diacerein was in the amorphous form, which explains the faster dissolution rate of the drug from its solid dispersions. Concerning the optimization study, multiple regression analysis reveals that an optimum concentration of croscarmellose sodium and a higher percentage of L-HPC are required for obtaining rapidly mouth dissolving tablets.Accelerated stability studies of mouth dissolving tablets carried out as per ICH guidelines revealed that the tablets were stable.
Key words: Diacerein, β-cyclodextrin, L-HPC, Croscarmellose sodium, Mouth dissolving tablet, Factorial design (32)
INTRODUCTION
iacerein (DIA), 9, 10-dihydro-4, 5-bis (acetyl)-9, 10-dioxo-2-anthracene carboxylic acid, is a new anti-inflammatory anthraquinone derivative used mainly as a slow acting disease modifying drug in osteoarthritis, metabolized to active Rhein (Rh) 1, 2. Rhein is thought to act via inhibition of interleukin-1band proteolytic enzymes, along with which it stimulates the synthesis of cartilage components and modifies the underlying pathological conditions 3, 4.
*Corresponding author Khemchand Gupta
Pacific College of Pharmacy, Udaipur (Rajasthan) -313024. E-mail: [email protected]
As it does not inhibit the synthesis of prostaglandins is emerging as better and safe therapeutic agent compared to NSAIDs. Diacerein is sparingly soluble in water (3.197 mg/L) which is the reason for poor dissolution rate, absorption and subsequently low and erratic bioavailability (35–56 %) 3. Poor aqueous solubility could lead to failure of formulation development in spite of their potential pharmacokinetic activity. Thus, a strategy to improve bioavailability should aim at improving its aqueous solubility and overcoming first passmetabolism.
Innovative drug delivery systems known as melt in mouth or mouth dissolving tablets (MDT) are novel types of tablets that disintegrate/disperse/dissolve in saliva. Their
characteristic advantage, such as administration without water anywhere anytime, leads to their suitability for geriatric and pediatric patients. They are also most suitable for drugs that undergo extensive fist pass metabolism. The benefits, in terms of patient compliance, rapid onset of action as the drug goes directly into systemic circulation and good stability, make these tablets popular as a dosage form of choice on the current market. However, a major challenge is to develop mouth-dissolving tablets of poorly soluble drugs5.
Techniques that have been used to improve dissolution and bioavailability of poorly water-soluble drugs include micronization, use of surfactants and the formation of solid dispersions 6, 7. Of the various approaches to improve drug solubility, complexation with cyclodextrin is being widely explored. Cyclodextrins are powerful carriers for improving the therapeutic efficacy of drugs with poor aqueous solubility through inclusion complexes.
Full-factorial experimental design is one of the best tools for studying the effect of different variables on the quality determinant parameters of any formulation. Factorial design evaluates the influence of various formulation parameters and their interaction with the lowest number of experiments, hence reducing the cost and time of the work8. In the present study, independent variables were assigned to the amounts of low- substituted hydroxyl propyl cellulose (X1) and
croscarmellose sodium (X2) at three different
levels, where as dependent variables were assigned to disintegration time and percentage friability. Multiple linear regression analysis of the results gave equations that adequately
describe the influence of the independent variables on the selected responses.
The purpose of this study was to improve the solubility and dissolution rate of Diacerein by forming a binary complex with β-cyclodextrin by kneading method and to formulate its mouth dissolving tablets. A 32 full factorial design was also used to study the effect of formulation variables on the performance of these tablets.
MATERIALS AND METHODS:
The drug Diacerein was procured as gift sample from Zydus Cadila, Ahmedabad (India), low- substituted hydroxyl propyl cellulose (L-HPC), croscarmellose sodium (CCS) and β-cyclodextrin (β-CD) was procured from Ranbaxy Lab Ltd. Gurgaon (HR). Mannitol and magnesium Stearate was procured from Chem dyes Corpo. Rajkot. All other chemicals were procured locally and were of analytical grade.
Preparation of solid dispersion by kneading method (DK1-DK4)
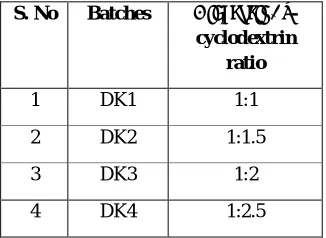
Inclusion complex of Diacerein with β -cyclodextrin (β-CD) in different molar ratios (1:1, 1:1.5, 1:2 and 1:2.5) was prepared by kneading method. An accurately weighed amount of β-cyclodextrin was taken in glass mortar and kneaded with small amount of water to make slurry. Diacerein was added slowly into the slurry with continuous kneading. Once all the drug was incorporated into the slurry, the thick slurry was then kneaded for 45 min. The slurry was taken into the petri dish and dried at 40 0C. The dry powder was pulverized and passed through sieve # 100 and stored in dessicator. Different batches of Diacerein: β-CD solid dispersion is shown in table 1.
Table 1: Abbreviations used to designate different solid dispersion batches
S. No Batches Diacerein: β
-cyclodextrin ratio
1 DK1 1:1
2 DK2 1:1.5
3 DK3 1:2
4 DK4 1:2.5
Characterization of solid dispersions
Estimation of drug content
paper no. 41. The filtrate was suitably diluted with phosphate buffer pH 6.8 and analysed against blank solution by spectrophotometrically at 258 nm. This was done in triplicates and the average drug contents were estimated.
In vitro drug release profile
In vitro dissolution test for Diacerein solid dispersions (DKI-DK4) was performed in triplicate using USP dissolution apparatus type II (paddle method). The medium was 900 ml of phosphate pH 6.8 buffers, maintained at 37 C ± 0.5 C. The paddles were rotated at 75 rpm.The solid dispersions equivalent to 50 mg of Diacerein were taken in muslin cloth and tied to the paddle. Sample (5 ml) was withdrawn at different time intervals (5, 10, 15, 30, 45 and 60 minutes) and replaced with the same amount of pH 6.8 buffer to maintain the perfect sink condition. Sample (5 ml) was made up to 10 ml with pH 6.8 buffer (for pure drug: no dilution), filtered and the drug absorbance was measured at wavelength of 258 nm using a double beam spectrophotometer.
Fourier Transform Infrared Spectroscopy (FTIR)
Infrared spectroscopy is one of the most powerful analytical technique which offers the possibility of chemical identification. FTIR spectra of Diacerein, β-cyclodextrin (β-CD) and solid dispersions of Diacerein with β-CD (optimized batch DK3) were recorded using ATR spectrophotometer (Bruker- Alpha E). Samples were scanned from 4000 to 600 cm-1.
Differential Scanning Calorimetry (DSC)
Differential Scanning Calorimetry (DSC) analysis of the samples (Diacerein, β -cyclodextrin, and solid dispersions of Diacerein with β-CD (optimized batch DK3) was carried out on a DSC-60 (Shimadzu Corporation, Japan). Samples were heated under nitrogen atmosphere on an aluminum pan at a heating rate of 100C per min over the temperature range of 50- 3000C.
Powder X-ray diffraction studies (PXRD)
This technique is extremely reliable to evaluate the changes in the crystalline phase
and amorphization of solid drug as a result of excipient or carrier interactions. Crystallinity is indicated by the presence of sharp peaks that are absence in case of amorphous drugs.9, 10
The powder X-ray diffraction (XRD) of Diacerein, β-cyclodextrin and solid dispersions of Diacerein with β-CD (optimized batch DK3) was recorded using an X-ray diffractometer (Goniometer PW3050). The scanning rate was 100/min and diffraction angle (2θ) was 5-500.
Amongst, all the solid dispersion batches (DK1-DK4), the solid dispersion batch DK3 prepared by kneading method at molar ratio of 1:2 (Diacerein: β-CD) showed best in-vitro dissolution results was selected as optimized batch and used for formulating into mouth dissolving tablets.
Preparation of mouth dissolving tablets of diacerein
In the preparation of mouth dissolving tablets (MDTs), the technique of design of experiment (DOE) is used for optimizing the formula. Based on initial trials, levels of L-HPC and croscarmellose sodium were selected. Nine batches of mouth dissolving tablets were prepared from optimized solid dispersion according to 32 factorial design and evaluated.
Table 2: Factorial design (32) batches of MDTs of Diacerein: β-CD (1:2) solid dispersion
S.No Ingredients (mg/tab.) F1 F2 F3 F4 F5 F6 F7 F8 F9
1 Solid dispersion* 151.88
2 L-HPC 7.5 7.5 7.5 10 10 10 12.5 12.5 12.5
3 CCS 2.5 5 7.5 2.5 5 7.5 2.5 5 7.5
4 Mannitol 80.62 78.12 75.62 78.12 75.62 73.12 75.62 73.12 70.62
5 Magnesium Stearate 2.5 2.5 2.5 2.5 2.5 2.5 2.5 2.5 2.5
6 Talc 5 5 5 5 5 5 5 5 5
Total 250 250 250 250 250 250 250 250 250
* Diacerein: β-CD (1:2, batch DK3) solid dispersion equivalent to 50 mg of Diacerein
Optimization by using 32 full factorial design
The statistical experimental design in this study was performed using Design expert® software version 9.0.3 (Stat-Ease, Inc., USA). In order to investigate the factors systematically, a 32 factorial design was
employed. In this design 2 factors were evaluated, each at 3 levels, and experimental trials are performed at all 9 possible
combinations.12, 13 The amount of L-HPC (X1)
and the amount of croscarmellose sodium (X2)
were selected as independent variables. The three factorial levels for each independent factors, low, medium and high, were coded as -1, 0 and 1, respectively. The disintegration time (Y1) and percentage
friability (Y2) were selected as dependent
variables. The layout of 32 factorial design for factorial batches F1-F9 are shown in table 3.
Table 3: Full factorial design (32) layout for mouth dissolving tablets (MDTs) of Diacerein: β-CD (1:2, DK3) solid dispersion
Batch codes Variable levels in coded Form
Disintegration time (Sec.)* Friability (%)
X1 (mg) X2 (mg)
F1 -1 -1 79±3.60 0.53
F2 -1 0 68±2.64 0.61
F3 -1 1 54±2.0 0.73
F4 0 -1 72±3.46 0.48
F5 0 0 55±1.73 0.56
F6 0 1 47±1.0 0.63
F7 1 -1 56±2.0 0.42
F8 1 0 41±1.0 0.49
F9 1 1 29±1.73 0.55
Coded values
Actual values (mg)
X1 X2
-1 7.5 2.5
0 10 5
1 12.5 7.5
X1: Indicates amount of L-HPC (mg), X2: Amount of croscarmellose sodium (mg)
DT: Disintegration time (seconds), F: Friability (%)
Evaluation of mouth dissolving tablets
Weight variation test was carried out as per IP 2010. The hardness of the tablets was measured using a Monsanto hardness tester and friability was measured using a Roche Friabilator. Wetting time and water absorption ratio of mouth dissolving tablets was carried out by using the method given by Bi et al. (1996)14. In this method a piece of tissue paper folded twice placed in a petri dish containing 6 ml of water. A tablet is placed on the paper, and the time for complete wetting was measured. The wetted tablet was then weighed and the water absorption ratio was calculated using the equation (R = 100 (Wb- Wa) / Wa),
Where Wa and Wb are the weights of tablets
before and after water absorption respectively. Disintegration test was carried by using the method given by Madgulkar AR et al. (2009)15. Drug content was determined by the method given by khemchand et al. (2013)16.
In vitro drug release studies
In vitro dissolution test for mouth dissolving tablets was performed in triplicate using USP dissolution apparatus type II (paddle method). The medium was 900 ml of phosphate pH 6.8 buffers, maintained at 37 C ± 0.5 C. The paddles were rotated at 75 rpm.Sample (5 ml) was withdrawn at different time intervals (5, 10, 15, 30, 45 and 60 minutes) and replaced with the same amount of pH 6.8 buffer to maintain the perfect sink conditions. Sample (5 ml) was made up to 10 ml with pH 6.8 buffer, filtered and the absorbance was
measured at wavelength of 258 nm against blank using a double beam spectrophotometer.
Accelerated stability studies
The stability studies were performed on the most promising mouth dissolving tablet formulation F9 according to ICH (International Conference on Harmonization) guidelines for six months17. The study was performed by keeping the prepared tablets in air tight high density polyethylene bottles and placed in a desiccator containing saturated solution of sodium chloride, which gave a relative humidity of 75±5%. The desiccator was placed in a hot air oven maintained at 40±2oC and samples were withdrawn at 30, 90 and 180 days. All the parameters (friability, disintegration time, wetting time, water absorption ratio, drug content and in-vitro drug release) of formulation were measured at predetermined time interval.
RESULTS AND DISCUSSION
Characterization of solid dispersions
Estimation of drug content
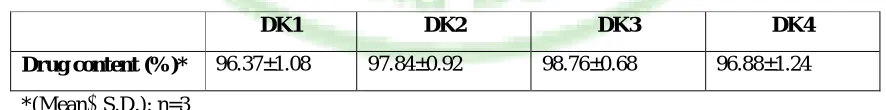
The results of estimation of drug content (%) from sold dispersions of Diacerein with β-CD are shown in table 4. The drug content was found to be in the range of 96.37 to 98.76% (DKI- DK4), indicating the acceptability of kneading method for preparation of solid dispersions. Low values of standard deviation in drug content of solid dispersion indicated uniform drug distribution in all the prepared batches.
Table 4: Drug content (%) from solid dispersion batches DK1 to DK4
DK1 DK2 DK3 DK4
Drug content (%)* 96.37±1.08 97.84±0.92 98.76±0.68 96.88±1.24
*(Mean S.D.): n=3
In vitro drug release profile
Dissolution studies of pure Diacerein and all prepared solid dispersions were carried out in phosphate buffer pH 6.8. From these data, it is evident that the onset of dissolution of pure Diacerein was very low. The drug released from pure Diacerein (PD) was only 56.11% in
60 minutes during the in vitro dissolution study, suggesting a strong need to enhance the dissolution of Diacerein.
dispersions prepared by kneading method in the ratios of 1:1, 1:1.5, 1:2 and 1:2.5 (Diacerein: β-CD) were showed 76.34 %, 93.08%, 99.26 % and 91.25 % drug release respectively at the end of 60 minutes. However, the inclusion complex at a molar ratio of 1: 2 (DK3) achieved maximum dissolution rate of the drug. The enhancement of dissolution of Diacerein from the
Diacerein-β-CD solid dispersions may be due to several factors such as lack of crystallinity, increased wettability and dispersibilityof the drug from dispersion. On further increasing the amount of β-cyclodextrin in solid dispersion i.e. formulations at 1:2.5 ratio (DK4) showed slightly decrease in dissolution rate, this might be due to the higher amount of carrier itself takes time to dissolution.
Figure 1: In vitro drug release from Diacerein: β-CD solid dispersion in pH 6.8 Phosphate buffer Fourier Transform Infrared Spectroscopy
(FTIR)
The FTIR spectra of Diacerein, β-cyclodextrin and solid dispersions of Diacerein with β-CD are shown in figure 2 A, B and C respectively. The IR spectra of Diacerein-β-CD complexes showed considerable differences when compared with those of their corresponding constituents. Upon complexation, a significant shift in the characteristic peaks of the guest molecule, either to higher or lower frequency, disappearance and broadening of the peaks of the guest proves interaction between the drug and β-CD molecules18. The principal absorption peaks of Diacerein at 1764.83,
1674.83 and 1194.49 cm-1 shifted to a slightly higher frequency at 1765.42, 1676.37 and 1209.84 cm-1 respectively and broadening of these peaks were also observed.The observed shifts and broadening of the peaks clearly indicated the presence of host–guest interactionsand formation of monomeric drug dispersion as a consequence of the interaction with β-CD, which could result in inclusion of the Diacerein in the hydrophobic cavity of the β-CD. The binary system of Diacerein-β-CD did not show any new peaks, indicating the absence of chemical bond formation inbinary system.
B. β-cyclodextrin C. Diacerein with β-CD (optimized batch DK3)
Figure 2: FTIR spectra of Diacerein (A), β-cyclodextrin (B) and solid dispersion of Diacerein with β-CD (C)
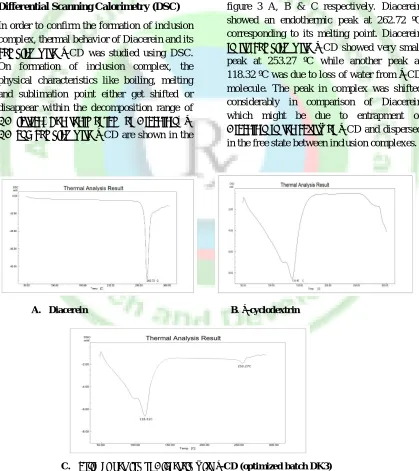
Differential Scanning Calorimetry (DSC)
In order to confirm the formation of inclusion complex, thermal behavior of Diacerein and its complex with β-CD was studied using DSC. On formation of inclusion complex, the physical characteristics like boiling, melting and sublimation point either get shifted or disappear within the decomposition range of CD lattice. The thermogram of Diacerein, β -CD and complex with β-CD are shown in the
figure 3 A, B & C respectively. Diacerein showed an endothermic peak at 262.72 ºC corresponding to its melting point. Diacerein in its complex with β-CD showed very small peak at 253.27 ºC while another peak at 118.32 ºC was due to loss of water from β-CD molecule. The peak in complex was shifted considerably in comparison of Diacerein which might be due to entrapment of Diacerein in the cavity of β-CD and dispersed in the free state between inclusion complexes.
A. Diacerein B. β-cyclodextrin
C. Solid dispersion of Diacerein with β-CD (optimized batch DK3)
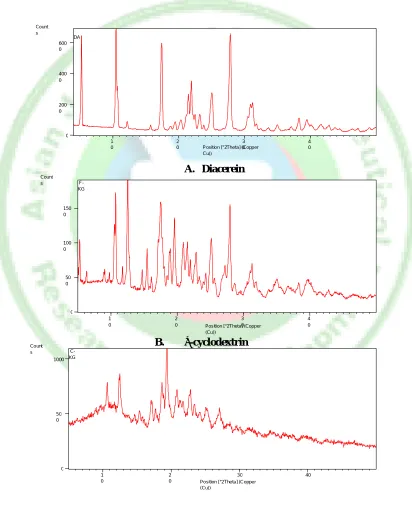
Powder X-ray diffraction studies (PXRD)
The XRD patterns of Diacerein, β-CD and Diacerein–β-CD inclusion complexes are shown in figure 4 A, B & D respectively. The powder X-ray diffraction pattern of pure Diacerein exhibited a series of intense peaks at 2θ value of 10.4°, 17.4°, 15.045°, 25.375°, 27.9°, 32.27°, 37.09° and 41.45° which were indicative of their crystallinity. However, the patterns of β-CD are crystalline in nature with
major peaks at 2θ values of 4.75°, 12.7°, 19.7°, 21.1°, 22.8°, 24.3° and 35.9°. The inclusion complexes of Diacerein-β-CD in the ratio of 1:2 prepared by kneaded method have completely diffused diffraction patterns and some peaks were also absent in the complex. These results suggested the amorphization of the drug and formation of amorphous inclusion complexes. These results of PXRD were strongly supported by the above DSC observations.
A. Diacerein
A. Diacerein
B.
B. β-cyclodextrin
C. Solid dispersion of Diacerein with β-CD (optimized batch DK3)
Figure 4: X-ray diffraction patterns of Diacerein (A), β-cyclodextrin (B) and solid dispersion of Diacerein with β-CD (C)
Position [°2Theta] (Copper Cu)) 1 0 2 0 3 0 4 0 Count s 0 200 0 400 0 600 0 DA
Position [°2Theta] (Copper (Cu)) 1 0 2 0 3 0 4 0 Count s 0 50 0 100 0 150 0 F-KG
Evaluation of mouth dissolving tablets
The data obtained for post-compression parameters such as weight variation test, hardness, wetting time, water absorption ratio and drug content of factorial batches F1- F9 are shown in the table 5. The data obtained for disintegration time and friability are shown in table 3.
Tablets obtained were of uniform weight with acceptable weight variation limits as per IP specification i.e., below 7.5 %. Hardness of tablets was found to be 3.50 to 4.83 kg/cm2. Water absorption ratio and wetting time were
found to be in the range of 56.64 to 74.04 % and 22.67 to 62.33 seconds respectively. Drug content was found to be in the range of 98.22 to 101.08 %, which was within acceptable limits. Friability below 1% was an indication of good mechanical resistance of the tablets. The most important parameter that needs to be optimized in the development of MDTs is the disintegration time of tablets. It was observed that the disintegration time of the tablets decreased from 79 to 29 seconds with increasing in the level of L-HPC and croscarmellose sodium both.
Table 5: Evaluation parameters of mouth dissolving tablets (MDTs) of F1-F9
Batches
Weight variation test
(mg)***
Hardness (kg/cm2)**
Wetting time (sec)*
Water absorption ratio
(%)*
Drug content (%)*
F1 249±2.52 3.50±0.55 62.33 ±1.15 56.64±1.16 98.58 0.99
F2 252±2.16 3.66±0.51 53.67 ±0.57 59.26 ±0.71 98.22 1.56
F3 250±2.35 3.66±0.51 40.0 ± 2.0 63.41±2.53 99.29 1.07
F4 251±1.54 4.16±0.41 51.33 ±1.52 60.45±2.14 99.24 2.68
F5 248±1.66 4.50±0.55 37.0 ±1.0 62.74 ±0.67 101.08 0.81
F6 250±0.96 4.66±0.52 32.67 ± 2.08 65.31±1.12 98.90 1.92
F7 249±1.72 4.50±0.55 41.33 ± 1.52 64.39±1.18 99.65 0.84
F8 251±1.14 4.66±0.52 31.0 ± 2.64 68.31±1.96 100.54 1.35
F9 250±0.82 4.83±0.82 22.67 ± 2.51 74.04±1.23 99.09 1.41
(Mean ±S.D), ***n=20, **n=6, *n=3
In vitro drug release studies
Figure 5 and6showed the dissolution profiles of Diacerein from mouth dissolving tablets of factorial batches F1-F5 and F6-F9 respectively. The cumulative percentage drug release of formulation batch F1-F9 was found to be in the range of 88.14 to 100.21 % at the end of 60 minutes. The cumulative percentage of the drug released from formulation F9 found by the dissolution test showed the better drug release of 100.21% at the end of 60 minutes indicated good bioavailability of the drug from these formulations. As the amount
Figure 5: In vitro drug release (%) from Diacerein: β-CD mouth dissolving tablets (F1 to F5)
Figure 6: In vitro drug release (%) from Diacerein: β-CD mouth dissolving tablets (F6 to F9)
Optimization by using 32 full factorial design
To investigate the factors systematically, a factorial design was employed (Table 3). As shown in equation 1, a statically model incorporating interactive and polynomial terms was used to evaluate the responses.
Y=b0 +b1X1+b2X2+b12X1X2+b12X12+ b22X22
……… Eq.1
Where Y, is the dependent variables namely disintegration time and percent friability; b0 is
the arithmetic mean response of the 9 runs; and b1 and b2 are the estimated
coefficients for the independent factors X1 and
X2, respectively. The main effects (X1 and X2)
represent the average result of changing one factor at a time from its low to high value. The interaction term (X1X2) shows how the
response changes when two factors are simultaneously changed. The polynomial terms (X12and X22) are including investigating
nonlinearity.
To optimize the properties of MDTs that contain Diacerein: β-CD solid dispersed drug, three concentration levels of L-HPC (X1), low
(3% w/w), medium (4% w/w) and high (5% w/w) and three concentration levels of CCS (X2), low (1% w/w), medium (2% w/w) and
high (3% w/w) were used in the factorial design experiment.
respectively). The data clearly indicated that the disintegration time (Y1) and percent
friability (Y2) values were strongly dependent
on the selected independent variables. The obtained data were analyzed using a Design expert® software version 9.0.3 in order to generate mathematical models for each of the responses. The results of analysis for each response variable were as follows:
Disintegration time (Y1) = 57 -12.5 X1 - 12.83X2- 0.5 X1 X2 – 3.5 X12+ 1.5 X22 ---Eq.2
Friability (Y2) = 0.55 -0.068 X1 + 0.080X2- 0.018X1 X2 – 0.001X12+ 0.003X22 --- Eq.3
Analysis of variance (ANOVA) was performed to evaluate the significance of the quadratic model on the responses and to establish their quantitative effects. Table 6 & 7 summarizes the effects of the model terms and associated p values for all responses. In this case, both the models generated for disintegration time and percent friability were
significant. The high values of correlation coefficient for disintegration time and percent friability (0.9937 & 0.9948 respectively) indicate a good fit of model.
In case of the disintegration time (Y1), X1
and X2 are significant model terms. The results
of multiple linear regression analysis revealed that on increasing the amount of either L-HPC or CCS, a decrease in disintegration time was observed because both the coefficients X1 and
X2 bear a negative sign with p value 0.0006 &
0.0006 respectively. The influence of CCS on disintegration time is quite prominent and when higher amount of CCS was used, higher water uptake swelling and deformation of the CCS take place, which gave internal pressure on tablet to disintegrate. It was obvious that in the presence of higher amount of L-HPC, swelling was facilitated. Minimum value of disintegration time was observed at the highest level of both the polymers. The corresponding contour plot of disintegration time is shown in figure 7.
Table 6: Analysis of variance (ANOVA) for response surface quadratic model for MDTs of Diacerein: β-CD (1:2, DK3) solid dispersion (Disintegration time, sec)
Source Sum of
Squares
Degree of
Freedom
Mean
Square
F-value p-value
Prob > F
Model 1955.67 5 391.13 95.14 0.0017 Significant
X1:L-HPC 937.50 1 937.50 228.04 0.0006
X2: CCS 988.17 1 988.17 240.36 0.0006
X1X2 1.00 1 1.00 0.24 0.6557
X12 24.50 1 24.50 5.96 0.0924
X22 4.50 1 4.50 1.09 0.3723
Residual 12.33 3 4.11
Cor Total 1968.00 8
Figure 7: Contour plot of disintegration time for MDTs of Diacerein: β-CD (1:2, DK3) solid dispersion
Figure 8: Response surface plot showing the effect of L-HPC and CCS on disintegration time (Y1) of Diacerein: β-CD MDTs
In case of the friability (Y2), terms X1
(L-HPC concentration) and X2 (CCS
concentration) were identified as the most significant factors with p value 0.0006 and 0.0004 respectively, whereas the interactive term X1X2 was less significant with p value
(0.0483) just below the significant level (p<0.05). An increase in the amount of CCS leads to an increase in friability because the coefficient X2 bear a positive sign. When a
higher amount of CCS was used, low compressible tablets were produced, which were mechanically weak. The increase in the amount of L-HPC results in decreased friability values because X1 bear a negative
sign. L-HPC was known to produce
mechanically stronger tablets. The polynomial terms X12 and X22 had a very minor quadratic
effect on percent friability. The corresponding contour plot of friability is shown in figure 9.
Table 7: Analysis of variance (ANOVA) for response surface quadratic model for MDTs of Diacerein: β-CD (1:2, DK3) solid dispersion (Friability, %)
Source Sum of
Squares
Degree of
Freedom
Mean
Square
F-value p-value
Prob > F
Model 0.068 5 0.014 115.09 0.0013 Significant
X1:L-HPC 0.028 1 0.028 238.25 0.0006
X2: CCS 0.038 1 0.038 326.55 0.0004
X1X2 1.225E-003 1 1.225E-003 10.42 0.0483
X12 5.556E-006 1 5.556E-006 0.047 0.8419
X22 2.222E-005 1 2.222E-005 0.19 0.6931
Residual 3.528E-004 3 1.176E-004
Cor Total 0.068 8
R2 0.9948
Figure 9: Contour plot of friability for MDTs of Diacerein: β-CD (1:2, DK3) solid dispersion
Figure 10: Response surface plot showing the effect of L-HPC and CCS on percent friability (Y2) of
Diacerein: β-CD MDTs
Model validation and optimization of the formulation parameters
points batches of X1 = 0.895, X2 = 0.959, X1 =
0.968, X2 = 0.536, and X1 = 0.249, X2 = 0.925
were selected and prepared. The composition of the check points formulations, their predicted and experimental values for disintegration time and friability are shown in
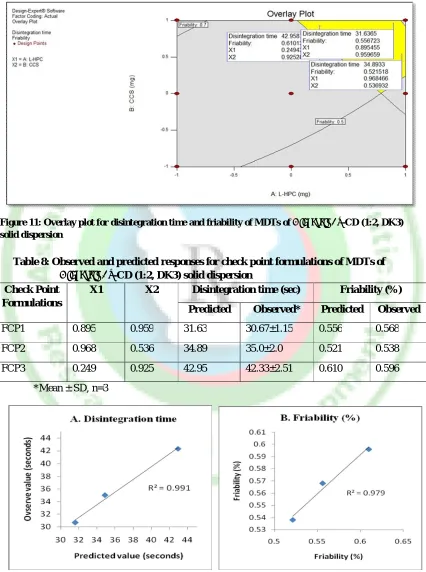
table 8. The correlation plots between the observed and predicted values of the disintegration time and friability are shown in figure 12 A and B respectively. The overlay plot for disintegration time and friability are shown in figure 11.
Figure 11: Overlay plot for disintegration time and friability of MDTs of Diacerein: β-CD (1:2, DK3) solid dispersion
Table 8: Observed and predicted responses for check point formulations of MDTs of Diacerein: β-CD (1:2, DK3) solid dispersion
Check Point Formulations
X1 X2 Disintegration time (sec) Friability (%)
Predicted Observed* Predicted Observed
FCP1 0.895 0.959 31.63 30.67±1.15 0.556 0.568
FCP2 0.968 0.536 34.89 35.0±2.0 0.521 0.538
FCP3 0.249 0.925 42.95 42.33±2.51 0.610 0.596
*Mean ± SD, n=3
Figure: 12: Linear correlation plots of disintegration time (A) and friability (B) for check points formulations of MDTs of Diacerein: β-CD (1:2, DK3) solid
Comparison of the magnitudes of the observed responses of three formulations taken as the checkpoints, with those predicted using response surface methodology (RSM), indicated that the observed values of disintegration time and percent friability of the tablets for the check point formulations were in close agreement with the values predicted by the model. The linear correlation plots drawn between the predicted and observed values demonstrated high values of R2 (0.991
for disintegration time and 0.979 for friability) confirmed the goodness of model.
Accelerated stability studies
No significant variation (1 to 3%) in drug release and other evaluation parameters were observedat accelerated conditions of 45 ± 2º C with 75 ± 5% RH. Therefore, it was concluded that the batch F9 was stable over the chosen temperature and humidity for 6 months. The results are shown in table 9.
Table 9: Accelerated stability studies of the optimized formulation F9 at 40 ± 2 °C/ 75 ± 5 % RH for six months
Parameters Days
0 30 90 180
Friability (%) 0.55 0.55 0.57 0.60
Disintegration time (sec) * 29.0±1.73 29.67±1.73 30.0±2.0 31.33±1.15 Wetting time * 22.67±2.51 23.0±1.0 24.33±0.57 25.67±2.51 Water absorption ratio* 74.04±1.23 74.68±1.48 77.21±2.67 75.35±2.13 Drug content (%)* 99.09±1.41 98.25±0.78 98.12±1.65 97.36±1.18 In vitro drug release in 60
Minutes*
100.21±0.65 99.47±1.56 98.15±2.33 97.30±1.44
*(Mean S.D.): n=3
CONCLUSION
The present study concluded that β -cyclodextrin is a suitable carrier for the preparation of Diacerein solid dispersions. FTIR and DSC study demonstrated absence of any notable interaction between Diacerein and β-CD. PXRD data showed conversion of Diacerein from crystalline to an amorphous form which is responsible for the enhanced solubility. Experimental design provided a better understanding of the effect of formulation variables on the quality of mouth dissolving tablets containing a solid dispersion of a hydrophobic drug and reveals that an optimum concentration of croscarmellose
sodium and a higher percentage of L-HPC are required for obtaining rapidly mouth dissolving tablets. The optimal batch (F9) exhibited a disintegration time of 29 sec, percentage friability of 0.55%, wettability of 22.67 sec and 100.21 % drug release in 60 minutes.
ACKNOWLEDGMENTS
The authors are thankful to Zydus Cadila, Ahmedabad (India) for providing the gift samples of Diacerein and Ranbaxy Lab Ltd. Gurgaon (HR) for low-substituted hydroxyl propyl cellulose (L-HPC), croscarmellose sodium (CCS) and β-cyclodextrin (β-CD).
REFERENCES
1. Fidelix, T.S., Soares, B.G., Trevisani, V.F.: Diacerein for osteoarthritis. Cochrane Database Syst Rev.1, CD005117, 2006.
2. Tamura, T., Yokoyama, T., Ohmori, K.: Effects of diacerein on indomethacin induced gastric ulceration. Pharmacology 2001; 63: 228–233. 3. Maski, N., Arulkumaran Girhepunje, K., Ghode, P.,
Randive, S., Pal, R.: Studies on preparation, characterization and solubility of b-cyclodextrin/diacerein inclusion complexes. Int. J. Pharm. and Pharm. Sci.1, 2009; (2): 121–135.
4. Mahajan, A., Singh, K., Tandon, V., Kumar, S., Kumar, H.: Diacerein: a new symptomatic slow acting drug for osteoarthritis. J. Medical Edu. Res., 2006, 8 (3), 173–175.
5. M. Gohel, M. Patel, A. Amin, R. Agrawal, R. Dave and N. Bariya. Formulation design and optimization of mouth dissolve tablets of nimesulide using vacuum drying technique. AAPS PharmSciTech. 2004; 36: 1– 6.
dispersions with polyvinylpyrrolidone K25. Eur. J.Pharm. Sci. 2001, 12, 261–269.
7. Chiou, W. L.; Riegelman, S. Pharmaceutical applications of solid dispersions. J. Pharm. Sci. 1971, 60, 1281–1302.
8. Bhavsar, M., Tiwari, S., Amiji, M. Formulation optimization for the nanoparticles in microsphere hybrid oral delivery system using factorial design. Journal of Controlled Release, 2006; 110: 422-430. 9. Margarit M V, Rodriguez I C, Cerezo A. Physical
characteristics and dissolution kinetics of solid dispersions of ketoprofen and polyethylene glycol 6000. International Journal of Pharmaceutics, 1994; 108 (2): 101–107.
10.Hoag S W et al. Influence of various drugs on the glass transition temperature of poly (vinylpyrrolidone): a thermodynamic and spectroscopic investigation. International Journal of Pharmaceutics, 2001; 225 (1-2): 83-96.
11.Carmen Popescu et al. Selection of non-synthetic disintegrants for pharmaceutical and nutraceutical orally disintegrating tablets. Tablets & Capsules, 2010.
12.Bolton S. Pharmaceutical Statistics. 2nd ed. New York, NY: Marcel Decker Inc. 1990: 234. 13.Franz RM, Browne JE, Lewis AR. Experiment design,
modeling and optimization strategies for product and
process development. In: Libermann HA, Reiger MM, Banker GS, eds. Pharmaceutical Dosage Forms: Disperse Systems. Vol 1. New York, NY: Marcel Dekker Inc; 1988; 427-519.
14.Bi Y, Sunada H, Yonezawa Y. Preparation and evaluation of a compressed tablet rapidly disintegrating in the oral cavity. Chem. Pharm. Bull., 1996; 44(11):2121-2127.
15.Madgulkar AR1, Bhalekar MR, Padalkar RR. Formulation design and optimization of novel taste masked mouth-dissolving tablets of tramadol having adequate mechanical strength. AAPS PharmSciTech., 2009; 10(2):574-81.
16.Gupta khemchand, Singhvi I and Bais S. U.V. Method for quantitative estimation of Diacerein from capsule formulation. Asian Journal of Pharmaceutical Analysis, 2013; 3(4):124-126.
17.ICH Topic Q1A (R2), 2003, “Note for Guidance on Stability Testing: Stability Testing of New Drug Substances and Products”, CPMP/ICH/2736/99. 18.Guyot, M, Fawaz, F Bildet, J Bonini, F and Lagueny,