Methods for evaluating social
vulnerability to drought
A. Iglesias, M. Moneo, S. Quiroga
Dpto. de Economía y Ciencias Sociales Agrarias, E.T.S. Ingenieros Agrónomos, Universidad Politécnica de Madrid, Avenida Complutense, s/n, 28040 Madrid, Spain
SUMMARY –Social vulnerability to drought is complex but is reflected by the social capacity to anticipate, cope with and respond to drought. Here we estimate these aspects of social vulnerability evaluating the natural resource structure, the economic capacity, the human and civic resources, and aspects of agricultural innovation. The weight of each component of the index is a key determinant of the final value. Here we present the results of the index under two valuation scenarios. In Scenario 1 all components are valued equally. In Scenario 2 the human resources component is given 50% of the weight, the economic and natural resource components are given 20% of the weight each, and the agricultural technology is given 10% of the weight. This reflects the assumption that a society with institutional coordination and strengths for public participation is less vulnerable to drought and that agriculture is only one of the sectors affected by drought. The vulnerability index establishes robust conclusions since the range of values across countries does not change with the assumptions under the two scenarios.
Key words:risk, cause, socio-economic, environmental, vulnerability index.
Introduction
The objective of the vulnerability assessment is to identify underlying causes of risk derived from inadequate structures, management, and technology, or by economic, environmental, and social factors. Vulnerability refers to the characteristics of a group in terms of its capacity to anticipate, cope with, resist and recover from the impact of drought. Vulnerability assessment aims to identify characteristics of the systems that modify the level of risk derived from inadequate structures, management, and technology, or caused by economic, environmental, and social factors.
Yohe and Tol (2002) proposed a method for developing indicators for social and economic coping capacity in the context of climate change. Later, a simple index to quantify adaptive capacity was used by Ionescu et al.(2007) including only GDP, literacy rate, and labour participation rate of women. Yohe et al. (2006) used the Vulnerability-Resilience Indicator Prototype (VRIP) developed by Brenkert and Malone (2005) as a proxy to adaptive capacity index, considering the capacity to adapt to environmental change as implicit in the vulnerability assessment.
Iglesias et al.(2007a) develop an Adaptive Capacity index (AC index) with three major components that characterize the economic capacity, human and civic resources, and agricultural innovation. And a similar approach has been taken in the context of drought (Moneo, 2007). The approach is flexible and can be applied to managed and natural ecosystems as well as to socio-economic systems.
The overall vulnerability is determined by combining vulnerability derived from the direct exposure to drought, and vulnerability to drought derived from social and economic aspects. For example, given a specific farm, the vulnerability is directly related to the intensity of the drought event. In contrast, given a defined drought event, the most vulnerable farming system is the one that has less social and economic resiliency; in general marginal and poor farming systems suffer the largest consequences of drought.
Vulnerability directly related to drought
This component analyses the vulnerability directly related to the exposure to drought in the present. The underlying causes of risk may be related to structural problems, such as lack of adequate hydraulic infrastructures or technology, and also to management, economic and social features that increase the vulnerability of the region, watershed or water supply system under analysis. For example, the direct impact
of precipitation deficiencies may be a reduction of crop yields. The underlying cause of this vulnerability however, may be that the farmers did not use drought-resistant seeds, either because they did not believe ¡n their usefulness, their costs were too high, or because of some commitment to cultural beliefs.
Another example could be farm foreclosure related to drought. The underlying cause of this vulnerability could be many things, such as small farm size because of historical land appropriation policies, lack of credit for diversification options, farming on marginal lands, limited knowledge of possible farming options, a lack of local industry for off-farm supplemental income, or government policies.
An index to evalúate socio-economic vulnerability to drought
An index that estimates social vulnerability to drought is developed and calculated in selected Mediterranean countries. The methodology is appropriate to intégrate both quantitative and qualitative characterisations of vulnerability thus permitting the involvement of the stakeholders in the process. The index can be applied locally or spatially and with different aggregation levéis of the input data. The intermedíate components can be evaluated independently, allowing comprehensive interpretation of the strengths and weaknesses of each system.
The sequential steps taken for the quantification of the vulnerability index are: (i) select proxy variables for factors that contribute to the vulnerability; (ii) normalize the proxy variables with respect to some common baseline; (iii) combine the sub-component proxy variables within each vulnerability category by weighted averages; and (iv) quantify vulnerability as the weighted average of the components.
Selection of variables
The socio-economic vulnerability components (Table 1) and the variables included were selected because: (i) data are readily available and an example may be computed to assist stakeholders in defining the sensitivity of the system; and (ii) the variables are drought scenario dependent and geographically explicit. The vulnerability index may be used to understand the sensitivity of the system and to assist in the selection of measures to be adopted. For example, improving the efficiency of agricultural water use, decreasing population under the poverty line, increasing adult literacy rate, and increasing agricultural technology, are measures that result in an overall vulnerability decrease.
Table 1. Components of socio-economic vulnerability and representative variables that can be used to characterise the vulnerable groups
Components Proxy variables
Natural component Agricultural water use (%) Total water use (% of renewable)
Average precipitation 1961 -90 (mm/year) Área salinised by irrigation (ha)
Irrigated área (% of cropland) Economic capacity GDP millions (US$)
GDP per capita (US$)
Agricultural valué added/GDP (%) Energy use (kg oil equivalent per capita)
Population below poverty line (% population with less that 1 US$/day) Human and civic resources Population density
Agricultural employment (% of total) Adult literacy rate (% of total) Life expectancy at birth (years)
Population without access to improved water (% of total) Agricultural innovation Fertiliser consumption (100 kg/ha of arable land)
The components of socio-economic vulnerability and the representative variables that have been used to characterise it are provided in Table 1. A final indicator for each category of exposure may be computed as the weighted average of all the representative variables within the category.
Normalization to some common baseline
The variables in Table 1 were normalized between the different countries in order to compare the results. The standarization has been made with respect the máximum valué of each variable across the countries to combine within the categories and guarantee the Índex being a percent rate. Combine the sub-component proxy variables within each category by using either a geometric mean (Moss et
al., 2000) or a weighted mean with weights inversely proportional to the impact uncertainty level.
Combination of the sub-components
Sub-component proxy variables can be combined within each category by using either a geometric mean or a weighted mean with weights inversely proportional to the impact uncertainty level. This study considers the weights separately for each of the categories, as in Iglesias et al. (2007a), in order to evalúate them independently, allowing noticing the strengths and weaknesses of each component of the total vulnerability Índex within each country. It should be noticed that the vulnerability components have inverse interpretation that adaptation capacity ones.
Quantifying vulnerability
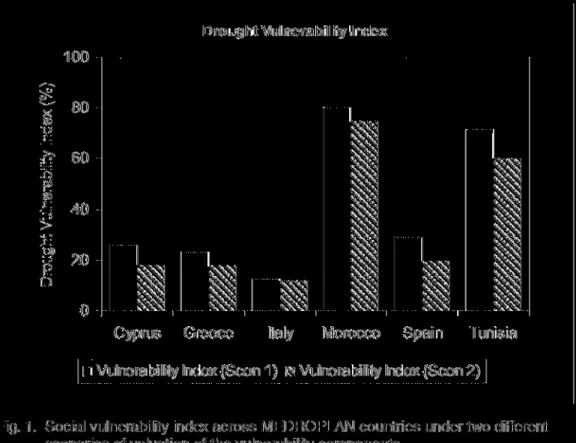
The total vulnerability Índex has been quantified as the weighted average of each of the four components. The four components of the Índex and the total computation are shown on Table 2 and Fig. 1 also illustrates the drought vulnerability Índex. The scores of the vulnerability Índex range on a scale of 0 to 100, being 0 the least vulnerable and 100 the most vulnerable. The total índex is generated as the average of all components. The final valué of the Índex depends on the valuation of each component. Here we present the results of the Índex under two valuation scenarios. In Scenario 1 all components are valued equally. In Scenario 2 the human resources component is given 50% of the weight, the economic and natural resource components are given 20% of the weight each, and the agricultural technology is given 10% if the weight. This reflects the assumption that a society with institutional coordination and strengths for public participation is less vulnerable to drought and that agriculture is only one of the sectors affected by drought.
Table 2. Components of the social vulnerability Índex and total valúes of the Índex under two different scenarios of valuation of the vulnerability components. Source of data: FAO 2007, Iglesias and Moneo 2005
r Drought Vulnerability Index (%)
Component of the Índex Cyprus Greece Italy Morocco Spain Tunisia Renewable natural capital
Economic capacity
Human and Civic Resources Agricultural innovation
Drought Vulnerability Index (Scen 1) Drought Vulnerability Index (Scen 2)
40 34 1 29 26 18 26 37 5 26 24 18 36 4 7 4 13 12 69 96 65 91 80 75 37 15 7 57 29 20 70 88 39 90 72 60
Drought Vulnerability Index 100 •o > O) Z3 O
Cyprus Greece Italy Morocco Spain Tunisia Vulnerability Index (Scen 1) « Vulnerability Index (Scen 2)
Fig. 1. Social vulnerability Índex across MEDROPLAN countries under two different scenarios of valuation of the vulnerability components.
The results of this evaluation lead to the identification of actions to minimize risk by reducing the underlying causes (vulnerability). The results contribute to increase the adaptive capacity and develop policy decisions to increase adaptation options. The vulnerability assessment bridges the gap between impact assessment and policy formulation by directing policy attention to underlying causes of vulnerability rather than to its result, the negative impacts, which follow triggering events such as drought (Wilhite, 2005). The vulnerability evaluation helps defining the sensitivity of the systems to external shocks and identifying the most relevant aspects that decrease the level of risk.
Discussion
Vulnerability to drought in the Mediterranean región may be intensified, as climate change comes in conjunction with high development pressure, increasing populations, water management that is already regulating most of available water resources, and agricultural systems that are often not adapted (any more) to local conditions. Evidence for the vulnerability of socio-economic and agricultural systems in the Mediterranean región can be documented in recent history. For example, water reserves were not able to cope with sustained droughts in the late 1990's in Morocco and Tunisia, causing many irrigation dependent agricultural systems to cease production. In 2007, the vulnerability of Moroccan agriculture to drought is a reality. In addition, effective measures to cope with long-term drought and water scarcity are limited and difficult to implement due to the variety of the stakeholders involved and the lack of adequate means to negotiate new policies. Climate change projections indícate an increased likelihood of droughts (Kerr, 2005). The combination of long-term change (e.g., warmer average temperatures) and greater extremes (e.g., droughts) can have decisive impacts on the vulnerability of many regions (Arnell, 1999). If climate change intensifies drought impacts, Mediterranean water delivery systems and control may become increasingly unstable and vulnerable (IPCC 2007; Reilly and Schimmelpfennig, 1999; Iglesias et al. 2007b, Burton 1997). Water managers may find planning more difficult and current agricultural water management strategies based on irrigation should be revised.
References
Arnell, N.W. (1999) Climate change and global water resources. Global Environmental Change, Vol 9, Suppl 1, October, pp S31-S49.
Brenkert, A. and Malone, E. (2005). Modeling Vulnerability and Resilience to Climate Change: A Case Study of India and Indian States. Climatic Change, 72(1-2): 57-102.
Burton, I. (1997). Vulnerability and adaptive response in the context of climate and climate change.
Climatic Change, 36, 185-196.
FAO (2006). FAOSTAT and AQUASTAT Datábase Collections. In Internet: http://www.fao.org, Food and Agriculture Organization of the United Nations, Rome. Last visited December 2006.
Iglesias A., Mougou R. and Moneo M. (2007a). Adaptation of Mediterranean agriculture to climate change. In: Key vulnerable regions and climate change, Battaglini, A. (ed), European Climate Forum, Germany. Iglesias, A., Garrote, L, Flores, F. and Moneo, M. (2007b). Challenges to manage the risk of water
scarcity and climate change in the Mediterranean. Water Resources Management, Accepted, 2006
forthcoming (A. Iglesias and L. Garrote, guest editors).
Iglesias, A. and Moneo, M. (eds) (2005). Drought Preparedness and Mitigation in the Mediterranean: Analysis of the Organizations and Institutions. Options Méditerranénnnes, Serie B, No. 51. Zaragoza: CIHEAM.
lonescu, C, Klein, R.J.T., Hinkel, J., Kumar, K.S.K. and Klein, R. (2007).Towards a formal framework of vulnerability to climate change. Environmental Modeling and Assessment (Submitted).
IPCC (2007). Climate Change (2007): Impacts, Adaptation and Vulnerability. Contribution of Working
Group II to the Third Assessment Report of the Intergovernmental Panel on Climate Change.
Cambridge University Press, Cambridge.
Kerr, R.A. (2005). Millennium's Hottest Decade Retains its Title, for Now. Science, 307:11.
Moneo, M. (2007). Agricultural vulnerability of drought: A comparative study in Morocco and Spain. MScThesis, IAMZ-CIHEAM, Zaragoza.
Moss, R. etal. (2000). Measuring Vulnerability:A Trial Indicator Set. Pacific Northwest National Laboratory, Richland, WA, USA.
Reilly, J. and Schimmelpfennig, D. (1999). Agricultural impact assessment, vulnerability, and the scope for adaptation. Climatic Change, 43:745-788.
Whilhite, D.A. (2005). Drought and water crisis. Science, technology and management issues. Taylor and Francis, New York.
Yohe, G., Malone, E., Brenkert, A., Schlesinger, M., Meij, H. and Xing, X. (2006). Global Distributions of Vulnerability to Climate Change. Integrated Assessment Journal, 6 (3): 35-44.
Yohe, G. and Tol, R.S.J. (2002). Indicators for social and economic coping capacity: Moving toward a working definition of adaptive capacity. Global Environmental Change, 12 (2002): 25-40.