RESEARCH ARTICLE
Recombination Rate Heterogeneity within
Arabidopsis Disease Resistance Genes
Kyuha Choi1☯, Carsten Reinhard1☯, Heïdi Serra1, Piotr A. Ziolkowski1,2, Charles J. Underwood1,3, Xiaohui Zhao1, Thomas J. Hardcastle1, Nataliya E. Yelina1,
Catherine Griffin1, Matthew Jackson1, Christine Mézard4, Gil McVean5, Gregory P. Copenhaver6,7, Ian R. Henderson1*
1Department of Plant Sciences, Downing Street, University of Cambridge, Cambridge, United Kingdom, 2Department of Biotechnology, Adam Mickiewicz University, Poznan, Poland,3Watson School of Biological Sciences, Cold Spring Harbor Laboratory, Cold Spring Harbor, New York, United States of America,4Institut Jean-Pierre Bourgin, INRA, AgroParisTech, CNRS, Université Paris-Saclay, RD10, Versailles, France,5The Wellcome Trust Centre for Human Genetics, University of Oxford, Oxford, United Kingdom,6Department of Biology and the Integrative Program for Biological and Genome Sciences, University of North Carolina at Chapel Hill, Chapel Hill, North Carolina, United States of America,
7Lineberger Comprehensive Cancer Center, University of North Carolina School of Medicine, Chapel Hill, North Carolina, United States of America
☯These authors contributed equally to this work. *[email protected]
Abstract
Meiotic crossover frequency varies extensively along chromosomes and is typically con-centrated in hotspots. As recombination increases genetic diversity, hotspots are pre-dicted to occur at immunity genes, where variation may be beneficial. A major component of plant immunity is recognition of pathogen Avirulence (Avr) effectors by resistance (R) genes that encode LRR domain proteins. Therefore, we sought to test whether NBS-LRR genes would overlap with meiotic crossover hotspots using experimental genetics in
Arabidopsis thaliana. NBS-LRR genes tend to physically cluster in plant genomes; for example, in Arabidopsis most are located in large clusters on the south arms of chromo-somes 1 and 5. We experimentally mapped 1,439 crossovers within these clusters and observed NBS-LRR gene associated hotspots, which were also detected as historical hot-spots via analysis of linkage disequilibrium. However, we also observed NBS-LRR gene coldspots, which in some cases correlate with structural heterozygosity. To study recom-bination at the fine-scale we used high-throughput sequencing to analyze ~1,000 cross-overs within theRESISTANCE TO ALBUGO CANDIDA1(RAC1)Rgene hotspot. This revealed elevated intragenic crossovers, overlapping nucleosome-occupied exons that encode the TIR, NBS and LRR domains. The highestRAC1recombination frequency was promoter-proximal and overlapped CTT-repeat DNA sequence motifs, which have previ-ously been associated with plant crossover hotspots. Additionally, we show a significant influence of natural genetic variation on NBS-LRR cluster recombination rates, using crosses between Arabidopsis ecotypes. In conclusion, we show that a subset of NBS-LRR genes are strong hotspots, whereas others are coldspots. This reveals a complex recombination landscape in Arabidopsis NBS-LRR genes, which we propose results from a11111
OPEN ACCESS
Citation:Choi K, Reinhard C, Serra H, Ziolkowski PA, Underwood CJ, Zhao X, et al. (2016) Recombination Rate Heterogeneity within Arabidopsis Disease Resistance Genes. PLoS Genet 12(7): e1006179. doi:10.1371/journal.pgen.1006179
Editor:Richard Michelmore, UC Davis, UNITED STATES
Received:November 11, 2015
Accepted:June 15, 2016
Published:July 14, 2016
Copyright:© 2016 Choi et al. This is an open access article distributed under the terms of the
Creative Commons Attribution License, which permits unrestricted use, distribution, and reproduction in any medium, provided the original author and source are credited.
Data Availability Statement:The fastq sequence files for (i) the RAC crossover sequencing experiments and (ii) MNase-seq mapping of nucleosome positions are available from ArrayExpress (E-MTAB-4556). The fastq sequence files for the ColxLer F2 experiments are available from ArrayExpress (E-MTAB-4657). All other data are within the paper and its Supporting Information files.
varying coevolutionary pressures exerted by host-pathogen relationships, and is influ-enced by structural heterozygosity.
Author Summary
The majority of plants, animals and fungi reproduce sexually, which has a profound effect on patterns of genetic diversity. For sexual reproduction to occur a specialized cell division called meiosis generates gametes (sex cells) with recombined DNA. During meiosis homologous chromosomes undergo reciprocal exchange of genetic material called cross-over, which mixes parental sequences. Crossover frequency is highly variable along chro-mosomes and is typically concentrated in narrow regions called hotspots. Sexual
reproduction is proposed to provide a major advantage during host-pathogen coevolution. This theory predicts that crossover hotspots will be associated with genes that play impor-tant roles in the immune system, where diversity may be beneficial. To investigate this idea we mapped patterns of crossover frequency in relation to genes that plants use to rec-ognize pathogens. We observe that a subset ofArabidopsis thalianaresistance genes over-lap with strong crossover hotspots. However, we also observe resistance gene coldspots, which correlate with chromosomal rearrangements between varietal lines (ecotypes). Using Arabidopsis ecotypes we also show that natural genetic variation has a strong modi-fying effect on resistance gene cluster recombination rates. Together our work shows com-plex variation in resistance gene crossover patterns, which may relate to heterogeneity in coevolutionary pressures experienced at different loci, in addition to the effects of struc-tural genetic diversity.
Introduction
During meiosis, homologous chromosomes recombine via reciprocal exchanges of DNA, called crossovers [1,2]. Crossovers initiate from DNA double strand breaks that are repaired using an interhomolog pathway [1–3]. Meiotic recombination frequency is highly variable along chro-mosomes and is concentrated in narrow (1–2 kb) hotspots in plants, animals and fungi [4–7]. Hotspot locations and activity are controlled by both genetic and epigenetic factors [4–7]. The
“two-speed”genome hypothesis proposes that crossover hotspots will be differentially distrib-uted among immunity versus housekeeping genes, as the former participate directly in host-pathogen coevolution, where recombination and diversity may be beneficial [8–12]. Here we investigate this hypothesis by experimentally mapping patterns of meiotic crossover recombi-nation in relation to Arabidopsis NBS-LRR disease resistance genes.
The plant immune system consists of two major branches: (i) Pathogen Associated Molecu-lar Pattern (PAMP) Triggered Immunity (PTI) and (ii) Effector Triggered Immunity (ETI) [13–15]. PTI signaling recognizes conserved PAMPs shared by many pathogenic microbes, including flagellin and chitin, via the action of receptor-like kinases [15]. ETI signaling involves recognition of specific pathogen effectors (the products ofAvirulencegenes,Avr) by matching plant disease resistance genes (Rgenes) [13,14].Rgene products typically share combinations of domains including TIR (Toll, Interleukin-1 andRgenes), NBS (Nucleotide Binding Site) and LRR (Leucine Rich Repeats) [13,14,16,17]. R proteins can interact directly with pathogen Avirulence proteins (e.g. RRS1-R & Pop2 and L & AvrL567), or guard host targets and decoys (e.g. RPS2, RIN4 & AvrRpt2) [18–23]. Pathogen recognition by R proteins triggers
61403318. KC was funded by an EMBO long term postdoctoral fellowship ALTF 807-2009. PAZ was supported by a Polish Mobility Plus Fellowship 605/ MOB/2011/0. GPC is funded by a National Science Foundation Grant (MCB-1121563). The funders had no role in study design, data collection and analysis, decision to publish, or preparation of the manuscript.
hypersensitive cell death, in addition to systemic signaling that increases resistance in unin-fected tissues [13,14].Rgenes confer direct fitness benefits via resistance and tolerance to path-ogens [24–26]. However, there is a cost of resistance for growth [26,27], and positive and negative epistatic effects on plant fitness have been observed betweenRgene loci. For example, RPS4andRRS1function together and are genetically linked [28–31], and a small number ofR gene combinations can trigger autoimmune hybrid necrotic interactions [32–34].
Rgenes belong to large paralogous gene families, that show high levels of diversity within and between species [16,17,35,36]. For example, theArabidopsis thalianaNBS-LRR gene fam-ily consists of ~190–200 members, of which 30 have characterized resistance functions (R genes) (S1 Table) [16,35]. In this study we consider 197 genes in the NBS-LRR gene family (S1 Table). NBS-LRR genes show evidence of high historical recombination rates, inferred from patterns of linkage disequilibrium (LD) between single nucleotide polymorphisms (SNPs) [37– 40]. NBS-LRR genes also show the signatures of both directional and balancing selection [40– 46], with the latter thought to reflect negative frequency-dependent interactions [47], heterozy-gote advantage (overdominance) [48], or selection in diffuse or fluctuating environments [26]. Physical clustering of NBS-LRR genes along chromosomes is common and extensive experi-mental evidence for recombination exists, including the signatures of non-allelic gene conver-sion and unequal crossover [16,49–59]. This includes demonstration that unequal crossing-over within the maizeRp1cluster can generate novel resistance specificities not present in either parent [54].
Relatively little is known about variation in fine-scale crossover frequency betweenRgenes. We therefore sought to use experimental genetics to measure meiotic crossovers associated with the Arabidopsis NBS-LRR gene family. We observe strong crossover hotspots in a subset of NBS-LRR genes. However, we also observe significant NBS-LRR gene coldspots, which in some cases associate with structural heterozygosity. We mapped fine-scale crossover patterns within theRESISTANCE TO ALBUGO CANDIDA1(RAC1)Rgene hotspot, which confers resistance against oomycete pathogens [60–62].RAC1intragenic recombination was found to overlap exons encoding the TIR, NBS and LRR domains. HighestRAC1crossover frequency occurs adjacent to the promoter and overlaps hotspot-associated CTT-repeat DNA sequence motifs [37,63,64]. Using a crossover assay based on flow cytometry of fluorescent pollen, which allows>10,000s post-meiotic gametes to be scored per individual [65–67], we show significant modification of NBS-LRR cluster recombination rate by genetic background. Using Southern blots we present data on NBS-LRR gene structural variation between ecotypes and relate this to patterns of crossover frequency. Together these analyses reveal heterogeneity inRgene cross-over frequency and show how natural variation modifies NBS-LRR cluster recombination.
Results
Mapping crossover frequency within the Arabidopsis NBS-LRR gene
clusters
NBS-LRR genes frequently cluster in plant genomes [16]. For example, the majority of the Ara-bidopsis NBS-LRR domain gene family (114/197) are located in clusters on the south arms of chromosomes 1 and 5 (Fig 1andS1 Table), which also correspond to regions of disrupted syn-teny betweenA.thalianaandA.lyratachromosomes [16,36]. We constructed phylogenies using NBS domain amino acid sequences and compared the resulting trees to the physical loca-tion of NBS-LRR genes on chromosomes 1 and 5 (Fig 1C and 1D). This indicated that both tandem and dispersed NBS-LRR gene duplications contribute to cluster organization, consis-tent with previous analyses [16,36]. To map crossovers experimentally at high resolution within the clusters we designed a double-selection strategy (Fig 1A). This utilizes Syngenta
Fig 1. Meiotic recombination hotspots and coldspots withinMAJOR RESISTANCE CLUSTER1and
Arabidopsis Insertion Library (SAIL) T-DNA insertions that confer glufosinate resistance in the Columbia (Col) accession, hereafter namedBAR(Basta Resistant) lines [68], and Singapore Gene Trap (SGT)Dsinsertions that confer kanamycin resistance in the Landsbergerecta(Ler) accession, hereafter namedKAN(Kanamycin Resistant) lines (Fig 1A and 1B) [68,69]. Single copyKANandBARinsertions that flank the NBS-LRR clusters on chromosomes 1 and 5 were identified using Southern blotting and genetic analysis (Figs1andS1).KAN-BARinsertion pairs used for crossover double-selection define theMAJOR RESISTANCE CLUSTER1(MRC1, 3.87 Mb, SGT_5517 and SAIL_148_D06) andMAJOR RESISTANCE CLUSTER5(MRC5, 4.69 Mb, SAIL_309_G06 and SGT_5183) map regions (Fig 1AandS2andS3Tables).
PairedMRC KAN-BARinsertions were crossed to generate double kanamycin-glufosinate resistant F1trans-hemizygotes, which were then backcrossed as males to wild type Col females
(Fig 1A). Backcross progeny were grown on kanamycin-glufosinate media and the ratio of dou-ble-resistant to sensitive individuals was used to measure genetic distances, according to the for-mula cM = 100×(2×(NKB/Ntotal)) (Fig 1AandTable 1), where NKBis the number of
kanamycin-glufosinate double-resistant progeny and Ntotalis the total number of progeny screened.
Geno-typing of double-resistant individuals with Col/Ler Simple Sequence Length Polymorphisms (SSLP) markers was used to confirm that they had experienced a crossover within the selected MRCregion (Fig 1BandS2andS3Tables). Average recombination rates within theMRC regions were comparable to the male Col/Ler genome average 4.82 cM/Mb (MRC15.89 cM/Mb, MRC54.18 cM/Mb) (Table 1andS2andS3Tables) [71]. To analyze fine-scale recombination patterns within theMRCregions a subset of the double-selectedMRC1(n =725) andMRC5 (n =714) recombinant individuals were chosen for further analysis by internal genotyping (Fig 1andS2andS3Tables). Double-resistant crossover progeny were genotyped for 93 and 90 dCAPs marker is shown beneath [70]. Colored stars above the genotyped samples match the chromosome diagrams above.(C-D)Phylogenetic trees generated using NBS domain amino acid sequences are plotted, with branch tips connected to the corresponding gene physical location.(E-F)Physical maps of chromosomes 1 and 5 with red dots indicating NBS-LRR gene positions (S1 Table). The selectedMRCregions are indicated by black vertical lines andKANandBARsymbols.(G-H)Recombination rate (cM/Mb) throughout the genotypedMRC1
andMRC5regions (S2andS3Tables). Red x-axis ticks indicate NBS-LRR gene positions (S1 Table). The dotted horizontal line indicates the male Col/Ler chromosome average recombination rate [71]. TheRPP8and
RPS6coldspot locations are indicated beneath theMRC5map.(I)Crossover frequency within theHRG1hotspot interval (S4 Table). Arrows represent genes, with theRgene highlighted in red.(J)As for (I) but forHRG2/HRG3
(S5 Table).(K-L)Historical recombination rates acrossHRG1andHRG2/HRG3. Crossover frequency (cM/Mb) estimates (LDhat) from 80 Eurasian and 180 Swedish accessions are shown in blue and red respectively [72– 74]. X-axis ticks indicate SNP positions used for analysis. Horizontal dotted lines indicate chromosome mean historical recombination values. Arrows represent genes, with the NBS-LRR genes highlighted in red.
doi:10.1371/journal.pgen.1006179.g001
Table 1. Double-selection ofMRC1andMRC5crossovers.KAN-BARF1trans-hemizygotes were
back-crossed to Col wild type female flowers and progeny were double-selected for kanamycin and glufosinate resistance. The numbers of double-resistant versus sensitive backcross seedlings are listed. The physical distances (megabase, Mb) were calculated between theKANandBARinsertion sites relative to the TAIR10 Col reference assembly [75]. Genetic distance (cM) is calculated as 100×(2×(NKB/Ntotal)), where NKBis the
number of Kan-Bar double-resistant backcross progeny and Ntotalis the total number of backcross progeny
screened (Double-Resistant+Sensitive).
MRC1 MRC5
Double-Resistant 1,028 947
Sensitive 7,988 8,716
Total 9,016 9,663
cM 22.80 19.60
Mb 3.87 4.69
cM/Mb 5.89 4.18
doi:10.1371/journal.pgen.1006179.t001
Col/Ler SNPs within the clusters to identifyMRC1andMRC5marker intervals containing crossovers, with a mean inter-marker distance of 46.5 kb (Fig 1andS2andS3Tables). Analysis of crossover patterns in theMRCmaps revealed intervals with both significantly higher and lower crossovers than expected if random (MRC1,X2=441.45 d.f. = 93P=<2.2×10⁻¹⁶;MRC5, X2=337.29 d.f. = 90P=<2.2×10⁻¹⁶), including intervals containingRgenes (Fig 1andS2and S3Tables).
NBS-LRR gene hotspots and coldspots within
MRC1
and
MRC5
TheMRC1interval with the highest recombination contains a functionally uncharacterized TIR-NBS-LRR gene (At1g65850), which for the purposes of this study we designateHOT R
GENE1(HRG1) (Fig 1GandS2 Table).HRG1shares high sequence identity withRPP1and
DM2, which confer resistance toHylaperonospora parasiticaand cause hybrid necrosis respec-tively [32,76]. TheHRG1map interval contained 18 crossovers, which we fine-mapped by gen-otyping using derived Cleaved Amplified Polymorphisms (dCAPs) markers (Fig 1I) [70]. We observed a concentration of crossovers (14 of 18) withinHRG1, with a peak recombination rate of 182.87 cM/Mb (Fig 1IandS4 Table), compared to the male Col/Ler genome average of 4.82 cM/Mb [71]. Similarly, the interval inMRC5with highest crossover frequency contains a tandem pair of TIR-NBS-LRR genes (At5g46260 and At5g46270), which we designateHOT R
GENE2(HRG2) andHOT R GENE3(HRG3) (Fig 1HandS3 Table).HRG2andHRG3are also
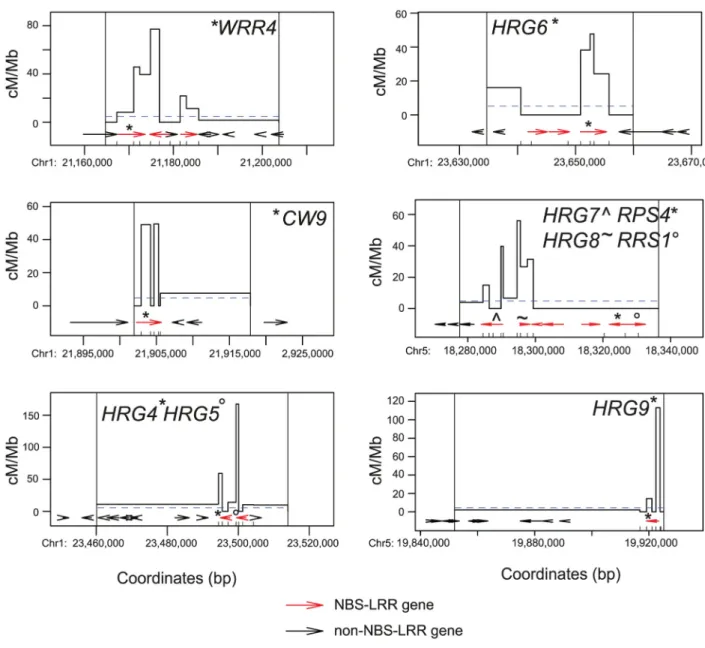
functionally uncharacterized, but show high sequence similarity withRPS6andRAC1, which confer resistance toPseudomonas syringaeandAlbugo candidarespectively [60,77]. Fine-map-ping crossovers using additional dCAPs markers again revealed crossovers concentrated within theHRG2andHRG3NBS-LRR genes (11 of 11 crossovers) (Fig 1JandS5 Table). We fine-mapped crossovers in six additional high recombination intervals inMRC1andMRC5that contained NBS-LRR genes (Fig 2). We observed enrichment of crossovers within NBS-LRR genes in all cases (WRR4,CW9,HRG4,HRG5,HRG6,HRG7,HRG8andHRG9) (Fig 2andS6– S11Tables). Recombination rates observed at theMRCNBS-LRR hotspots were comparable to characterized plant hotspots and were detected at singleton, tandemly duplicated and complex NBS-LRR loci (Fig 2andS4–S12Tables).
To test forMRCintervals with significantly different crossover rates, we constructed 2×2 contingency tables and performedX2tests using the observed crossover and non-recombinant counts, and those expected at random based on the physical size of each interval. Finally, we applied a false discovery correction, due to multiple testing [78]. Out of 185 intervals inMRC1 andMRC5, 22 were significantly different from the null expectation (S2andS3Tables). Ten intervals showed higher recombination, which includedHRG1,HRG2,HRG3,HRG4and HRG5(S2andS3Tables). Twelve intervals showed lower recombination, which included inter-vals containingRRS1B-RPS4B, theRPS6cluster and a cluster of 4 uncharacterized
CC-NBS-LRR genes (At1g58807, At1g58848, At1g59124 and At1g59218) (S2andS3Tables). However, after correction for multiple testing, onlyHRG1and the CC-NBS-LRR cluster remained significantly different (S2andS3Tables) [78]. To test whether intervals containing NBS-LRR genes showed different recombination rates compared to those that did not, we com-pared observed crossover counts to those expected at random in proportion to physical dis-tance, using aX2test.MRCintervals that contained NBS-LRR genes did not have significantly different crossover counts compared to those that lacked NBS-LRR genes (P= 0.418).
As a further test of recombination in NBS-LRR genes compared to other genes, we analyzed 1,230 crossovers mapped throughout the genome by genotyping-by-sequencing of 192 Col×Ler F2individuals (S13 Table) [79,80]. The crossovers were mapped to a mean resolution of 947
(Block-bootstrap Z = 4.54,P= 2.77×10⁻⁶). To compare gene groups we sampled from the non-NBS-LRR genes using parameters that approximated the clustering structure of the non-NBS-LRR genes (S2A and S2B Fig). We repeatedly sampled and tested for overlap between samplings and crossovers, requiring at least one base pair in common to score an overlap. Values were also length-normalized by rescaling the observed data by the total length in base pairs of the sample or gene set (S3C–S3F Fig). For both NBS-LRR and non-NBS-LRR genes the observed proportion of genes overlapping a crossover lie within those observed for the sampled data, usually near the distribution’s center (S3C–S3F Fig). Therefore we conclude that the number of Fig 2. Fine-mappingMRCNBS-LRR gene crossover hotspots.Crossover frequency (cM/Mb) in high recombinationMRCintervals containing NBS-LRR genes (S6–S11Tables). Internal dCAPs marker positions are indicated by x-axis ticks, in addition to whether the region is located inMRC1(Chr1) orMRC5(Chr5). NBS-LRR genes are indicated by red arrows and non-NBS-LRR genes by black arrows. The chromosome average recombination rate for Col×Ler male backcrosses is indicated by horizontal, dotted blue lines [71]. Vertical black lines indicate the location of SNP markers genotyped inMRCmaps (S2andS3Tables). NBS-LRR domain gene names are printed within the plot and symbols used to indicate which gene arrows they correspond to.
doi:10.1371/journal.pgen.1006179.g002
NBS-LRR and non-NBS-LRR genes overlapping crossovers is not substantially different, and that both groups show the presence of hotspots and coldspots.
If recombination hotspots within NBS-LRR genes have persisted in the species, then decay of linkage disequilibrium (LD) between natural genetic polymorphisms is expected [81,82]. For example, the presence of all four possible gametes for pairs of linked polymorphisms (i.e. AB, aB, Ab and ab) can be used as a measure of historical recombination [81,82]. We therefore ana-lyzed single nucleotide polymorphisms (SNPs) from 80 Eurasian and 180 Swedish Arabidopsis accessions using LDhat [72–74]. Consistent with our experimental crossover measurements HRG1,HRG2andHRG3show elevated historical recombination (Fig 1K and 1L) [72–74]. We also observed intervals containingRgenes, likeRPP8, with low experimental recombination, but which exhibited high historical recombination frequency (Fig 1HandS1–S3Tables). The suppressive effect of structural polymorphism on recombination is likely to contribute to these patterns. For example,RPP8is tandemly duplicated in Ler relative to Col [50], and theRPS6 cluster shows complex Col/Ler structural polymorphism [77]. In summary, although overall MRCrecombination rates were close to the genome average, we observed heterogeneity in local crossover frequency and the presence of NBS-LRR gene associated hotspots and coldspots.
Intragenic recombination hotspots in the
RAC1
resistance gene
To investigate crossover variation within a singleRgene we used pollen-typing [37,83,84], which is analogous to mammalian sperm-typing approaches [85,86]. This technique uses two rounds of nested, allele-specific PCR to specifically amplify and titrate either crossover or parental (non-recombinant) molecules from F1(e.g. Col/Ler) pollen DNA (Fig 3AandS3 Fig).
Importantly, crossover products are not amplified from Col/Ler F1somatic leaf DNA under
the same PCR conditions (Fig 3A). This demonstrates that template switching is not generating crossover molecules during PCR amplification. The concentrations of parental and crossover molecules, measured by titration, are used to calculate recombination rate within the amplified region [37,83–85]. Amplification from single molecules containing crossovers, followed by Sanger sequencing, is used to identify internal recombination locations, to the resolution of individual polymorphisms (Fig 3A) [37,83,84]. Between 100–200 crossover molecules are Sanger sequenced to map the topology of recombination within an amplified region and calcu-late crossover frequency (cM/Mb) for each marker interval (Fig 3A) [37,80,83,84]. Physical dis-tances analyzed by pollen-typing are typically between 5–10 kb [37,80,83,84].
To select candidate hotspotRgenes for pollen-typing analysis we analyzed historical recom-bination rates [37,72–74]. We used LDhat to analyse SNPs from 80 Eurasian and 180 Swedish Arabidopsis accessions [72,73], and observed thatRPP8andRAC1are theRgenes with highest LD-based recombination estimates (S1 Table). However, theRPP8locus shows structural poly-morphism between accessions, including between Col and Ler, making it unsuitable for pollen-typing analysis [50]. In contrast,RAC1is present as a TIR-NBS-LRR singleton in both Col and Ler and so was selected for further study.RAC1alleles confer resistance toHyaloperonospora
arabidopsidisandAlbugo candidaand shows high sequence identity withHRG2,HRG3and
Fig 3. Intragenic crossover hotspots within theRAC1resistance gene. (A)Diagram illustrating pollen-typing methods used to fine-map plant crossover hotspots. Pollen is collected from Col/Ler F1plants and
genomic DNA is used for two rounds of nested allele-specific PCR amplifications with either crossover (ASO-Ler+ASO-Col) or parental (ASO-Col+ASO-Col) allele-specific oligonucleotide (ASO) primer
the 5' exons that encode the TIR and NBS domains, and in a 3'-region encoding LRR domains (Fig 3C). This pattern is consistent with high intragenic recombination rates observed at the 5' and 3' ends of plant genes [37,63,64,87]. In this regard it is important to note that residues criti-cal for resistance function have been mapped to all three domains (TIR, NBS and LRR) in otherRgenes [58,88–91]. The open reading frame of the adjacent gene At1g31550 also showed substantial crossovers (Fig 3C). Together these data demonstrate thatRAC1contains strong historical and contemporary crossover hotspots.
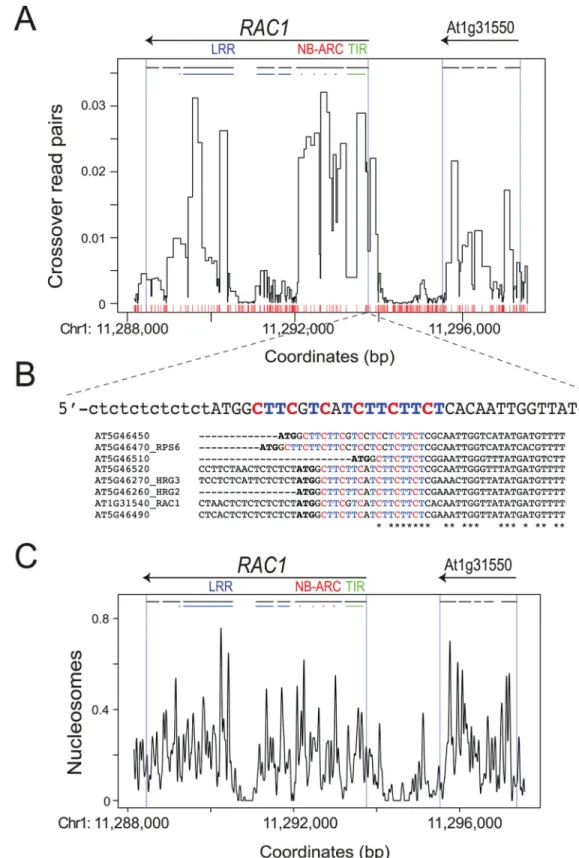
To analyze greater number of recombination events, we mass-amplified approximately 1,000RAC1crossover molecules using 672 independent PCR reactions (Fig 3A). Each reaction was estimated to contain between 1 and 2 crossover templates, based on our previous titration experiments (S14 Table). The resulting crossover amplification products were then pooled, sonicated and used to generate sequencing libraries (Fig 3A). Paired-end sequencing was per-formed and read pairs were separated and aligned to the Col and Ler parentalRAC1templates, allowing only exact matches (S16 Table). Reads were filtered for those that aligned to one par-ent only, and for pairs with a cpar-entromere-proximal read mapping to Col and a cpar-entromere-dis- centromere-dis-tal read mapping to Ler, on opposite strands (S16 Table). Read pairs matching these criteria are consistent with the crossover allele-specific oligonucleotide (ASO) configuration used during PCR amplification (Fig 3A). These filters yielded 182,909 total crossover read pairs (S16 Table). We assigned recombination values to marker intervals between crossover read pairs, weighted by the number of intervals and their widths, and normalized by the total number of mapping reads (Fig 4A). This revealed a similar recombination pattern to that observed from single molecule Sanger sequencing, with high recombination overlapping theRAC1TIR, NB-ARC and LRR domain exons (Figs3Cand4A). Crossover read pair analysis also con-firmed substantial recombination activity within the adjacent gene At1g31550 (Fig 4A). Together these data demonstrate focused intragenic recombination inRAC1overlapping exon sequences [60–62].
We investigated the extent to which chromatin and DNA sequences associate with cross-over frequency at theRAC1hotspot. Previous studies have identified degenerate CTT and CCN repeat motifs associated with Arabidopsis hotspots, enriched at the 50-end of genes [37,63,64]. We observed a CTT-motif (CTTCGTCATCTTCTTCT) almost immediately down-stream of theRAC1start codon, within the TIR-domain encoding exon that shows high recom-bination rate (Fig 4A and 4B). CTT-motifs are also observed inRAC1-related NBS-LRR genes (Fig 4B). To investigate association of CTT-motifs with recombination we divided NBS-LRR genes located within theMRCmaps into those in intervals with higher or lower crossover fre-quency, compared to the male Col×Ler genome average (4.82 cM/Mb) [71]. 62% (21 of 34) of high recombination NBS-LRR genes showed at least one match to a 16-mer CTT-repeat motif Col/Ler F1pollen, which are not observed when using Col/Ler F1leaf (somatic) DNA as a template.
Crossover positions are identified using either Sanger sequencing from single crossover molecule amplifications, or paired-end sequencing of crossover molecule libraries.(B)Historical crossover frequency overRAC1estimated by LDhat analysis of polymorphisms from 80 Eurasian (blue) and 180 Swedish (red) accessions [72,73]. X-axis ticks indicate SNP positions used for analysis. Horizontal dotted lines indicate chromosome mean values. Black arrows represent genes and green horizontal lines indicate transposable elements. Black vertical lines indicateRAC1TSS and TTS positions.(C)Crossover frequency within the
RAC1amplicon measured by crossover and parental molecule titration, followed by single crossover molecule Sanger sequencing. The positions ofRAC1and the adjacent gene (At1g31550) are indicated by horizontal black arrows above the plot. Exons are indicated by horizontal black lines, with sequences encoding RAC1 TIR (green), NB-ARC (red) and LRR (blue) domains highlighted as coloured lines. For the NB-ARC domain, the position of the Walker A, Walker B, ARC1 and ARC2 motifs are shown. Red x-axis ticks show Col/Ler SNP positions. Blue vertical lines indicate the positions of gene TSS and TTS from TAIR10 representative gene models.
Fig 4.RAC1crossovers measured by high-throughput sequencing, nucleosome occupancy and CTT-repeat motifs. (A)Normalized crossover read pair values are plotted relative to the TAIR10 reference sequence, with the position of Col/Ler polymorphisms indicated by red x-axis ticks. Labelling is as forFig 3C.(B)The sequence of theRAC1CTT-repeat motif is printed and connected to its physical location in (A) with dashed lines. Note the sequence is the reverse complement relative to the orientation of plotting in (A). The presence of
that we previously identified as enriched at historical crossover hotspots (S17 Table) [37]. In contrast, significantly fewer (33%, 16 of 49) low recombination NBS-LRR genes showed matches to this CTT-motif (S17 Table) (X2P= 0.016). This analysis further demonstrates asso-ciation between high crossover recombination and CTT-repeat motifs in Arabidopsis
[37,39,63,64]. To analyse chromatin structure we performed micrococcal nuclease digestion of wild type (Col-0) chromatin and gel purified the resulting ~150 bp mononucleosomal DNA band [92]. This DNA was used to generate a library and paired-end sequencing performed, fol-lowed by analysis using the nucleR package [93]. We observed that intergenic regions within the pollen typing amplicon, andRAC1intron 4, showed relatively low nucleosome occupancy (Fig 4C) [92]. Highest crossover rates correlated with nucleosome-occupied exon sequences withinRAC1and At1g31550 (Fig 4A and 4C). Together these analyses demonstrate associa-tions betweenRAC1crossover frequency, DNA sequence motifs and chromatin structure.
R
gene structural variation and crossover modification by genetic
background
TheHRG1,HRG2-HRG3andRAC1NBS-LRR hotspots show historical and experimental recombination rates above the genome average (Figs1,3,S4,S5,S14andS15Tables), whereas otherRgenes differed between these two measures. For example,RPP8shows high historical recombination, yet low experimental crossover frequency (Fig 1HandS3 Table).RPP8is a sin-gletonRgene in the Col reference genome, but in Ler occurs as a tandemly duplicated pair
withRPH8A[50]. Sequence analysis indicates that the ColRPP8haplotype is derived from a
gene fusion event betweenRPP8andRPH8A[50]. We performed Southern blotting and hybridization analysis and confirmed theRPP8/RPH8ACol/Ler structural polymorphism (Fig 5A) [50]. The observed band sizes are also consistent with a recent Ler genome assembly gener-ated by PacificBiosystems (Fig 5B) [94]. Hence, lowRPP8recombination in the Col/LerMRC5 map may be explained due to structural heterozygosity inhibiting crossovers [95,96]. Similarly, theRPS6cluster shows structural polymorphism between Col and Ler and an absence of cross-overs inMRC5, despite showing high sequence similarity to the hotspotRgenesRAC1,HRG2 andHRG3(Figs1H,5C and 5DandS3 Table) [77]. In contrast the hotspotRgenesHRG1, HRG2,HRG3andRAC1show low levels of structural polymorphism between accessions, including between Col and Ler (Figs5C and 5DandS4). For theRgenesRPP1andRPP4 Southern blotting and hybridization analysis revealed complex patterns of structural polymor-phism that did not obviously correspond to the PacBio Ler assembly (S5andS6Figs) [94]. Hence, for theseRgenes structural polymorphism is also likely to be inhibitory to recombina-tion, when divergent haplotypes are heterozygous.
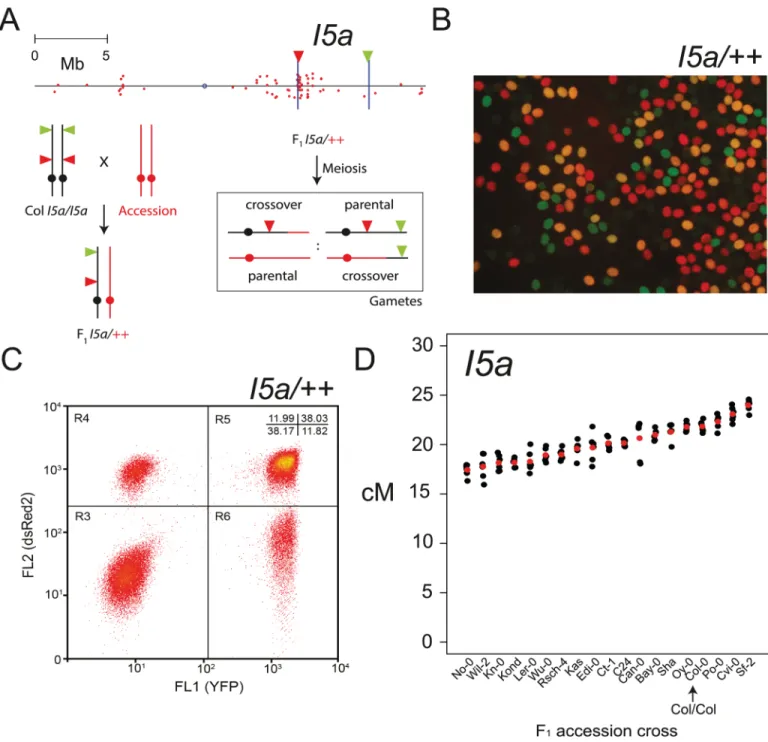
To investigate the extent of inter-cross variation in NBS-LRR cluster recombination we used segregation of linked Fluorescent Tagged Line (FTL) T-DNA insertions [67,97]. Inheri-tance of FTLs in pollen can be monitored via fluorescence microscopy or flow cytometry (Fig 6A) [67,97]. Pollen grains collected from FTL/++ hemizygotes consists of four fluorescent clas-ses that represent parental (no color and red+yellow) versus crossover recombinant (red or yel-low alone) chromosomes (Fig 6B). The ratios between these fluorescent pollen classes are used to calculate genetic distance between the FTL T-DNA insertions (Fig 6A and 6B) [66,67,97]. Pollen fluorescence was analyzed using a flow cytometer allowing>10,000s of pollen grains to be scored per individual plant (Fig 6CandS18 Table) [67]. We used FTL lines that define a motifs inRAC1-related paralogs in the Col-0 accession are shown in a multiple sequence alignment, where gene start codons (ATG) are in bold type. The asterisks beneath the alignment indicate identical positions.(C) Normalized nucleosome occupancy values (MNase-seq) plotted as for (A).
4.92 Mb interval calledI5a, which has a 2.09 Mb overlap with theMRC5region and contains 33 out of 70 chromosome 5 NBS-LRR genes (Fig 6AandS1 Table). We crossedI5a(generated in the Col-0 background) to 18 Arabidopsis accessions representing global diversity and mea-sured genetic distance in replicate F1plants, scoring ~30,000 pollen grains per individual (Fig 6
Fig 5. NBS-LRR gene structural diversity between Arabidopsis accessions. (A)Southern blotting and hybridization analysis ofRPP8in the indicated accessions. Cross-hybridizing NBS-LRR genes in Col-0 predicted from the TAIR10 reference assembly are labelled in black. In Col-0RPP8
is detected as a 4.3 kbEcoRV band, and two 5.5 and 6.1 kb bands in Ler-0. Bands corresponding to Ler-0RPP8andRPPH8Agenes are labelled in blue.(B)Diagram showing annotated structural variation atRPP8between Col-0 (TAIR10) and Ler-0 (PacBio) assemblies [94]. Regions predicted to cross-hybridize with the probe are indicated in red, in addition to the position ofEcoRV sites.(C)and(D)are as for (A) and (B), but probing forRAC1. TheRAC1probe cross-hybridizes with a linked cluster of NBS-LRR genes, includingRPS6. In Col-0 theRPS6cluster includes three NBS-LRR genes (At5g46490, At5g46510, At5g46520) that are present as a single gene (At5g46490) in Ler-0; such that in Col-0 three bands of 3.7, 4.5 and 4.7 kb are detected afterEcoRV andHindIII digestion, and one 2.8 kb band in Ler-0. The Ler-0 band is labelled in blue.
doi:10.1371/journal.pgen.1006179.g005
Fig 6. NBS-LRR cluster recombination rate is modified by natural genetic variation. (A)Physical map of chromosome 5 with NBS-LRR gene positions indicated by red dots. The positions of FTL T-DNAs that defineI5aare indicated by vertical blue lines, with triangles indicating the colour (red or yellow) of fluorescent protein encoded. Beneath is a diagram illustrating the generation of FTL hemizygous F1plants and scoring of crossover
recombination in pollen. Crossover withinI5aleads to pollen with red or yellow fluorescence alone, whereas the parental classes are either without fluorescence or show both red and yellow.(B)Fluorescence micrograph of pollen fromI5a/++hemizygotes, showing the presence of four fluorescent classes.(C)A representative flow cytometry plot of pollen fromI5a/++hemizygotes. Points represent individual pollen grains measured for yellow (FL1 YFP) and red (FL2 dsRed2) fluorescence.(D)I5agenetic distance (cM) measured from individual F1plants (S18 Table). Mean values are shown
in red. The accession crossed to is indicated on the x-axis. The Col/Col homozygous sample is labelled and indicated with an arrow.
andS18 Table). We observed 3 F1crosses with significantly higherI5arecombination and 15
F1crosses with significantly lowerI5arecombination, relative to Col/Col homozygotes (general
linearized modelP<2.0×10⁻¹⁶) (Fig 6DandS18 Table). This demonstrates the sensitivity of NBS-LRR cluster recombination rates to genetic background, which is consistent with observed
cisandtransmodification of crossover frequency by natural genetic variation in plants [97–
105]. Therefore, Arabidopsis genetic variation has a significant modifying effect on crossover frequency within the NBS-LRR clusters.
Discussion
The‘two-speed’genome hypothesis predicts recombination hotspots associated with disease resistance genes, due to the beneficial effects of diversity during pathogen coevolution [8–11]. Consistent with this we observed a subset of strongRgene hotspots. For example,RAC1shows high historical and contemporary crossover frequency, comparable to known plant hotspots (S12 Table). However, not all NBS-LRR genes are hotspots and a substantial number of cold-spots were observed. ColdspotRgenes in theMRCmaps correlated with structural heterozy-gosity in some cases, for example,RPS6andRPP8. Heterogeneity between NBS-LRR genes is well documented in (i) patterns of sequence diversity and evolutionary history [44,107], (ii) the degree of sequence exchange observed between paralogs [57,59,106,107], (iii) direct versus indirect modes of effector recognition [13,20] and (iv) the extent of gene clustering [108]. Here we additionally demonstrate heterogeneity in Arabidopsis NBS-LRR gene meiotic recombina-tion rates. The ecology, generarecombina-tion time and effector complement of a given pathogen will interact to determine the selection pressures on NBS-LRR genes. It is also important to con-sider that domains required for recognition versus downstream resistance signaling within a single NBS-LRR gene may be under distinct forms of selection, e.g. diversifying versus purify-ing. Hence, for a givenR-Avrinteraction, higher or lower recombination rates, at varying scales, may be beneficial. Relevant to these considerations is the degree of outcrossing in Arabi-dopsis, which is estimated between 1–3% [39,109]. For example, genotyping of local stands of Arabidopsis in Germany detected clear evidence for recent outcrossing and heterozygosity [110]. The rapid decay of LD in Arabidopsis also indicates significant levels of historical out-crossing [39,72,73,111].
We observed pronounced intragenic variation inRAC1crossover frequency, with TIR, NB-ARC and LRR encoding exons showing high recombination. It is important to note that all three domains have been shown to control resistance specificity and sensitivity in otherR genes [88–91]. We propose that intragenic recombination patterns can be selected through a combination of sequence and epigenetic determinants. For example, CTT and CCN repeat sequence motifs associate with high recombination in Arabidopsis [37,63,64]. Similarly, we observed that CTT-motifs were enriched in high recombination NBS-LRR genes located in the MRCmaps. These motifs co-localize with the +1 H2A.Z histone variant-containing nucleo-some and also significantly overlap with historical and experimental recombination [37,63,64]. CTT/CCN motifs bear similarity to C-rich motifs bound by mammalian PRDM9 proteins, which determine hotspot locations via histone H3K4me3[112–117]. However, no clear homo-log of PRDM9 exists in plants, and so CTT/CCN repeat motifs likely function via a different mechanism [7]. Association of high recombination and AT-rich sequences upstream of tran-scriptional start sites is also observed in Arabidopsis, which correlates with regions of low nucleosome occupancy [37,39,63,64]. Hence, Arabidopsis hotspot-associated DNA sequence motifs may function directly to recruit recombination-promoting factors, or alter chromatin and thereby influence accessibility of recombination factors. Extensive evidence exists forcis
andtransacting genetic modifiers of meiotic recombination in plants, which also have the
potential to influenceRgene crossovers [97–105]. The location ofRgenes along the chromo-some is also likely to be a significant factor, as recombination rate shows broad scale variation, in addition to sex-specific patterns in the sub-telomeric regions [37,71,103,118].
Varying recombination rates within and betweenRgenes has important consequences for the generation of recognition diversity, as gene conversion and unequal crossover have been associated with changes toRgene structure and function [16,49–59]. Heritable gene conver-sion events occur during meiosis and are associated with both crossover and non-crossover DNA double strand break repair [119,120]. Extensive NBS-LRR sequence analysis indicates gene conversion events within and betweenRparalogs, which are associated withAvr recogni-tion differences. For example, in the tomatoCf-4/9andCf-2/5clusters [49,121], the riceXa21 cluster [122], the lettuceDm3cluster [51,123], the ArabidopsisRPP8andRPP5genes
[50,52,53,106] and the FlaxMandNloci [59,124]. Hence, higher recombination rates are likely to promote generation of functional allelic diversity via associated gene conversion events. Unequal crossovers contribute to changes inRgene resistance function by fusing, duplicating or deleting genes, or clusters of genes [49,51,53,54,56,59,125]. This is believed to occur due to misalignment of related, but non-allelic, sequences during strand invasion, followed by cross-over recombination. Unequal recombination has been directly observed between the tomato Cf4andCf9genes, which encode membrane bound LRR-repeat proteins that control resistance
toCladosporium fulvum[49,121,126]. Interestingly, increased levels of unequal recombination
were detected inCf-4/Cf-9heterozygotes compared withCf-9/Cf-9homozygotes, suggesting that polymorphism can promote this type of recombination [49]. Similar testcrosses were per-formed with the maizeRp1cluster, which confers resistance againstPuccinia sorghi, and signif-icant levels of crossover-associated resistance change were observed using both heterozygotes
(Rp1-J1/Rp1-J3) and homozygotes (Rp1G/Rp1G) [54–56,127]. Finally, the lettuceDm3cluster
that confers resistance againstBremia lactucaewas found to show low recombination rates, though deletions associated with crossovers were observed [51].
Besides unequal recombination, canonical crossovers withinRgenes have the potential to generate new resistance functions, as amino acids controlling recognition specificity or signal-ing are known to occur in TIR, NBS and LRR protein domains [13,58,88–91,128]. AsRgenes tend to cluster, crossovers within these clusters can also generate or break beneficial resistance haplotypes, for example when linkedRgene alleles function together [28–31]. High recombi-nation rates are predicted to lead to high levels of structural diversity. However, we demon-strate that theRAC1resistance gene shows high recombination, yet occurs as a singleton TIR-NBS-LRR gene in all Arabidopsis ecotypes tested. In flax theLresistance gene is similar to RAC1in showing stability as a singleton TIR-NBS-LRR gene in all backgrounds, but with a high diversity of resistance alleles [57].RAC1andLare both closely related to complex, tan-demly duplicated loci that includeRPS6andMrespectively [57,59,60,77]. Hence, it will be interesting to further define how contrasting patterns of sequence diversity are maintained at relatedRgene loci and how this relates to meiotic recombination.
basidiomycete fungusUstilago maydisgenome contains clustered genes encoding secreted vir-ulence proteins that are transcriptionally induced during infection [11]. Similarly, the human pathogensTrypanosoma bruceiandPlasmodium falciparumshow sub-telomeric clustering of variant surface glycoproteins [133,134]. We speculate that coevolutionary dynamics drive mir-rored changes in host and pathogen genomes and clustering of selected genes. It will be impor-tant to further explore inter-relationships between recombination, selection and plant-pathogen ecologies and how they influence diversity and gene organization at host resistance and pathogen effector loci.
Materials and Methods
NBS-LRR gene identification and analysis
We combined published annotations of the Arabidopsis NBS-LRR family with our own man-ual searches and selected a set of 197 genes for analysis (S1 Table) [16,35]. To analyse phyloge-netic relationships NBS domain amino acid sequences were aligned using ClustalOmega and gaps treated as missing data. The resulting alignment was analysed using the PhyML 3.0 web-server (http://www.atgc-montpellier.fr/phyml/) with 500 bootstraps performed for tree con-struction [135]. To search for CTT-repeat motifs associated with NBS-LRR genes, a position weight matrix from a historical hotspot-enriched motif was matched at 80% to 1 kb windows surrounding NBS-LRR gene transcriptional start sites (TSSs).
Double-selection and analysis of
MRC1
and
MRC5
crossovers
To select for crossovers with the NBS-LRR gene clusters we followed an identical strategy to that used previously for theTEL1interval (Fig 1A) [37]. SAIL T-DNA insertions conferring glufosinate resistance in the Col accession (hereafter namedBAR), andDsinsertions conferring kanamycin resistance in the Ler accession (hereafter namedKAN), were chosen with insertion sites flanking the NBS-LRR gene clusters on the south arms of chromosomes 1 and 5 [68,69]. Southern blotting and hybridization was used to identify single copyKANandBARinsertion lines (S1 Fig). Single copy lines were tested that (i) self-fertilization of homozygotes gave ~100% resistant progeny, (ii) self-fertilization of hemizygotes gave ~75% resistant progeny and (iii) backcrossing hemizygotes to wild type gave ~50% resistant progeny (S1 Fig). After screen-ing we selected SGT_5517 (KAN) and SAIL_148_D06 (BAR) for chromosome 1 and
SAIL_309_G06 (BAR) At5g49220 and SGT_5183 (KAN) for chromosome 5.KANandBAR lines were then crossed to generatetrans-hemizygote F1individuals, which were backcrossed
as males to Col-0 (Table 1). Backcross progeny were germinated on media containing kanamy-cin and glufosinate to select for individuals that experienced a crossover between theKANand BARinsertions. Genetic distance was calculated as: cM = 100×(2×(NKG/Ntotal)) (Table 1),
where NKGis the number of Kan-Bar double-resistant backcross progeny and Ntotalis the total
number of backcross progeny screened. We used Col/Ler SSLP genotyping markers to confirm that surviving progeny had experienced a crossover between theMRCinsertions. Recombi-nants were selected using SSLP markers to restrict analysis to theMRC1andMRC5intervals (S2andS3Tables). Genomic DNA from these individuals was then genotyped using sets of Col/Ler SNP markers withinMRC1andMRC5(KBiosciences). To test whether crossover dis-tributions were significantly different from random we performed a 2×nX2test, where n = the number of map intervals. To test the significance of individual intervalsX2tests were per-formed between the observed crossover and non-recombinant counts with those expected at random using 2×2 contingency tables (S2andS3Tables). Random expectations were obtained by proportionally allocating crossovers to intervals according to their physical length, i.e. an
interval twice as long would be expected to receive twice as many crossovers. Finally, a false dis-covery correction was applied due to multiple testing [78].
Genotyping by sequencing and crossover analysis
DNA was extracted using CTAB and used to generate sequencing libraries as described [79,80], with the following modifications. DNA was extracted from 3 rosette leaves of 5 week old plants and 150 ng of DNA used as input for each library. DNA shearing was carried out for 20 minutes at 37°C with 0.4U of DNA Shearase (Zymo research). Each set of 96 libraries was sequenced on one lane of an Illumina NextSeq500 instrument (300-cycle Mid Output run). Sequencing data was analysed to identify crossovers as previously reported, using the TIGER pipeline [79,80]. The fastq files for these data have been uploaded to ArrayExpress accession E-MTAB-4657.
To compare gene groups we sampled from the non-NBS-LRR genes by takingnblocks of lengthbrandomly distributed in the genome and sampled a proportionpof genes within each block. We compared the distributions of the distance between the start coordinates of the sam-pled genes and the physical widths of the samsam-pled genes, to those observed in the NBS-LRR genes, performing parameter sweeps onn,bandp, in order to minimize the sum of the Kolmo-gorov-Smirnov statistics observed for each distribution. The minimal difference between the distributions was observed for 220 blocks of 35,000 base pairs and sampling 20% of the genes in each block. Using these parameters, we obtained an approximation to the clustering struc-ture of the NBS-LRR genes (S2A and S2B Fig). We then repeatedly sampled (3,200 times) using these parameters and tested for overlap between samplings and crossovers, requiring at least one base in common to score an overlap. Values were length-normalized by rescaling the observed data by the total length in base pairs of the sample or gene set (S3C–S3F Fig). The observed overlap between NBS-LRR and non-NBS-LRR genes with crossovers were then com-pared to the sampled data (S3C–S3F Fig).
RAC1
hotspot pollen-typing and crossover sequencing
TheRAC1/RPP9gene and surrounding region were PCR amplified and Sanger sequenced
from the Ler-0 line used in our laboratory to identify all associated SNPs and indel polymor-phisms. Using this information we designed allele specific oligonucleotides (ASOs) that specifi-cally amplify from either Col or Ler genomic DNA templates, as described previously
[37,83,84,136] (S1 FigandS19 Table). ForRAC1two nested ASO amplifications were per-formed with the following sets of ASO primer pairs to amplify either crossover (Ler-Col) or parental (Col-Col) molecules:
1stCrossover amplification = KC459 + KC418
1stParental amplification = KC493 + KC418
2ndCrossover amplification = KC465 + KC417
2ndParental amplification = KC495 + KC417
The same PCR conditions were used for 1stand 2ndPCRs, which were: 94°C for 2’30”,
then 5 cycles of {94°C for 30”, 65°C (decrease by 0.4°C per cycle) for 45”, 68°C for 8’00”}, then 25 cycles of {94°C for 20”, 63°C for 30”, 68°C for 8’00”},
then {68°C for 10’00”}.
gave approximately half crossover positive amplifications, where by Poisson approximation the majority are from single molecules [37,83,84,136]. Single crossover molecules were amplified and treated with exonuclease I (NEB, M0293) and shrimp alkaline phosphatase (Amersham, E70092), and then directly Sanger sequenced to identify internal crossover locations.
Based on crossover molecule concentrations measured by titration, we performed mass amplification (672 reactions) of crossovers, such that most contained between 1–2 crossover templates. The resulting amplification products were pooled, concentrated by isopropanol pre-cipitation and gel purified. ~2μg of DNA in 100μl of TE (10 mM Tris, 1mM EDTA, pH 8.0) buffer was then sonicated to a size range of 300–400 bp using a Bioruptor (Diagenode). Soni-cated DNA was gel purified, end-repaired and used to generate libraries (Tru-seq, Illumina). These libraries were sequenced on an Illumina nextSeq instrument using paired-end 75 bp reads. Paired reads were separated and aligned to the Col or Ler parental sequences using bow-tie allowing only exact matches [137]. Reads were filtered for those that uniquely aligned to one parental sequence only. We then filtered for read pairs that had a centromere-proximal match to Col and a centromere-distal match to Ler on opposite strands, in order to identify crossover read pairs (S16 Table). These criteria are consistent with the ASO configuration used during allele-specific PCR amplification. A value of 1 was divided by the distance (bp) between each crossover read pair. For example, if a given pair of crossover reads are 200 bp apart, then the fractional value per bp is 1/200 = 0.005. Further consider 2 SNPs located between these crossover reads that divide this region into 3 intervals of 10, 50 and 140 bp. Each interval would then be assigned values of 100.005, 500.005 and 1400.005 respectively. This process is repeated for all read pairs and final values normalized by the total number of crossover read pairs. TheRAC1pollen-typing fastq files have been uploaded to ArrayExpression accession E-MTAB-4556.
Analysis of historical crossover frequency
Diallelic SNPs with less than 10% missing data were selected from 80 Eurasian and 180 Swed-ish accession 1,001 Genomes Project datasets [72,73]. SNPs overlapping repeats and the cen-tromeres were masked due to difficulties in assembling these regions, as performed previously [37]. SNP data was analysed using LDhat run parameters described previously, but using aθ= 0.001 look-up table [37,74]. LDhat recombination maps were filtered by setting regions where 4Ner>100, or the distance between SNPs>50 kb, to zero recombination. Population-scaled recombination rates were rescaled to cM/Mb by regression onto a consensus experimental F2
genetic map, as described previously [37].
Micrococcal nuclease sequencing
Chromatin from 1 gram of wild type (Col-0) flowers (unopened buds, prior to floral stage 12) was isolated and digested with 0.05 units of mirococcal nuclease (MNase, NEB) in reaction but-ter (10 mM Tris-HCl, pH 8.0, 10 mM NaCl, 1 mM EDTA, 4 mM CaCl2) at 37°C for 15
min-utes, with occasional vortexing. The digested nucleosomal DNA was then treated with
proteinase K (20μg/μl) and phenol/chroloform extraction performed, followed by ethanol pre-cipitation. The digested DNA was separated using gel electrophoresis through an ethidium-stained agarose-TBE gel and the ~150 bp nucleosomal band was gel purified. This DNA was end-repaired and used to generate Illumina sequencing libraries (Tru-seq) and subjected to paired-end 100 bp sequencing on a Hi-seq instrument. Reads were mapped using Bowtie2 to the TAIR10 assembly and normalized by library size. Nucleosome occupancy was analysed using the nucleR package [93]. The MNase-seq fastq files have been uploaded to ArrayExpres-sion accesArrayExpres-sion E-MTAB-4556.
NBS-LRR gene Southern blotting and hybridization
1.5μg of genomic DNA was digested using 100 units of restriction enzyme (NEB) in a final vol-ume of 200μl for 15 hours at 37°C. Digested DNA samples were isopropanol precipitated, resuspended in TE and electrophoresed in 0.8% agarose-TBE gels. Gels were blotted onto a positively charged nylon membrane (Hybond-N+, Amersham Biosciences), which was hybrid-ized in 0.5 M phosphate buffer, 7% w/v SDS, 1 mM EDTA (pH 8) and 1% BSA at 65°C. DNA probes to theRAC1gene (a PCR fragment amplified with RAC1-F 50-TGATAGAGATTGAGG CGGTCA-30and RAC1-R 50-GGCTTCGTCATCTTCTTCTCAC-30),RPP8(a PCR fragment amplified with RPP8-F 50-TCTTCATTCCTTCAATCTTCAGT-30and RPP8-R 50-GAGAT ACTTGAGTTTATACGAGGCTAA-30),HRG1(a PCR fragment amplified with HRG1-F 50 -GGTTTGGTCATGGAAGTCGG-30and HRG1-R 50-TCTTACCCGGTTTCCTTCCC-30), RPP1(a PCR fragment amplified with RPP1-F 50-AGTCAGCAAGAGGAGACCAC-30and RPP1-R 50-TCCAACTTAGTGCAATCATGGTC-30) orRPP4(a PCR fragment amplified with RPP4-F 50-AGAAGGCAAACGCTTCACTG-30and RPP4-R 50-AGCTGCCATCTCAAGGT CTT-30) were labelled with [α-32P]-dCTP using a random priming labelling kit (Rediprime II DNA labelling system, Amersham). Blots were washed with 0.5% SSC, 0.1% SDS solution at 65°C and imaged with a PhosphoImager (Typhoon 8610, Molecular Dynamics). We compared Southern blot data with the TAIR10 Col assembly and a Ler assembly generated by Pacific Bio-systems (http://blog.pacificbiosciences.com/2013/08/new-data-release-arabidopsis-assembly. html) [94].
Measurement of crossovers using flow cytometry of fluorescent pollen
Analysis of fluorescent pollen and segregation ofI5aFTL T-DNAs was performed as described previously [67]. Genetic distance is calculated as cM = 100×(R5/(R3+R5)), where R5 is the number of yellow-alone pollen and R3 is the number of both yellow and red fluorescent pollen. To test whether recombinant and non-recombinant counts were significantly different between replicate groups we used a generalized linear model (GLM). We assumed the count data is binomially distributed:
YiBðni;piÞ
whereYirepresents the recombinant counts,niare the total counts, and we wish to model the proportionsYi/ni. Then:
EðYi=niÞ ¼pi
and,
varðYi=niÞ ¼ pið1piÞ
ni
Thus, our variance function is:
VðmiÞ ¼mið1miÞ
and our link function must map from (0,1) ->(-1,1). We used a logistic link function which is:
gð Þ ¼mi logitð Þ ¼mi log mi
1mi ¼βXþεi
Supporting Information
S1 Fig. Identifying single locus KAN and BAR lines for MRC genetic mapping. (A) Repre-sentative Southern blots used to identify single copy SAIL and SGT lines. Replicate samples indicate DNA isolated from siblings. Single copy lines were identified for further experiments.
(B)Self-fertilization of homozygous KAN or BAR lines should yield ~100% resistance progeny on selective plates.(C)Self-fertilization of hemizygous KAN or BAR lines should yield 75% resistant progeny on selective plates.(D)Backcrossing hemizygous KAN or BAR lines should yield 50% resistant progeny on selective plates.
(TIFF)
S2 Fig. Overlap of crossovers with NBS-LRR genes compared with other genes. (A)The dis-tribution of distances between start coordinates for NBS-LRR genes (black) and sampled data (blue).(B)As for (A), but showing the distribution of gene widths.(C)Boxplot showing the distribution of the number of crossovers per gene from the sampled data. The red point shows the observed value for NBS-LRR genes and the blue point shows that for the non-NBS-LRR genes.(D)As for (C), but showing the number of crossovers overlapping the sampled genes, normalized by the total length of all genes in the sample.(E)Boxplot showing the distribution of the proportion of genes overlapping crossovers in the sampled data. The red point shows the observed value for NBS-LRR genes and the blue point shows that for the non-NBS-LRR genes.
(F)As for (E), but showing the number of genes overlapping crossovers normalized by the total length of all genes in the sample.
(TIFF)
S3 Fig. Validation of template specificity forRAC1allele-specific oligonucleotides used for pollen-typing.Representative ethidium bromide stained agarose gels are shown with PCR amplification products generated using either Col or Ler genomic DNA as a template. Reac-tions were repeated using the gradient of annealing temperatures indicated at the top of the gel. Primers were either template non-specific (universal forward (UF) or universal reverse (UR)) or allele-specific (Col R1 = KC418, Col R2 = KC417, Ler F1 = KC459, Ler F2 = KC465). Primer sequences are provided inS19 Table. Amplification was specific to the template genotype of choice under these PCR conditions.
(TIFF)
S4 Fig.HRG1structural diversity between Arabidopsis accessions analysed by Southern blotting and hybridization.Genomic DNA was isolated from the indicated accessions and digested withEcoRV. DNA was separated using gel electrophoresis, blotting and probing using radio-labelledHRG1DNA.
(TIFF)
S5 Fig.RPP4-RPP5structural diversity between Arabidopsis accessions analysed by South-ern blotting and hybridization.Genomic DNA was isolated from the indicated accessions and digested withAseI. DNA was separated using gel electrophoresis, blotting and probing using radio-labelledRPP4DNA.
(TIFF)
S6 Fig.RPP1structural diversity between Arabidopsis accessions analysed by Southern blotting and hybridization.Genomic DNA was isolated from the indicated accessions and digested withHaeII andPstI. DNA was separated using gel electrophoresis, blotting and prob-ing usprob-ing radio-labelledRPP1DNA.
(TIFF)
S1 Table.Arabidopsis thalianaNBS-LRR gene family annotation.For each gene, chromo-some, transcriptional start site (TSS) and termination site (TTS) are listed according to TAIR10 representative gene models. Historical recombination (cM/Mb) and diversity parame-ters (θandπ) were calculated for intragenic regions between TSS and TTS, using Eurasian and Swedish SNP datasets [72–74,82]. ForRgenes with known biological functions their given name is listed. In addition 3 columns have been added with TRUE/FALSE statements depend-ing if the gene product has a match to the listed Pfam domain (TIR, NBS, LRR). Information is given onRgene locus structure, classified as either singleton, tandem, inverted or complex. The number of members within a repeated locus is listed.
(XLSX)
S2 Table. Crossover frequency within theMRC1NBS-LRR supercluster region.The table lists marker coordinates used to genotype double-selectedMRC1crossover individuals, together with Col and Ler genotypes and interval lengths (bp). The number of crossovers iden-tified in each interval is shown, together with cM/Mb. Eurasian and Swedish historical recom-bination rates estimated by LDhat are shown for the same intervals and NBS-LRR genes present in each interval are listed. A chi-square test was performed between the observedMRC crossover counts per interval and those expected at random using a 2×2 contingency table. P<0.05 values are listed in thePcolumn, or listed as not significantly different (ns). ThePadj. column shows the significance level after correction for multiple testing [78].
(DOCX)
S3 Table. Crossover frequency within theMRC5NBS-LRR supercluster region.The table lists marker coordinates used to genotype double-selectedMRC5crossover individuals, together with Col and Ler genotypes and interval length (bp). The number of crossovers identi-fied in each interval is shown, together with cM/Mb. Eurasian and Swedish historical recombi-nation rates estimated by LDhat are shown for the same intervals andRgenes present in each interval are listed. A chi-square test was performed between the observed crossover counts per interval and those expected at random using a 2×2 contingency table.P<0.05 values are listed in thePcolumn, or listed as not significantly different (ns). ThePadj. column shows the signif-icance level after correction for multiple testing [78].
(DOCX)
S4 Table. Fine-mapping crossovers within theHRG1 MRC1map interval using dCAPs gen-otyping.The‘Genotyping Assay’column indicates whether a given marker coordinate was genotyped by KBiosciences (SNP), or via dCAPs assays.
(DOCX)
S5 Table. Fine-mapping crossovers within theHRG2 HRG3 MRC5map interval using dCAPs genotyping.The‘Genotyping Assay’column indicates whether a given marker coordi-nate was genotyped by KBiosciences (SNP), or via dCAPs assays.
(DOCX)
S6 Table. Fine-mapping crossovers within theWRR4 MRC1map interval using dCAPs gen-otyping.The‘Genotyping Assay’column indicates whether a given marker coordinate was genotyped by KBiosciences (SNP), or via dCAPs assays.
(DOCX)
S7 Table. Fine-mapping crossovers within theCW9 MRC1map interval using dCAPs geno-typing.The‘Genotyping Assay’column indicates whether a given marker coordinate was gen-otyped by KBiosciences (SNP), or via dCAPs assays.
S8 Table. Fine-mapping crossovers within theHRG4-HRG5 MRC1map interval using dCAPs genotyping.The‘Genotyping Assay’column indicates whether a given marker coordi-nate was genotyped by KBiosciences (SNP), or via dCAPs assays.
(DOCX)
S9 Table. Fine-mapping crossovers within theHRG6 MRC1map interval using dCAPs gen-otyping.The‘Genotyping Assay’column indicates whether a given marker coordinate was genotyped by KBiosciences (SNP), or via dCAPs assays.
(DOCX)
S10 Table. Fine-mapping crossovers within theHRG7-HRG8 MRC5map interval using dCAPs genotyping.The‘Genotyping Assay’column indicates whether a given marker coordi-nate was genotyped by KBiosciences (SNP), or via dCAPs assays.
(DOCX)
S11 Table. Fine-mapping crossovers within theHRG9 MRC5map interval using dCAPs genotyping.The‘Genotyping Assay’column indicates whether a given marker coordinate was genotyped by KBiosciences (SNP), or via dCAPs assays.
(DOCX)
S12 Table. Recombination rates of plant crossover hotspots.The mean and maximum cross-over frequency (cM/Mb) measured at known plant hotspots is listed, together with the species studied, hotspot name, width of measured region, genetic distance (cM) and crossover fre-quency (cM/Mb), together with chromosome average recombination rates.
(DOCX)
S13 Table. Crossovers identified by genotyping by sequencing in a Col×Ler F2population.
192 Col×Ler F2individuals were analysed by genotyping-by-sequencing. The number of
cross-overs (CO) per F2and in total are listed, for the whole genome and for each chromosome
sepa-rately. (DOCX)
S14 Table. Measurement ofRAC1recombination rate via pollen-typing.A 9.419 kb ampli-con (Chr1: 11,288,146–11,297,565 bp) containing theRAC1gene was amplified using allele-specific oligonucleotides to estimate the number of parental (non-recombinant) and crossover molecules perμl of Col/Ler F1pollen genomic DNA. Genetic distance was calculated as
described [83]. (DOCX)
S15 Table. Crossover distributions across theRAC1 Rgene hotspot analysed via pollen typ-ing.181 singleRAC1crossover molecules were Sanger sequenced to identify recombination sites to the resolution of single polymorphisms. Col and Ler genotypes and number of cross-overs per interval are listed, together with cM/Mb.
(DOCX)
S16 Table.RAC1crossover read pair analysis pipeline.The number of read pairs surviving se-quential analysis filters are listed in order to identifyRAC1crossover read pairs. Paired end reads (1 and 2) were separated and aligned to the Col or LerRAC1parental template sequences, allow-ing only exact matches (Mapped). Read pair ends that mapped to both Col and Ler were then excluded (Unique). Read pair ends (1 and 2) that mapped to Col and Ler were identified (Matched), where the Ler mapping read had a lower coordinate than the Col mapping read (Orientate), and that were on opposite strands (Strand). These filters yielded 182,909 crossover read pairs. (DOCX)
S17 Table. CTT-repeat motifs associated with high and lowMRCrecombination NBS-LRR genes.NBS-LRR genes located within theMRCgenetic maps were divided into two groups according to whether their interval had higher or lower crossover frequency (cM/Mb) com-pared with the male Col×Ler genome average (4.82 cM/Mb) [71]. We then matched the posi-tion weight matrix of a CTT-repeat motif previously identified as enriched at Arabidopsis historical crossover hotspots (CTTCTTCTTCTTCTTC) [37] to +1 kb windows around NBS-LRR gene transcriptional start sites (TSSs), allowing matches with>80% identity. The location, width and sequence of matching CTT motifs are listed. Motif coordinates are given relative to the 1 kb of sequence matched to.
(DOCX)
S18 Table. Measurement ofI5agenetic distance using fluorescent pollen and flow cytome-try.The first column lists the accession theI5areporter (Col-0) was crossed to. In the case of Col-0 this represents data from Col-0/Col-0 homozygotes. The total number of pollen counted is listed, in addition to the number with red fluorescence alone (Red), yellow alone (yellow), both colors (Red+Yellow), or neither fluorescence (None). Genetic distance is calculated as cM = 100 × (Y/(Y+RY)). Where Y is the number of yellow alone pollen grains and RG is the number of both yellow and red fluorescent pollen grains. To test whether recombinant and non-recombinant counts were significantly different between replicate groups we used a gener-alized linear model (GLM), assuming that the count data is binomially distributed. Tests were performed between F1genotypes and Col/Col homozygotes.
(DOCX)
S19 Table.RAC1primer sequences used for allele-specific PCR amplification.Positions annealing to Col/Ler polymorphic bases in the allele-specific primers are indicated in red. The accession each primer anneals to is listed (Col or Ler), together with a code indicating whether the primer is forward or reverse (F or R) and used in the first or second round of allele-specific amplification (1 or 2).
(DOCX)
Acknowledgments
We kindly thank Detlef Weigel and Magnus Nordborg for providing 1,001 Genomes Project SNP data used for LDhat analysis.
Author Contributions
Conceived and designed the experiments: KC CR HS PAZ CJU NEY CG IRH. Performed the experiments: KC CR HS PAZ CJU CG. Analyzed the data: KC CR HS PAZ CJU XZ TJH NEY CG MJ CM GM GPC IRH. Contributed reagents/materials/analysis tools: CM GM GPC. Wrote the paper: KC CR HS PAZ CJU XZ TJH NEY CG MJ CM GM GPC IRH.
References
1. Villeneuve AM, Hillers KJ. Whence meiosis? Cell. 2001; 106: 647–50. PMID:11572770 2. Mercier R, Mézard C, Jenczewski E, Macaisne N, Grelon M. The Molecular Biology of Meiosis in
Plants. Annu Rev Plant Biol. 2015; 66:297–327. doi:10.1146/annurev-arplant-050213-035923 PMID:25494464
3. Szostak JW, Orr-Weaver TL, Rothstein RJ, Stahl FW. The double-strand-break repair model for recombination. Cell. 1983; 33: 25–35. PMID:6380756
5. De Massy B. Initiation of meiotic recombination: how and where? Conservation and specificities among eukaryotes. Annu Rev Genet. 2013; 47: 563–99. doi:10.1146/annurev-genet-110711-155423 PMID:24050176
6. Kauppi L, Jeffreys AJ, Keeney S. Where the crossovers are: recombination distributions in mammals. Nat Rev Genet. 2004; 5: 413–24. PMID:15153994
7. Choi K, Henderson IR. Meiotic recombination hotspots—a comparative view. Plant J. 2015; 83: 52– 61. doi:10.1111/tpj.12870PMID:25925869
8. Haldane J. Disease and evolution. Ric Sci Suppl A. 1949; 19: 68–76.
9. Haas BJ, Kamoun S, Zody MC, Jiang RHY, Handsaker RE, Cano LM, et al. Genome sequence and analysis of the Irish potato famine pathogen Phytophthora infestans. Nature. 2009; 461: 393–8. doi: 10.1038/nature08358PMID:19741609
10. Frazer KA, Ballinger DG, Cox DR, Hinds DA, Stuve LL, Gibbs RA, et al. A second generation human haplotype map of over 3.1 million SNPs. Nature. 2007; 449: 851–61. PMID:17943122
11. Kämper J, Kahmann R, Bölker M, Ma L-J, Brefort T, Saville BJ, et al. Insights from the genome of the biotrophic fungal plant pathogen Ustilago maydis. Nature. 2006; 444: 97–101. PMID:17080091 12. Dong S, Raffaele S, Kamoun S. The two-speed genomes of filamentous pathogens: waltz with plants.
Curr Opin Genet Dev. 2015; 35: 57–65. doi:10.1016/j.gde.2015.09.001PMID:26451981 13. Jones JDG, Dangl JL. The plant immune system. Nature. 2006; 444: 323–329. PMID:17108957 14. Chisholm ST, Coaker G, Day B, Staskawicz BJ. Host-microbe interactions: shaping the evolution of
the plant immune response. Cell. 2006; 124: 803–14. PMID:16497589
15. Zipfel C. Early molecular events in PAMP-triggered immunity. Curr Opin Plant Biol. 2009; 12: 414–20. doi:10.1016/j.pbi.2009.06.003PMID:19608450
16. Meyers BC, Kozik A, Griego A, Kuang H, Michelmore RW. Genome-wide analysis of NBS-LRR-encoding genes in Arabidopsis. Plant Cell. 2003; 15: 809–34. PMID:12671079
17. Hofberger JA, Zhou B, Tang H, Jones JDG, Schranz ME. A novel approach for multi-domain and multi-gene family identification provides insights into evolutionary dynamics of disease resistance genes in core eudicot plants. BMC Genomics. 2014; 15: 966. doi:10.1186/1471-2164-15-966PMID: 25380807
18. Deslandes L, Olivier J, Peeters N, Feng DX, Khounlotham M, Boucher C, et al. Physical interaction between RRS1-R, a protein conferring resistance to bacterial wilt, and PopP2, a type III effector tar-geted to the plant nucleus. Proc Natl Acad Sci U S A. 2003; 100: 8024–9. PMID:12788974
19. Kim MG, da Cunha L, McFall AJ, Belkhadir Y, DebRoy S, Dangl JL, et al. Two Pseudomonas syringae type III effectors inhibit RIN4-regulated basal defense in Arabidopsis. Cell. 2005; 121: 749–59. PMID: 15935761
20. Van der Hoorn RAL, Kamoun S. From Guard to Decoy: a new model for perception of plant pathogen effectors. Plant Cell. 2008; 20: 2009–17. doi:10.1105/tpc.108.060194PMID:18723576
21. Zhou J-M, Chai J. Plant pathogenic bacterial type III effectors subdue host responses. Curr Opin Microbiol. 2008; 11: 179–85. doi:10.1016/j.mib.2008.02.004PMID:18372208
22. Zipfel C, Rathjen JP. Plant immunity: AvrPto targets the frontline. Curr Biol. 2008; 18: R218–20. doi: 10.1016/j.cub.2008.01.016PMID:18334200
23. Dodds PN, Lawrence GJ, Catanzariti A-M, Teh T, Wang C-IA, Ayliffe MA, et al. Direct protein interac-tion underlies gene-for-gene specificity and coevoluinterac-tion of the flax resistance genes and flax rust avirulence genes. Proc Natl Acad Sci U S A. 2006; 103: 8888–93. PMID:16731621
24. Gao L, Roux F, Bergelson J. Quantitative fitness effects of infection in a gene-for-gene system. New Phytol. 2009; 184: 485–94. doi:10.1111/j.1469-8137.2009.02959.xPMID:19659661
25. Roux F, Gao L, Bergelson J. Impact of initial pathogen density on resistance and tolerance in a poly-morphic disease resistance gene system in Arabidopsis thaliana. Genetics. 2010; 185: 283–91. doi: 10.1534/genetics.109.112383PMID:20142437
26. Karasov TL, Kniskern JM, Gao L, DeYoung BJ, Ding J, Dubiella U, et al. The long-term maintenance of a resistance polymorphism through diffuse interactions. Nature. 2014; 512: 436–440. doi:10.1038/ nature13439PMID:25043057
27. Tian D, Traw MB, Chen JQ, Kreitman M, Bergelson J. Fitness costs of R-gene-mediated resistance in Arabidopsis thaliana. Nature. 2003; 423: 74–77. PMID:12721627
28. Narusaka M, Shirasu K, Noutoshi Y, Kubo Y, Shiraishi T, Iwabuchi M, et al. RRS1 and RPS4 provide a dual Resistance-gene system against fungal and bacterial pathogens. Plant J. 2009; 60: 218–26. doi:10.1111/j.1365-313X.2009.03949.xPMID:19519800