Dissection of molecular assembly dynamics by tracking
orientation and position of single molecules in
live cells
Shalin B. Mehtaa,1, Molly McQuilkenb,c, Patrick J. La Riviered, Patricia Occhipintib,c, Amitabh Vermaa, Rudolf Oldenbourga,e, Amy S. Gladfeltera,b,c, and Tomomi Tania,2
aEugene Bell Center for Regenerative Biology and Tissue Engineering, Marine Biological Laboratory, Woods Hole, MA 02543;bDepartment of Biological Sciences, Dartmouth College, Hanover, NH 03755;cDepartment of Biology, University of North Carolina at Chapel Hill, Chapel Hill, NC 27599;dDepartment of Radiology, University of Chicago, Chicago, IL 60637; andePhysics Department, Brown University, Providence, RI 02912
Edited by Jennifer Lippincott-Schwartz, National Institutes of Health, Bethesda, MD, and approved August 19, 2016 (received for review May 12, 2016)
Regulation of order, such as orientation and conformation, drives the function of most molecular assemblies in living cells but remains difficult to measure accurately through space and time. We built an instantaneous fluorescence polarization microscope, which simultaneously images position and orientation of fluorophores in living cells with single-molecule sensitivity and a time resolution of 100 ms. We developed image acquisition and analysis methods to track single particles that interact with higher-order assemblies of molecules. We tracked the fluctuations in position and orien-tation of molecules from the level of an ensemble of fluorophores down to single fluorophores. We tested our system in vitro using fluorescently labeled DNA and F-actin, in which the ensemble orientation of polarized fluorescence is known. We then tracked the orientation of sparsely labeled F-actin network at the leading edge of migrating human keratinocytes, revealing the anisotropic distribution of actin filaments relative to the local retrograde flow of the F-actin network. Additionally, we analyzed the position and orientation of septin-GFP molecules incorporated in septin bundles in growing hyphae of a filamentous fungus. Our data indicate that septin-GFP molecules undergo positional fluctuations within∼350 nm of the binding site and angular fluctuations within∼30° of the central orientation of the bundle. By reporting position and orien-tation of molecules while they form dynamic higher-order structures, our approach can provide insights into how micrometer-scale ordered assemblies emerge from nanoscale molecules in living cells.
single-molecule orientation
|
live cell imaging|
polarized fluorescence|
actin|
septinT
he generation and dissolution of order within populations of biological molecules are central to almost all cellular processes. The emergence of ordered arrays of biological molecules is manifested in lipid membranes, DNA, the cytoskeleton, and many other molecular assemblies in the cytoplasm of the living cell. Polarization-resolved fluorescence imaging of densely labeled as-semblies has successfully probed their net order and architectural dynamics (1–5). In addition, tracking of sparsely labeled cytoskel-etal networks (6–9) has illuminated how turnover of individual molecules enables transitions in the spatial organization of cyto-skeletal networks. We have combined tracking of both orientation and position of single fluorophores associated with cystoskeletal proteins in live cells to analyze the molecular order within cyto-skeletal assemblies.Fluorophores, including the GFP, emit fluorescence by radiating light as dipoles. The light emitted from a single dipole is fully po-larized, with most of the energy polarized along the dipole axis. For example, the absorption and emission dipole axes of GFP chromo-phores are fixed within the GFP molecule as was found in GFP crystals (10, 11). Therefore, fluorescent labels can report the ori-entation of biomolecules as long as the labels are rigidly bound to the biomolecules, constraining their relative motion (12, 13). Com-parison of the intensities recorded by either polarization-resolved
excitation (3–5, 14–18) or polarization-resolved detection (1, 2, 19– 21) has allowed measurement of orientations of fluorophores.
For fluorescent assemblies that exhibit simple geometries, such as planar (3), spherical (2), or cylindrical (19) shapes, two or-thogonal polarization-resolved measurements suffice to retrieve fluorophore orientations relative to these geometries. However, unbiased measurement of dipole orientation in a complex as-sembly requires exciting or analyzing the fluorescent dipoles using at least three and preferably, four polarizer orientations (22). We have previously developed (4, 5, 14, 15) a liquid crystal-based fluorescence polarization microscope (fluorescence LC-PolScope) that sequentially excites fluorophores with light polarized along 0°, 45°, 90°, and 135°. We used the fluorescence LC-PolScope to analyze the remodeling of septin assemblies with a time resolution of about 10 s (4, 5). For assemblies that rearrange on a faster timescale, the fluorescence LC-PolScope generates spurious re-sults because of motion artifacts introduced by sequential image acquisition. Simultaneous acquisition of polarization-resolved im-ages circumvents the artifacts introduced by sequential acquisition. Simultaneous analysis of fluorescence emission along two or-thogonal orientations was recently combined with localization microscopy to reveal the angular distribution of single fluores-cent dipoles attached to filamentous assemblies in fixed cells and in vitro (19). For live cell imaging, however, localization micros-copy is typically too slow. Furthermore, interpretation of angular
Significance
In living cells, the 3D architecture of molecular assemblies, such as chromosomes, lipid bilayers, and the cytoskeleton, is regu-lated through the interaction among their component molecules. Monitoring the position and orientation of constituent molecules is important for understanding the mechanisms that govern the structure and function of these assemblies. We have developed an instantaneous fluorescence polarization microscope to track the position and orientation of fluorescently labeled particles, including single molecules, which form micrometer-scale macro-molecular assemblies in living cells. Our imaging approach is broadly applicable to the study of dynamic molecular interactions that underpin the function of micrometer-scale assemblies in living cells.
Author contributions: S.B.M., R.O., A.S.G., and T.T. designed research; S.B.M., M.M., and T.T. performed research; S.B.M., M.M., P.J.L.R., P.O., A.V., R.O., A.S.G., and T.T. contributed new reagents/analytic tools; S.B.M., M.M., and T.T. analyzed data; and S.B.M., R.O., A.S.G., and T.T. wrote the paper.
The authors declare no conflict of interest.
This article is a PNAS Direct Submission.
1Present address: Department of Radiology, University of Chicago, Chicago, IL 60637. 2To whom correspondence should be addressed. Email: [email protected].
distribution from two orthogonally polarized images requires a subtle but important assumption that all fluorophores in the ana-lyzed puncta are bound to the same filament of cylindrical sym-metry. This assumption often does not hold in live cells because of either the complexity of the ordered structure (e.g., F-actin net-work at lamellipodia or septin hourglass at yeast bud neck) or noncylindrical symmetry of the structure (e.g., focal adhesions). Wide-field unpolarized excitation and simultaneous analysis of fluorescence emission along four polarization orientations (20) have been used to study 3D rotation of isolated myosin motor proteins walking on actin filaments but have not been applied to micrometer-scale assemblies in living cells that display interactions between many molecules. Thus, previous approaches are either incompatible with live cell imaging or limited in their capacity to track position and orientation of many molecules in parallel against the fluorescent background typical of a live cell.
We have developed an instantaneous fluorescence polarizing microscope (instantaneous FluoPolScope) that combines iso-tropic total internal reflection (TIR) excitation and instanta-neous sorting of emitted fluorescence along four polarization orientations using a home-built image-splitting device. These optics are complemented by algorithms for tracking of position and orientation of fluorescent particles, including single mole-cules, at the cortex of live cells with subpixel accuracy. Our method has the potential to answer important questions raised by studies using high-resolution X-ray crystallography, NMR, or EM about dynamic molecular interactions during assembly/ disassembly of biological molecules in living cells or systems reconstituted in vitro.
We report two approaches of optically dissecting the ordered organization of micrometer-scale molecular assemblies in live cells. (i) Tracking the position and orientation of molecular components within complex networks that are sparsely labeled with fluorescent orientation probes. This approach can reveal the dynamic rearrangement of the molecular components asso-ciated with the deformation or movement of the network. (ii) Tracking the position and orientation of fluorescently labeled protein subunits that interact with a higher-order assembly, thus revealing their molecular interactions and assembly kinetics.
For establishing and testing the methods, we observed fluorescently labeled DNA and actin filaments prepared in vitro and bound to a coverslip surface. We evaluated the utility of the methods to study molecular order of micrometer-scale assemblies of actin and septin in live cells. We used sparse labeling of F-actin at the leading edge of migrating human keratinocytes to analyze changes in the orientation of actin filaments relative to the direction of actin retrograde flow. We expressed septins with rotationally constrained GFP (conGFP) tags (4, 5, 12, 13) in the filamentous fungusAshbya gossypiiand observed the change in polarized fluorescence of individual septin particles and their assemblies located at the cortex of living cells. Tracking temporal fluctuations of the fluorescence intensity, position, and orientation of septin particles revealed confined motion in both position and angle experienced by septin-GFP molecules, thus providing insight in their assembly kinetics in living cells.
Results and Discussion
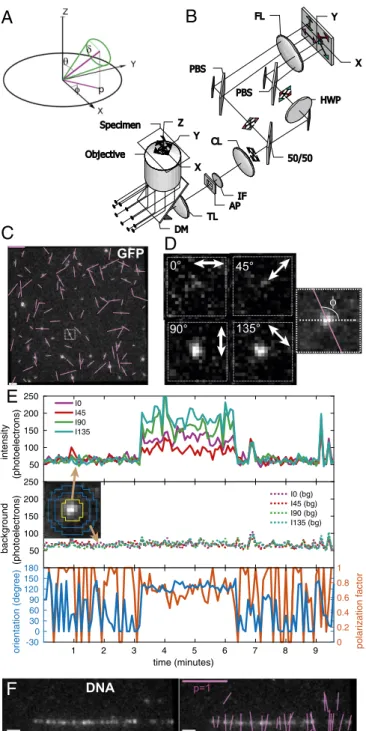
Instantaneous Imaging of Position and Orientation of Fluorophores with Single-Molecule Sensitivity. We designed a microscope to provide subpixel position and bias-free measurement of molec-ular orientation of single dipoles and their ensembles near a glass–water interface or at the cell cortex. The angular distri-bution of dipoles (Fig. 1A) is represented by its azimuthϕwithin the focal plane (XY), tiltθrelative to the optical axis (Z), and a wobble rangeδover the camera exposure. Polarization analysis in the image plane provides unambiguous measurement of the azimuth, called orientation in this paper. However, the tilt and the wobble are both inferred from the polarization factorp. The
p φ
θ δ
A
B
C
50 100 150 200 250
intensity
(photoelectrons)
I0 I45 I90 I135
50 100 150 200 250
background
(photoelectrons)
I0 (bg) I45 (bg) I90 (bg) I135 (bg)
0 0.2 0.4 0.6 0.8 1
polarization factor
1 2 3 4 5 6 7 8 9
time (minutes) -30
0 30 60 90 120 150 180
orientation (degree)
E
D
0° 45°
90° 135° GFP
F
DNA p=1φ
Fig. 1. Imaging orientation of fluorescent single molecules with instanta-neous FluoPolScope. (A) Coordinate system used to parameterize single di-poles and their ensembles (thick green line through origin) by their net orientationϕin the focal plane (XY), net tiltθrelative to the optical axis of the microscope (Z), and wobbleδduring the exposure. (B) Schematic of the microscope. AP, aperture; CL, collimating lens; DM, dichroic mirror; IF, in-terference filter; PBS, polarization beam splitter; TL, tube lens. (C) Polari-zation resolved fluorescence images of GFP molecules attached to coverslip. (D) Enlarged images of single GFP molecule identified by the outlined square inC.Rightshows the computed dipole orientation as a magenta line over-laid on the sum of all polarization-resolved images. (E) Particle intensities (Top), background intensities (Middle), and orientation and polarization factor (Bottom) of the single GFP molecule shown inDthat was recorded for more than 3 min. InsetinMiddle identifies the pixels used to estimate particle intensities (area enclosed by the yellow line) and background in-tensity (circular area between two blue lines) in each quadrant. (F) Fluo-rescence images ofλphage DNA stained with 50 nM TOTO-1 (Left) and the image with orientations of polarized fluorescence of detected particles shown by magenta lines (Right). (Scale bars: magenta inCandF, polarization factor=1; white inCandF, 1μm.)
BIOPHYSIC
S
AND
COMPUTAT
IONAL
BIOLOGY
APPLIE
D
PHY
SICAL
SCIENCES
PNAS
isotropic) depending on the tilt and wobble in the distribution of fluorophores.
For efficient excitation of dipoles oriented in 3D, we used isotropically polarized TIR illumination (Methodsand Fig. 1B). For instantaneous imaging of azimuth and polarization factor, we created an imaging path with beam splitters projecting four polarization-resolved images of the field of view onto the four quadrants of an electron-multiplying charge-coupled device (EMCCD) camera (Methods and Fig. 1B). We identified the linear, shot noise-limited operating regime of our EMCCD camera using photon transfer analysis (SI Appendix, Note S1 and
Fig. S1), which also allows us to express all intensity
measure-ments in the units of detected photoelectrons. Before computing orientation and polarization factors from quadrant intensities, differences in spatial registration and transmission efficiencies of the quadrants are accounted for using a robust calibration system (Methods andSI Appendix, Note S2 and Fig. S2). In using the calibration, we expressed the orientation of polarized fluores-cence, polarization factor, and intensity in terms of the Stokes parameters of the fluorescence emission in the image plane (Methodsand Eqs.1,2, and3).
To evaluate the sensitivity to single molecules, we imaged mo-nomeric EGFP molecules (Fig. 1C) attached to poly-D-lysine– coated glass coverslips (SI Appendix, Note S3). Unlike the isotropic fluorescence of 100-nm beads labeled with a large number of flu-orophores (SI Appendix, Fig. S2A), we could detect anisotropic fluorescence of single EGFP molecules by a clear imbalance of their florescence intensities in the four quadrants (Fig. 1D). Imaging with low laser power of 1.1 μW/μm2 at the specimen plane (20% neutral density filter) and 500-ms exposure at 5-s intervals, we were able to image orientations of single immobile EGFP molecules for up to 15 min and longer.
We developed MATLAB code for automated detection of par-ticle locations, intensities, and background (SI Appendix, Note S4
and Fig. S4) to map temporal fluctuations in intensity and
orien-tation of fluorescent particles (Fig. 1E) across the field of view (Fig. 1CandSI Appendix, Fig. S3A). The particle fluorescence recorded in the four quadrants illustrated in Fig. 1DandEmaintained its relative intensity for up to 3 min before simultaneously bleaching to the background level in a single step. Fluorescent particles were classified as being single molecules bound to the glass or cellular structures later in the paper by two criteria: (i) their fluorescence resided within a diffraction-limited spot that could be tracked for at least five consecutive frames, and (ii) their fluorescence bleached to the background intensity in a single step (Movie S1).
The nearly uniform histogram of orientations of more than 7,000 single EGFP particles (SI Appendix, Fig. S3B) confirms that our imaging and calibration approach indeed provides bias-free measurement of orientation. Sum of quadrant intensities above the background (SI Appendix, Fig. S3C) exhibits a single peak at ∼350 photoelectrons for single EGFP molecules with lognormal distribution typically observed with TIR illumination (23). Plotting the fluctuations in the detected centroids of the EGFP particles (SI Appendix, Fig. S3D) showed that many of them were confined to an area of 25×25 nm, which is an upper bound on the achieved localization precision.
To estimate the shot noise-induced standard deviation (SD) σϕof measured orientations, we propagated the shot noise of the intensities and expressed it in terms of the sum intensity above background, background intensity, and polarization factor (SI Appendix, Notes S5 and S6). Their functional dependence is shown inSI Appendix, Fig. S5. For the EGFP molecule shown in Fig. 1DandE, [p∼0.8,I(total)∼275,Ibg(total)∼200], the SD of estimated orientation is 3°, which is better than the 10° ac-curacy reported earlier with a similar polarization analysis system (20) or a system that analyzes the shape of the emission pattern at a slightly out of focus plane (24). The 3° SD is comparable
at the back focal plane (BFP) (25).
We used combedλ-phage DNA labeled with TOTO-1 (Fig. 1F
andSI Appendix, Note S3), in which the dipole orientation of the chromophores has already been characterized (26). As expected, the fluorescence polarization of a TOTO-1 particle was found to be perpendicular to the local orientation of the DNA (Fig. 1F
and Movie S2). We tracked (27) the time-dependent position,
intensity, orientation, and polarization factor of subresolution particles (SI Appendix, Note S7 and Fig. S6C–G) with the fol-lowing results. During the observation, the intensity of individ-ual TOTO-1 particles decreased in a stepwise manner before bleaching down to the background level (SI Appendix, Fig. S6E). The lowest intensity step was∼150 photoelectrons. The fluores-cence intensity histogram of TOTO-1 particles that bleach to background during acquisition (SI Appendix, Note S8) showed a broad distribution ranging from 50 to 1,500 photoelectrons (SI Appendix, Fig. S6H), with periodic peaks at multiples of 150 photoelectrons, which corroborates the single-chromophore in-tensity before complete bleaching (SI Appendix, Fig. S6E). The orientation of this TOTO-1 particle (SI Appendix, Fig. S6F) shows a stable position and orientation perpendicular to the DNA axis. However, at the single-chromophore level, the ori-entation, position, and polarization factor of the particle (SI Appendix, Fig. S6C–G) became more variable, presumably be-cause of a break in the DNA be-caused by a photochemical reaction where TOTO-1 is bound.
Above results show that our microscope can provide a robust and instantaneous measurement of intensity, orientation, and position of single dipoles and their ensembles incorporated in micrometer-scale assemblies.
Tracking Position and Orientation of Actin Assembly in Vitro and in Living Cells.Migratory cells rely on the regulated polymerization of actin networks and the contractile behavior of actomyosin assemblies to generate propulsive forces. The molecular archi-tecture of the actin network at the leading edge and its spatio-temporal evolution have been studied extensively using EM (28, 29) and fluorescent speckle microscopy (7–9). We used our in-stantaneous FluoPolScope and tracking algorithms to analyze local orientations of constituent actin filaments relative to ret-rograde flow of the actin network.
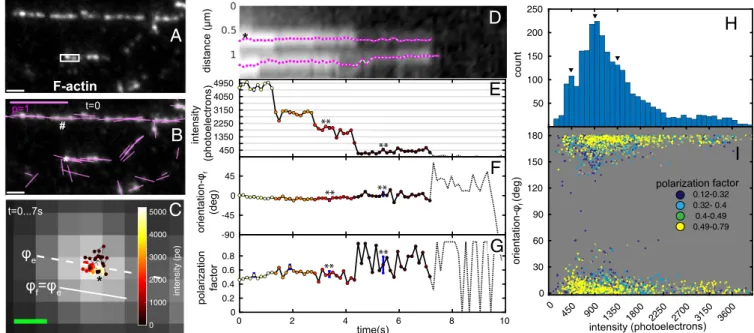
We first identified the orientation of polarized fluorescence of Alexa Fluor 488 phalloidin (AF488-phalloidin; Molecular Probes) bound to in vitro actin filaments at different labeling ratios ranging from dense labeling to single molecules of AF488. When exposed to low concentrations (2–5 nM) (SI Appendix, Note S3) of AF488-phalloidin, in vitro actin filaments were sparsely labeled (Fig. 2A), leading to subresolution particles, with position, fluorescence in-tensity, orientation, and polarization factor that were tracked over time (SI Appendix, Notes S7 and S8) with the following results.
The ensemble orientation of fully decorated straight filaments was found to be parallel to the orientation of the filament axis (# in Fig. 2B). Actin filaments exhibit bends, making it difficult to identify filament orientation at the location of each subresolution particle. Therefore, we defined the local filament orientation (ϕf)
(Fig. 2C) as the ensemble orientation (ϕe) averaged over the first
five time points of tracked particles. We observed displacements of tracked particles within a range of∼100 nm (Fig. 2CandD
andMovie S3), which is well above our experimentally verified
∼450 photoelectrons, which corroborate the intensity of single AF488 as shown in Fig. 2E. The orientation of AF488-phalloidin was consistently parallel to the filaments throughout our obser-vations (Fig. 2F), even at the single-molecule intensity level. Interestingly, for several AF488 particles, we observed that the polarization factor remained high or even increased (Fig. 2G) when the fluorophore ensemble bleached to a single fluorophore. These observations are confirmed by plotting the particle orien-tation (relative to local filament orienorien-tation) against the particle intensity with color-coded polarization factor in Fig. 2I, where the majority of particles with single-molecule intensity (∼450 photo-electrons) showed polarization factors above 0.49 and the particles with high polarization factor reported orientation of the filament irrespective of the intensity. Data in Fig. 2 F and I strongly suggest that the fluorescence polarization of AF488-phalloidin faithfully reports the orientation of actin filaments, even at the single-molecule level.
Our method, therefore, offers the possibility of simultaneously analyzing the structural dynamics of actin networks in live cells and the molecular orientation of the constituent actin filaments that are sparsely labeled with AF488-phalloidin. We introduced low concentrations (10–20 nM) of AF488-phalloidin to human keratinocytes [HaCaT cells (31)] cultured on glass coverslips (SI Appendix, Note S9). Sparse labeling of F-actin in live cells with fluorescent phalloidin at concentrations lower than∼20 nM pre-serves normal actin-driven dynamics and cell motility in a variety
of cell types (8, 32), enabling visualization of continuous retro-grade flow within actin networks at the leading edge.
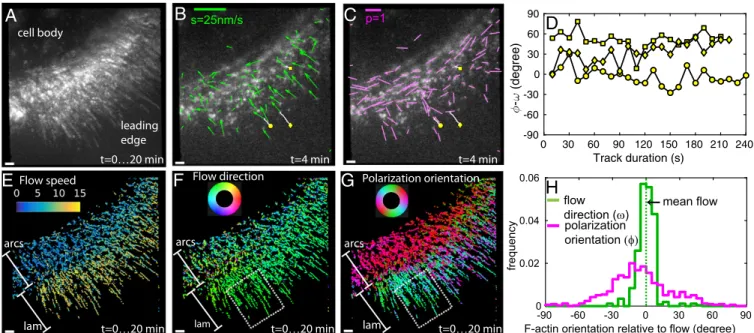
We observed distinct particles of AF488-phalloidin across the leading edge (Movies S4andS5) of migrating HaCaT cells. For additional analysis, we selected cells that showed periodical protrusion and retraction of lamellipodia at the leading edge even after introducing fluorescent phalloidin into the cytoplasm (Fig. 3 andMovie S4). Sparse fluorescent labeling allowed us to track the position, motion, and orientation of individual parti-cles. Using maximum intensity projections of the particle fluo-rescence over time, we confirmed that particle tracks fully probed the actin network at the leading edge and its movement to the base of the lamellipodium (Fig. 3A). We tracked the flow direction of each AF488-phalloidin particle (Fig. 3B) and com-pared it with the orientation of the associated actin filaments measured by its fluorescence polarization. We monitored the changes in the local orientation of F-actin (Fig. 3C) during the continuous retrograde flow (Fig. 3D) within two domains of the actin network: the distal domain at the leading edge and the proximal domain of the lamella consisting of actin arcs (7, 9).
Spatial maps of flow speed (Fig. 3E and SI Appendix, Fig. S7A), flow direction (Fig. 3F and SI Appendix, Fig. S7B), and polarization orientation (Fig. 3G and SI Appendix, Fig. S7C) across the leading edge showed striking local differences. The flow direction across the two observed parts of the leading edge, lamellipodium (marked lam in Fig. 3 E and F) and actin arcs (marked arcs in Fig. 3EandF), was mostly retrograde. However, 0
1000 2000 3000 4000 5000
intensity (pe)
φ
f=φ
e50 100 150 200 250
0
450 900 1350 1800 2250 2700 3150 3600 0
30 60 90 120 150 180
0.12-0.32 0.32- 0.4 0.4-0.49 0.49-0.79 450
1350 2250 3150 4050 4950
-90 -45 0 45
0 2 4 6 8 10
0 0.2 0.4 0.6 0.8
t=0
A
I
H
D
E
F
*
time(s)
polarization
factor
orientation-φf
(deg)
intensity
(photoelectrons)
φ
ep=1
*
distance (μm)
** **
** **
**
**
C
t=0...7s
B
*
orientation-φf
(deg)
intensity (photoelectrons)
count
polarization factor
G
#
F-actin
Fig. 2. Position and orientation of AF488-phalloidin bound to F-actin in vitro. (A) Fluorescence image of F-actin stained with AF488-phalloidin (2 nM in actin polymerization buffer) at the start of image sequence. (B) The image as inAwith orientations of polarized fluorescence shown by magenta lines. *Rep-resentative particle used to illustrate tracking of position, intensity, orientation, and polarization factor.#Measured orientation aligns with a straight stretch of the filament. (C) Positions of centroid of representative particle (* inB) over time connected by a black line. Hue of the dots represents the particle intensity in photoelectrons (pe; color map inInset). Centroids are overlaid on a magnified, averaged fluorescence image from the start to the end of the track. Dashed white line shows ensemble orientation (ϕe) of polarized fluorescence of the pixels comprising the particle over the first three frames. The ensemble
ori-entation is used to define the local filament oriori-entation (ϕf). (D) Kymograph of fluorescence particles along the long axis of the white rectangle inA. Position
of the particles in the filament is plotted in the vertical direction, and time is along the horizontal direction. The tracks of two particles are shown in magenta. *Representative particle identified inBandC. (E) Time-dependent intensity change of the representative particle. (F) Time-dependent orientation change of the representative particle relative to local filament orientationϕf. **When the ensemble reduces to a single fluorophore of AF488, its orientation remains
close to the filament orientation. (G) Polarization factor of the representative particle. **The polarization factor increases and becomes noisier when the ensemble reduces to single fluorophore. InE–G, the dotted lines show the intensity, orientation, and polarization factor after the track bleaches to the background, respectively. The uncertainty (±SD) in the measured quantities because of shot noise is shown by blue error bars at chosen time points. In some graphs, blue error bars are too small to be clearly visible. (H) Histogram of particle intensities over∼2,600 individual observations (60 tracked particles). Peaks at multiples of 450 photoelectrons (arrowheads) suggest the intensity of a single AF488. (I) Scatterplot of polarization orientation relative to filament axis vs. intensity for the same observations. Individual scatter points are colored by their polarization factorpaccording to legend. Total number of scatter points corresponds to the same number of individual observations inH. (Scale bars: white inAandB, 1μm; magenta inB, polarization factor=1;C, 100 nm.)
BIOPHYSIC
S
AND
COMPUTAT
IONAL
BIOLOGY
APPLIE
D
PHY
SICAL
SCIENCES
PNAS
the flow speed of 2–8 nm/s within actin arcs (Fig. 3E, arcs) was substantially lower compared with the flow speed of 10–15 nm/s within the actin meshwork in the lamellipodium (Fig. 3E, lam). The flow speeds and directions are consistent with earlier studies (7).
We observed highly oriented F-actin (Fig. 3G, red band-marked arcs) that forms the actin arcs (9) parallel to the leading edge. In contrast, the orientations of F-actin in the lamellipodium (Fig. 3G, green–cyan–blue band-marked lam) showed a more diverse angular distribution consistent with the meshwork ar-chitecture of actin filaments that has been studied with EM (28, 29). Our approach enabled direct measurement of local filament orientations relative to the flow direction (Fig. 3H) in regions of interest, such as the white dashed boxes within the lamellipo-dium in Fig. 3 F and G. We observed that the flow direction within the lamellipodium is narrowly distributed (Fig. 3H, green), whereas F-actin orientation is broadly distributed but is not isotropic (Fig. 3H, magenta). The region highlighted in Fig. 3F
and G spans both the Arp2/3-based dendritic network found within the first 1–2μm of the leading edge and more diversely oriented filaments farther away from the cell edge (28, 29). Thus, the F-actin orientation distribution that we observe is consistent with data reported with EM. We did not detect a significant number of tracks that moved across the transition zone between lamellipodium and actin arcs because of the disappearance of the particles during the tracking (SI Appendix, Fig. S7DandMovie S4). However, particles observed in the transition zone have a
lower polarization factor (SI Appendix, Fig. S7F), suggesting either increased angular fluctuations in AF488-phalloidin, a broader orientation distribution of actin filaments within each particle, or both. The angular fluctuations may arise from depolymerization of actin filaments, whereas the broader distribution can arise from cross-linking actin filaments by myosin motors (9), which eventu-ally cause contraction into actin arcs.
The above results illustrate the ability of our experimental and analysis methods to probe local order and polymerization of cytoskeletal filaments that give rise to complex micrometer-scale networks. Future analysis of motion, polymerization, orientation, intensity, and polarization factor as a function of distance from the leading or retracting edge promises to shed light on the or-ganization of molecular components of the contractile actomyosin network responsible for force generation during cell migration.
Tracking Position and Orientation of Septin-conGFP Particles in Septin Assemblies in Living Cells. We next applied our method to the septin cytoskeleton. Septins are GTP-binding proteins that self-assemble into heteromeric rods that anneal to form filaments in vitro and higher-order structures, such as fibers, bundles, and rings, at the plasma membrane of cells. Septin functions are di-verse and range from acting as scaffolds that concentrate sig-naling proteins to allowing cells to perceive membrane curvature (33, 34). Atomic structural models show that mammalian septins form nonpolar filaments (35). The nonpolar nature of septin t=0…20 min
-90 -60 -30 0 30 60 90
F-actin orientation relative to flow (degree)
0 0.02 0.04 0.06
frequency
0 30 60 90 120 150 180 210 240 Track duration (s)
-90 -60 -30 0 30 60
(degree)
mean flow flow
direction (ω) polarization orientation (φ)
s=25nm/s
D
E
F
G
H
t=4 min t=4 min
t=0…20 min t=0…20 min
t=0…20 min arcs
lam
arcs
lam
Flow direction Polarization orientation
arcs
lam cell body
leading edge
Flow speed
complexes is evolutionarily conserved, and the minimal octameric rod for yeast consists of four different subunits aligned in a palindromic order Cdc11-Cdc12-Cdc3-Cdc10-Cdc10-Cdc3-Cdc12-Cdc11 (36). In low-salt conditions, these rods can spon-taneously form long filaments and bundles. The organization of septin filaments that contained a constrained septin–GFP fusion has been studied previously by polarized fluorescence micros-copy in a filamentous fungus (A. gossypii) and budding yeast (Saccharomyces cerevisiae), revealing the striking rearrangement of septin filaments during division and septation (4, 5, 12, 13). The orientation of polarized fluorescence averaged over many fluorophores was found to (i) be polarized either parallel or per-pendicular to the symmetry axis of the assemblies that included hourglass, ring, bar, and fiber structures and (ii) change by 90° during cytokinesis. Based on our fluorescent single-molecule studies of septin with non-conGFP expressed inS. cerevisiaeandSchizosaccharomyces pombe, the minimum units in the cytosolic fraction of septins in fungi are octameric rods (37). Furthermore, our work has shown that octameric rods and larger filaments diffuse laterally on the plasma membrane and anneal to polymerize into higher-order structures (37). However, the specific arrangement and dynamics of septin rods and filaments within the higher-order structures have not been analyzed in live cells, although they have been observed with localization microscopy (38).
To gain additional insight into the molecular assembly of septin subunits into higher-order structures, we analyzed the polarized fluorescence of sparsely labeled septin assemblies us-ing the instantaneous FluoPolScope. By acquirus-ing and analyzus-ing time-resolved polarized fluorescence, we identified the dynamics of septin-GFP particles bound to septin bars at the cell mem-brane of the filamentous fungusA. gossypii. We studied the dy-namic orientation of septin subunits in living cells using two different fusions of septin with conGFP tags (SI Appendix, Notes
S10 and S11) (4, 5): Cdc12-conGFP4 and Cdc12-conGFP3. The
fluorescence of Cdc12-conGFP4, averaged over several fusion proteins bound to the same septin bundle, is polarized normal to the length of septin bundles (hereafter, this construct is referred to as Cdc12-conGFP⊥), whereas in Cdc12-conGFP3, which is missing one amino acid in the protein–GFP linker compared with Cdc12-conGFP4, the ensemble fluorescence is polarized parallel to the length of the bundles (hereafter, the construct is referred to as Cdc12-conGFP∥).
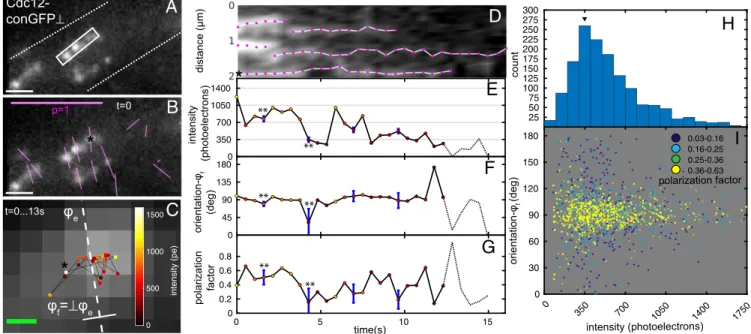
Fluorescently labeled septins in Ashbya expressing Cdc12-conGFP⊥appeared as bright particles on bars (bundles of septins) at the hyphal cortex (5), where septa would form in later stages of cell growth (Fig. 4A). The ensemble orientation of polarized fluorescence of these particles was mostly perpendicular to the longitudinal axis of bars (Fig. 4B) as was observed in our former studies. However, septin bundles exhibit bends. Therefore, similar to the in vitro F-actin (Fig. 2C), we defined the local bundle ori-entation (ϕf) as perpendicular to the ensemble orientation (ϕe)
averaged over the first five time points of tracked particles. We tracked the intensity, position, and orientation of fluo-rescent particles of Cdc12-conGFP⊥ until the fluorescence signals bleached down to the background level. Fluorescent particles, with positions that were tracked for more than 10 s, followed a random walk within a short distance of∼350 nm (Fig.
4CandDandMovie S6). Although exhibiting highly constrained
diffusive movements on the bars, the fluorescence of the particles bleached down to the background level (Fig. 4E). The histogram of fluorescence intensities of all particles (Fig. 4H) revealed that the typical intensity of a single particle was∼300–400 photoelec-trons, which corresponds to the intensity level before the last bleaching step (Fig. 4E). The orientation of polarized fluorescence of Cdc12-conGFP⊥ particles was perpendicular to the bar axis, irrespective of particle intensity, but occasionally deviated from 0
500 1000 1500
intensity (pe)
25 50 75 100 125 150 175 200 225 250 275 300
0
350 700 1050 1400 1750 0
30 60 90 120 150
180 0.03-0.16
0.16-0.25 0.25-0.36 0.36-0.63 0
350 700 1050 1400
0 45 90 135 180
0 5 10 15
0 0.2 0.4 0.6 0.8
t=0
A
I
H
D
E
F
*
time(s)
polarization
factor
orientation-φf
(deg)
intensity
(photoelectrons)
φ
ep=1
*
distance (μm)
** **
** ** **
**
C
t=0...13s
B
*
G
orientation-φ
f
(deg)
intensity (photoelectrons)
count
polarization factor
φ
f=
⊥
φ
eCdc12-conGFP⊥
Fig. 4. Position and orientation of single septin-conGFP⊥particles in liveA. gossypii. Data are presented in the same way as in Fig. 2. (A) Fluorescence images of septin-conGFP⊥expressed inA. gossypii. (B) The same fluorescence image inAwith fluorescence polarization orientations indicated by magenta lines measured at the start of an image sequence. The ensemble orientation (ϕe) of polarized fluorescence of particles is roughly perpendicular to the visible long axis of slightly bent
septin bars. The local orientation of septin bars (ϕf) is defined to be perpendicular to local ensemble orientation. (C) Positions of centroid of representative particle
(* inA) over time. Color of particles indicates intensity in photoelectrons (pe). (D) Kymograph of fluorescence particles along the long axis of the white rectangle inA. Time-dependent changes of intensity, orientation, and polarization factor of representative particle are plotted over time inE–G, respectively. Blue error bars represent SDs caused by shot noise. **This particle exhibits change in polarization factor and orientation synchronous with drop to single-molecule intensity that cannot be explained by uncertainty caused by shot noise. (H) Histogram of particle intensities before they bleached to the background from 1,200 particle ob-servations (52 tracks). The histogram suggests that the single septin-conGFP⊥’s intensity is∼350 photoelectrons. (I) Scatterplot of orientation (relative toϕf) vs.
intensity (above background) of the same particles. (Scale bars: white inB, 1μm; magenta inB, polarization factor=1; green inC, 100 nm.)
BIOPHYSIC
S
AND
COMPUTAT
IONAL
BIOLOGY
APPLIE
D
PHY
SICAL
SCIENCES
PNAS
by the uncertainty caused by shot noise. Some of these fluctua-tions in orientation (** in Fig. 4F) are synchronous with reduc-tion in polarizareduc-tion factor (** in Fig. 4G) and might be caused by wobble of the fluorophores arising from displacement of the septin subunits or the flexibility of the underlying septin struc-ture. As seen from Fig. 4I, the orientation of bright particles with a high number of septin-conGFP molecules fluctuated little around the filament orientations, whereas fluctuations in orien-tation increased at the single-molecule level. Furthermore, par-ticles with orientation that was different from the filament orientation exhibited reduction in polarization factor.
Cdc12-conGFP∥constructs expressed inAshbyawere imaged under the same conditions as Cdc12-conGFP⊥constructs. The ensemble polarization orientation of this construct was parallel (SI Appendix, Fig. S8AandB) to the longitudinal axis of the bars as observed previously (4, 5). The intensity histogram showed a peak at 350 photoelectrons per frame (SI Appendix, Fig. S8H). The intensity of the representative particle (SI Appendix, Fig. S8E) fluctuated around 350 photoelectrons before bleaching to the background level. Thus, the single GFP intensity for Cdc12-conGFP∥was consistent with the intensity for Cdc12-conGFP⊥ construct. Similar to our observations in Cdc12-conGFP⊥, the particles showed highly constrained diffusive motion on the septin bars as shown inSI Appendix, Fig. S8CandDandMovie S7. The orientation of polarized fluorescence in the representative Cdc12-conGFP∥particle shown inSI Appendix, Fig. S8FandIwas mostly aligned with the bar orientation, even at single-molecule intensity. The polarization factor of this representative particle remained constant (SI Appendix, Fig. S8G) at the single-molecule level in contrast to the representative Cdc12-conGFP⊥ particle shown in Fig. 4G.
We also evaluated the possibility that fluctuations of individual septin-GFP particles are caused by the movement of the un-derlying septin structure, the whole cell, or even drift of the microscope stage. However, because the motion of multiple septin-GFP particles in proximity of one another was observed to be asynchronous (Movies S6 and S7), we concluded that the observed motion of septin-GFP reflected the motion of indi-vidual septin filaments.
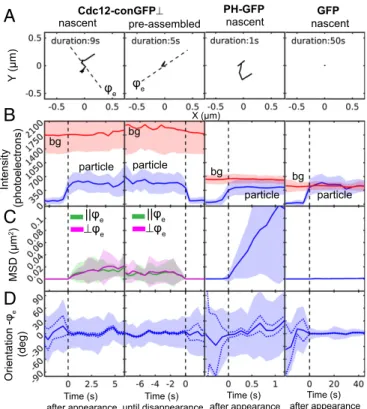
Statistical Analysis of the Motion and Orientation of Single Septin-GFP Molecules on Septin Assemblies.We next sought to examine the constrained diffusion in both position and orientation no-ticed for septin complexes within assemblies. To do so, we com-puted the mean and SD of fluctuations in intensity, position, and orientation of several septin-GFP particles.
To test whether the observed fluctuations depend on the du-ration over which septin subunits are incorporated into the struc-ture, we discriminated between particles (SI Appendix, Note S8) already assembled into septin bars (preassembled particles) and those that attach to septin bars during the observation time (nascent particles). Nascent Cdc12-conGFP⊥ particles typically contained only a single GFP molecule. We analyzed preassembled Cdc12-conGFP⊥particles only if their fluorescence was tracked down to the single GFP level, thereby analyzing comparable intensities between the two particle types. As a control for mobile particles with GFP, we analyzed fluctuations of a fusion protein consisting of the Pleckstrin Homology (PH) domain from phospholipase C-γ, glutathioneS-transferase (GST), and GFP expressed inAshbya. This fusion protein, called PH-GFP, binds to phosphatidylinositol lip-ids and undergoes lateral diffusion on the cytoplasmic side of the cell membrane. Because the GST tag associated with PH-GFP dimerizes with a dissociation constant as low as 1 nM (39), dimerized PH-GFP is expected to be the dominant form in our expression condition. As an immobile control, we used individual GFP particles bound to poly-D-lysine–coated coverslips in our in vitro experiment shown in Fig. 1. Because filament orientation
ments, the time-resolved fluctuations are analyzed relative to the ensemble orientation (ϕe) of each particle over the first three
observations for all three constructs.
Representative trajectories of nascent and preassembled Cdc12-conGFP⊥, PH-GFP bound to the cell membrane, and in vitro GFP bound to a poly-D-lysine–coated coverslip (Fig. 5A) showed the following: PH-GFP exhibited unconstrained mobility because
Orientation -φ
e
(deg)
Intensity
(photoelectrons)
A
Cdc12-conGFP⊥ PH-GFP GFPB
C
D
MSD (μm
2)
bg
particle
bg
particle
||φe ⊥φe
Time (s) after appearance
pre-assembled
nascent nascent nascent
Time (s) after appearance
Time (s) after appearance Time (s)
until disappearance
Y
(μm)
bg
particle particle
bg φe
X (μm)
||φe
⊥φe
φe
Fig. 5. Fluctuation analysis of orientation, position, and intensity of Cdc12-conGFP⊥, PH-GFP, and GFP particles. Cdc12-conGFP⊥s were imaged contin-uously with 500-ms exposure and 1.1-μW/μm2 laser power, PH-GFPs were imaged continuously with 100-ms exposure and 5.5-μW/μm2laser power, and GFP on poly-D-lysine–coated coverslip was imaged at 5-s intervals with 500-ms exposure and 1.1-μW/μm2 laser power only during exposure. (A) Trajectories of representative particles. Nascent or newly bound Cdc12-conGFP⊥to septin bars, Cdc12-conGFP⊥s that were preassembled in septin bars, nascent PH-GFP inAshbya, and nascent in vitro GFP bound to the surface of glass coverslips in columns 1–4, respectively. For nascent Cdc12-conGFP⊥, PH-GFP, and in vitro GFP, trajectories are shown from the time that they arrive within the TIR depth to their disappearance. For preassembled Cdc12-conGFP⊥, the trajectory is shown back in time from the time of dis-appearance. The dashed lines in Cdc12-conGFP⊥plots show the ensemble polarization orientationϕeat the start of the acquisition;ϕeis computed
by averaging particle intensities in the first three frames of the track. (B–D) Fluctuations in intensity, position, and orientation, respectively. Fluc-tuations were analyzed across the ensemble ofnparticle tracks aligned at the frame of appearance or the frame of disappearance:n=48 for nascent Cdc12-conGFP⊥,n=52 for preassembled Cdc12-conGFP⊥,n=58 for PH-GFP, andn=95 for GFP. Unlike Figs. 2Iand 4I, the fluctuations are analyzed relative to the ensemble orientation (ϕe), because filament orientation (ϕf) is
not applicable to PH-GFP and immobile GFP measurements. (B) Mean (solid line) and SD (shaded area around mean) of particle intensity (blue) and background (bg) intensity (red) among the aligned tracks. (C) Mean and SD of squared displacement relative the position att=0. For Cdc12-conGFP⊥, the vector squared displacement is partitioned into components parallel (jjϕe) and perpendicular (⊥ϕe) to the ensemble orientation. (D) Mean and
of the fluidic nature of the membrane. Compared with the mo-bility of PH-GFP, diffusive motions of both nascent and pre-assembled Cdc12-conGFP⊥were constrained within a distance <350 nm. Furthermore, GFP bound to a coverslip was constrained within 25 nm during 50 s of measurement time. Therefore, ob-served positional fluctuations of Cdc12-conGFP⊥and PH-GFP particles cannot be attributed to shot noise or stage drift of our imaging system.
We next compared the intensities of nascent and preassembled Cdc12-conGFP⊥ particles with intensities of PH-GFP and GFP particles (Fig. 5B). In all measurements, the total excitation energy per frame was the same, and we found that the averaged intensities were similar, within a range between 350 and 700 photoelectrons. PH-GFP particles exhibited fluorescence corresponding to 1xGFP (350 photoelectrons) or 2xGFP (700 photoelectrons), with en-semble average of∼500 photoelectrons, reported in Fig. 5B, col-umn 3, that is consistent with the estimated number of GFP in PH-GFP particles expressed inS. pombeas reported in our earlier work (37). The fluorescence intensity at the location of particle appearance (Fig. 5B), measured just before the time of appearance
t = 0, was the same as the background for nascent Cdc12-conGFP⊥ and PH-GFP particles. At t = 0, the intensity in-creased to one or two times the single GFP intensity. Because there are two copies of Cdc12 in a single octameric rod and the corresponding fluorescent particle should have either one or two Cdc12-conGFPs, the intensity of nascent Cdc12 particles is consistent with an octameric rod that binds to the cortex from the cytosol as previously observed in vitro (37).
To analyze fluctuations in position, we computed squared displacements of particles relative to their position at the time of appearance for nascent particles or relative to their position at disappearance for preassembled particles (Fig. 5C). The squared displacement of Cdc12-conGFP⊥ particles was resolved along directions parallel (jjϕe) and perpendicular (⊥ϕe) to the ensemble
polarization orientation of each particle. The mean squared dis-placement (MSD) of PH-GFP particles increased over time with a nearly constant slope, suggesting simple 2D diffusion over the time period of 1 s. The MSD of GFP particles stays near zero for 60 s, confirming their immobile attachment to poly-D-lysine–coated glass coverslips and the stability of the microscope setup. The MSD of both nascent and preassembled Cdc12-conGFP⊥particles exhibited a slope that reduces over time, suggesting confined dif-fusion. Resolving the motion of the Cdc12-conGFP⊥ particles parallel and perpendicular to the length of septin assembly did not provide evidence for a dominant direction of diffusive motion with respect to the orientation of the assembly over a 6-s duration.
To validate our finding of positional fluctuations of septin-GFP particles, we analyzed positional fluctuations of another septin-GFP construct, Cdc11-GFP, expressed inAshbya. In this construct, GFP is not constrained in orientation with respect to Cdc11, another subunits in the septin octamer (34). We found that fluctuations in intensity and position of Cdc11-GFP particles were nearly identical to Cdc12-conGFP⊥, further confirming that the minimum unit of assembly is an octamer (SI Appendix, Fig. S9B) and that septin octamers undergo constrained diffusion in the larger assembly (Movie S8), indicating that this behavior is not a consequence of constraining the fluorescent tag (SI Appendix, Fig. S9C).
We estimated the size of a“corral”that confines septin-GFP and the diffusion coefficient within the corral using a widely used model of confined diffusion of membrane receptors (40). Using this model, we estimated the diffusion coefficientD (microme-ters2second−1) within the corral by fitting a line to MSD vs. time data (t) neart=0 (Fig. 5CandSI Appendix, Fig. S10) according to the relationshipMSD = 4Dt. The corral size (L) and the asymptotic value of MSD (MSDmax) are related by L2/6 =
MSDmax. As shown inSI Appendix, Fig. S10,D=0.03μm2s−1 for PH-GFP, whereas D = 0.003 μm2 s−1 for preassembled
Cdc12-conGFP⊥and Cdc11-GFP particles. Note that we added MSD along and perpendicular to the ensemble orientation to-gether to estimate the diffusion coefficient of Cdc12-conGFP⊥. Thus, our data indicate that septin-GFP particles experience confined diffusion that is an order of magnitude slower than diffusion experienced by PH-GFP. The corral size (L) for Cdc12-conGFP⊥was estimated to be 350 nm, and for Cdc11-GFP, it was estimated to be 250 nm. With the caveat that the chosen motion model is the first approximation of the motion of septin-GFP, we infer that the lateral extent over which the septin-GFP can move near the binding site is an order of magnitude longer than the length of a single septin octamer (32 nm).
We calculated the mean orientation and the spread of the orientations (SI Appendix, Note S12 and Fig. S11) across selected tracks as a function of time as well as shot noise-induced uncertainty in mean orientation (SI Appendix, Note S5). The polarization ori-entation of preassembled and nascent Cdc12-conGFP⊥ particles (Fig. 5D) remained along the ensemble fluorescence polarization of the underlying septin bars. However, the orientations fluctuated in time, exhibiting a large spread (∼30°) (blue patch in Fig. 5D, column 1) that cannot be explained by uncertainty caused by shot noise (dashed line in Fig. 5D, column 1). This finding indicates that the orientation of Cdc12-conGFP⊥ particles themselves fluctuates in time while bound to the septin bars. However, the orientation of Cdc11-GFP before and after binding fluctuates widely (SI Appendix,
Fig. S9D), because GFP was not constrained to Cdc11. The
ori-entation of PH-GFP particles also varied widely and after bound to the membrane, fluctuated randomly. For GFP molecules that were bound to the surface of poly-D-lysine–coated glass cover-slips, angular fluctuations after binding were less than 10°.
To check if the fluctuations in orientation and position of septin-conGFP are consistent after repeated imaging of the same structure, we bleached the same septin bars up to five times, each time followed by a recovery period of 2–10 min (SI Appendix,
Fig. S12). The structural integrity of septin bars after repeated
bleaching and observation of fluctuations in the orientation be-tween two septin-conGFP constructs indicate that the observed dynamics of GFP dipoles reflect bona fide dynamics of septin subunits and do not reflect artifacts induced by imaging.
The above observations identify two remarkable features of septin-GFP molecules bound to micrometer-scale septin as-semblies when analyzed with the instantaneous FluoPolScope. First, the Cdc12-conGFP and Cdc11-GFP particles exhibited confined movement in position that is an order of magnitude slower than diffusion of the model membrane protein PH-GFP, whereas the corral size is an order of magnitude larger than the length of a single-septin octamer. Second, the ensemble mean ori-entation across many septin-conGFP particles remained consistent as they bleached from multiple to single fluorophores, albeit exhibiting fluctuations in the orientation larger than possible only from shot noise. The consistency of polarized fluorescence orientation even down to a single fluorophore is compatible with but not predicted by the earlier studies of ensemble polarized fluorescence from densely labeled septin structures (5, 13). Fluctuations in both position and orientation of septin-GFP can arise from either the flexibility of polymerized septin filaments or the movement of the subunits within the polymeric scaffold. We speculate that the movements that we see may be caused by a combination of fragmentation and annealing events of filaments that are bundled together into a septin bar. Additional analysis of motion, intensity, orientation, and polarization factor of septin-GFP constructs in live cells over longer timescales has the po-tential to address the questions of how septin assemblies form the observed diversity of structures and how they can undergo large-scale rearrangements during cytokinesis (4, 5).
BIOPHYSIC
S
AND
COMPUTAT
IONAL
BIOLOGY
APPLIE
D
PHY
SICAL
SCIENCES
PNAS
We are reporting the design, implementation, and application of an instantaneous FluoPolScope using isotropic TIR excitation and instantaneous imaging along four equally spaced polariza-tion orientapolariza-tions. The key advantages of our method over earlier methods are the ability to report molecular orientation of dy-namic assemblies of arbitrary symmetry and its robustness to background fluorescence typically observed in live cells. High background fluorescence can limit the accuracy of molecular orientation measurement in living cells as clarified in the paper. The robustness to background fluorescence is achieved using TIR excitation and single-particle analysis algorithms that take into account remaining spatially variable background. The instan-taneous acquisition and temporal tracking of intensity, position, and orientation of fluorescently labeled molecules allow us to study structural dynamics of mobile molecules at 10 Hz. This computa-tional analysis should enable study of a variety of questions that require dissection of subresolution molecular order, including structural organization of DNA in chromosomes, morphological changes in cellular membrane, and dynamic assembly/disassembly of the cytoskeletal networks. Our method is still limited by its inability to report the tilt angle of dipoles (zaxis component of the dipole distribution), because polarization-resolved measure-ment within the XY plane is sensitive only to the projection of polarized fluorescence on the focal plane. This limitation will be overcome in the future by rapid switching of the intensity of the
z axis component of polarized excitation while acquiring the polarization-resolved emission.
We used the instrument and the complementary algorithms to analyze the time-resolved orientation of single molecules in vitro and in living cells. In vitro, we showed the orientation of individual TOTO-1 fluorophores that intercalated into combed DNA and had fluorescence that is polarized perpendicular to the DNA axis, consistent with the known atomic structure of the complex. Analysis of in vitro actin filaments labeled with AF488-phalloidin showed that the polarization orientation of even a single fluorophore reliably reports the local orientation of the actin filament to which it is bound. By sparsely labeling actin network with AF488-phalloidin, we provided a demonstration of analysis of local orientation of actin filaments relative to retro-grade flow at the leading edge in live cells. Our findings are con-sistent with previous studies of actin filament orientation using EM and actin network flow using fluorescent speckle microscopy. The 100-ms temporal resolution, 25-nm localization accuracy, and shot noise limited accuracy of 3° in the measured orientation of single molecules allowed us to analyze dynamic position and orientation of individual septin proteins during their interactions with larger assemblies in living cells. Our single-molecule position analysis revealed that septin octamers undergo a confined random walk, which is an order of magnitude slower than other membrane-associated proteins. Moreover, the orientation analysis revealed that the orientation of septin-GFP fluctuates around the net ori-entation of the underlying septin assembly.
Methods
Isotropic TIR Excitation.We use a circularly polarized laser beam that is ro-tated in the BFP of the objective (18) with rotation frequency higher than 300 Hz to achieve isotropic illumination at the specimen plane (Fig. 1B). We used TIR to produce isotropic 3D excitation as illustrated in Fig. 1B. The radius of the annulus in the BFP was adjusted, such that the collimated laser reached the specimen plane beyond the critical angle required for TIR. Circularly symmetric TIR excitation with circularly polarized light leads to equal amounts of p- and s-polarized excitation over 360°. Integrating the eva-nescent field components along thex,y, andzaxes under this symmetric illumination scheme shows that the intensity of the field component along thezaxis is∼8% less than the intensity components along thexandyaxes. A laser beam (DPSS laser BCD; 488 nm; Melles Griot) was circularly polarized by a quarter-wave plate (WPQ-4880–4M; Sigma-koki) and focused into the BFP of the objective lens (PlanApo TIRF 100×1.49 N.A. oil; Nikon) on an
plane was 5.7μW/μm2when no neutral density filter was inserted into the light path. The beam was scanned along a circular annulus in the BFP using a pair of galvo-scanned mirrors (GVS202; Thorlabs).
Instantaneous Polarization Analysis Along Four Orientations. Polarization analysis in the aperture space ensures that fluorophores are subjected to identical optical analysis irrespective of their position in the specimen plane. We do so (Fig. 1B) by recollimating the light originating from the primary image plane of the microscope, splitting the emission according to polari-zation, and finally, focusing onto the four quadrants of an EMCCD camera (iXon+; Andor Technology). In the collimated space, the fluorescence is first divided equally between two arms by a polarization independent beam splitter (50/50 in Fig. 1B) (21014; Chroma Technology). A pair of polarization beam splitters (labeled PBS in Fig. 1B) (Semrock) separates the fluorescence into four images and analyzes their linear polarization along 0°, 45°, 90°, and 135° orientations. One polarization beam splitter generates 0° and 90° polarization beam paths, whereas the polarization in the other arm is first rotated by 45° using a half-wave plate (HWP) (Fig. 1B) (Meadowlark Optics NH-532) and then passed through the other polarization beam splitter to generate the 45° and 135° paths. Subsequently, we use broadband mirror-based beam-steering optics and a focusing lens (FL) (Fig. 1B) to project four images onto the four quadrants of a single EMCCD detector. The collimating lens and FL together magnify the image by 1.5×. We acquire data using a 100×1.49 N.A. objective lens and 1.5×tube lens, leading to a total magni-fication of 225×between the specimen and the camera. The width of the camera pixel is 16μm, leading to the pixel size at the specimen plane of 70 nm, which provides slightly better than Nyquist sampling of the point spread function.
Registration of Four Quadrants and Intensity Calibration.All algorithms were developed in MATLAB and are available on request.
To register the quadrants, we recorded images of fluorescent latex beads (diameter, 0.12μm; Life Technologies) spread on the surface of a glass coverslip (SI Appendix, Fig. S2A). After cropping raw camera frames into quadrants, intensity-based optimization (MATLAB’s imregister function) was used to compute affine transformations that minimize intensity differences among quadrants. A sensitive readout of achieving subpixel registration between the four quadrants is the disappearance of a systematic polariza-tion pattern for a sample like the latex beads that must not show any po-larization. As shown inSI Appendix, Fig. S2B, our approach achieves registration with subpixel accuracy.
To normalize differences in transmission efficiency between the four imaging paths, we imaged a 20-μM fluorescein solution excited by uniform isotropic polarization illumination from a 100-W tungsten halogen lamp through an excitation filter (Semrock FF02 473/30). Using the isotropic nature of fluorescence polarization from a solution of randomly oriented fluorescein molecules, we generated correction images that, when multiplied with raw sample images, compensated the position-dependent differences of the trans-mission efficiency in the four-quadrant polarization optics.
Subsequently, we calibrated polarization-dependent intensity differences caused by unbalanced extinction factors of the polarization optics using the approach of calibrating an industrial polarimeter (41). In this approach, polarized light at several known states is presented to the optical system, and recorded intensities are analyzed to compute an“instrument matrix” that converts Stokes parameters of known polarization states to recorded intensity. As a specimen with a known pattern of polarization transmission, we used a tangential polarizer (Photonic Lattice Inc.) with a polarization transmission axis that is tangentially aligned along concentric circles (SI Appendix, Note S2 and Fig. S2C).
By using these three calibration objects, namely fluorescent beads, a fluorescein solution, and a tangential polarizer, we have obtained regis-tration with subpixel accuracy and correction factors for compensating transmission differences and balanced the extinction differences of the four polarization-sensitive light paths.
Finally, we calibrated isotropic TIR excitation by minimizing the fluores-cence polarization from immobilized fluorescent beads absorbed to the surface of glass coverslips, because any biased polarization in the illumination caused a fluorescence polarization signal from immobilized fluorescent beads. We manually tuned the HWP and the quarter-wave plate that were located in the excitation illumination path, so that the polarization factors of imaged fluorescent beads were minimized.
polarization factor (p), and the orientation (ϕ) of its maximum polarization. The particle intensity recorded in each quadrant is related to the average intensity across the four quadrants (I), polarization factor, orientation, and background intensity (Ibg) as follows (22):
In=I½1+pCosð2n−2ϕÞ+Ibg, [1]
wheren=0°, 45°, 90°, 135°.
Retrieval of the orientation and polarization factor of particles is effi-ciently expressed in terms of the Stokes parameters of the polarization-resolved emission:
S0=0.25ðI0+I45+I90+I135Þ−Ibg=I, S1=I0−I90, S2=I45−I135. [2] Although the estimates ofS1,S2 are independent of the isotropic back-ground intensityIbg, their uncertainty is impacted by the shot noise of the background.
The above relationship can be written in matrix form asS=MðI−IbgÞ, where, I=½I0, I45, I90, I135T
is the column vector of input intensities, S=½S0,S1,S2Tis the column vector of Stokes parameters, andM, called in-strument matrix, is the matrix of coefficients that relate these two vectors according to Eq.2. The matrixMin the above equation is replaced by the instrument matrix that is generated using the tangential polarizer as de-scribed inSI Appendix, Note S2.
The total particle intensity (in photoelectrons), polarization factor (di-mensionless between zero and one), and ensemble orientation (in radian) are obtained from Stokes parameters as follows:
It=4S0=4I, p=
ffiffiffiffiffiffiffiffiffiffiffiffiffiffiffiffiffiffiffi
S12+S22 p
2S0
, ϕ=0.5 tan−1 S
2 S1
. [3]
During a camera exposure, a range of dipole orientations is observed because of several factors: rotational wobble of a single dipole caused by flexible linkers to the structure of interest or motion of the structure itself in live cells.
ACKNOWLEDGMENTS. We acknowledge helpful discussions with Andrew Bridges, Hari Shroff, Vinay Swaminathan, Clare Waterman, Michael Shribak, Takayuki Nishizaka, Takeharu Nagai, and many of our summer collaborators at the Marine Biological Laboratory. This work was supported by Human Frontier Science Program Grant LT000096/2011-C (to S.B.M.); 2014 Neal Cornell Career Development Award (to S.B.M.); 2015 Marine Biological Laboratory–University of Chicago Collaboration Award (to S.B.M.); NIH Grants T32 GM008704 (to M.M.), R01 GM114274 (to R.O.), and R01 GM100160 (to T.T.); National Science Foundation Grant MCB 1212400 (to A.S.G.); Whitman Summer Investigator Award (to A.S.G.); and Marine Biological Laboratory start-up funds from the Inoue Family Endowment (to T.T.). We thank the Japan Science and Technology Agency Precursory Research for Embryonic Science and Technology (PRESTO) Program, which had supported the early phase of this research and generously offered us essential optical instruments.
1. Sharma P, et al. (2004) Nanoscale organization of multiple GPI-anchored proteins in living cell membranes.Cell116(4):577–589.
2. Kampmann M, Atkinson CE, Mattheyses AL, Simon SM (2011) Mapping the orienta-tion of nuclear pore proteins in living cells with polarized fluorescence microscopy. Nat Struct Mol Biol18(6):643–649.
3. Anantharam A, Onoa B, Edwards RH, Holz RW, Axelrod D (2010) Localized topological changes of the plasma membrane upon exocytosis visualized by polarized TIRFM. J Cell Biol188(3):415–428.
4. DeMay BS, Noda N, Gladfelter AS, Oldenbourg R (2011) Rapid and quantitative im-aging of excitation polarized fluorescence reveals ordered septin dynamics in live yeast.Biophys J101(4):985–994.
5. DeMay BS, et al. (2011) Septin filaments exhibit a dynamic, paired organization that is conserved from yeast to mammals.J Cell Biol193(6):1065–1081.
6. Watanabe N, Mitchison TJ (2002) Single-molecule speckle analysis of actin filament turnover in lamellipodia.Science295(5557):1083–1086.
7. Ponti A, Machacek M, Gupton SL, Waterman-Storer CM, Danuser G (2004) Two dis-tinct actin networks drive the protrusion of migrating cells.Science305(5691): 1782–1786.
8. Yam PT, et al. (2007) Actin-myosin network reorganization breaks symmetry at the cell rear to spontaneously initiate polarized cell motility.J Cell Biol178(7):1207–1221. 9. Burnette DT, et al. (2011) A role for actin arcs in the leading-edge advance of
mi-grating cells.Nat Cell Biol13(4):371–381.
10. Inoué S, Shimomura O, Goda M, Shribak M, Tran PT (2002) Fluorescence polarization of green fluorescence protein.Proc Natl Acad Sci USA99(7):4272–4277.
11. Rosell FI, Boxer SG (2003) Polarized absorption spectra of green fluorescent protein single crystals: Transition dipole moment directions.Biochemistry42(1):177–183. 12. Vrabioiu AM, Mitchison TJ (2006) Structural insights into yeast septin organization
from polarized fluorescence microscopy.Nature443(7110):466–469.
13. Vrabioiu AM, Mitchison TJ (2007) Symmetry of septin hourglass and ring structures. J Mol Biol372(1):37–49.
14. Abrahamsson S, et al. (2015) MultiFocus Polarization Microscope (MF-PolScope) for 3D polarization imaging of up to 25 focal planes simultaneously.Opt Express23(6): 7734–7754.
15. McQuilken M, et al. (2015) Polarized fluorescence microscopy to study cytoskeleton assembly and organization in live cells.Curr Protoc Cell Biol67:4.29.1–4.29.13. 16. Forkey JN, Quinlan ME, Goldman YE (2005) Measurement of single macromolecule
orientation by total internal reflection fluorescence polarization microscopy.Biophys J89(2):1261–1271.
17. Sosa H, Peterman EJG, Moerner WE, Goldstein LSB (2001) ADP-induced rocking of the kinesin motor domain revealed by single-molecule fluorescence polarization mi-croscopy.Nat Struct Biol8(6):540–544.
18. Nishizaka T, et al. (2004) Chemomechanical coupling in F1-ATPase revealed by si-multaneous observation of nucleotide kinetics and rotation.Nat Struct Mol Biol11(2): 142–148.
19. Valades Cruz CA, et al. (2016) Quantitative nanoscale imaging of orientational order in biological filaments by polarized superresolution microscopy.Proc Natl Acad Sci USA113(7):E820–E828.
20. Ohmachi M, et al. (2012) Fluorescence microscopy for simultaneous observation of 3D orientation and movement and its application to quantum rod-tagged myosin V.Proc Natl Acad Sci USA109(14):5294–5298.
21. Sase I, Miyata H, Ishiwata S, Kinosita K, Jr (1997) Axial rotation of sliding actin fila-ments revealed by single-fluorophore imaging. Proc Natl Acad Sci USA94(11): 5646–5650.
22. Fourkas JT (2001) Rapid determination of the three-dimensional orientation of single molecules.Opt Lett26(4):211–213.
23. Mutch SA, et al. (2007) Deconvolving single-molecule intensity distributions for quantitative microscopy measurements.Biophys J92(8):2926–2943.
24. Toprak E, et al. (2006) Defocused orientation and position imaging (DOPI) of myosin V.Proc Natl Acad Sci USA103(17):6495–6499.
25. Lieb MA, Zavislan JM, Novotny L (2004) Single-molecule orientations determined by direct emission pattern imaging.J Opt Soc Am B21(6):1210–1215.
26. Spielmann HP, Wemmer DE, Jacobsen JP (1995) Solution structure of a DNA complex with the fluorescent bis-intercalator TOTO determined by NMR spectroscopy. Biochemistry34(27):8542–8553.
27. Jaqaman K, et al. (2008) Robust single-particle tracking in live-cell time-lapse se-quences.Nat Methods5(8):695–702.
28. Svitkina TM, Borisy GG (1999) Arp2/3 complex and actin depolymerizing factor/cofilin in dendritic organization and treadmilling of actin filament array in lamellipodia. J Cell Biol145(5):1009–1026.
29. Koestler SA, et al. (2013) Arp2/3 complex is essential for actin network treadmilling as well as for targeting of capping protein and cofilin.Mol Biol Cell24(18):2861–2875. 30. Gittes F, Mickey B, Nettleton J, Howard J (1993) Flexural rigidity of microtubules and actin filaments measured from thermal fluctuations in shape.J Cell Biol120(4): 923–934.
31. Boukamp P, et al. (1988) Normal keratinization in a spontaneously immortalized aneuploid human keratinocyte cell line.J Cell Biol106(3):761–771.
32. Tani T, et al. (2005) Trafficking of a ligand-receptor complex on the growth cones as an essential step for the uptake of nerve growth factor at the distal end of the axon: A single-molecule analysis.J Neurosci25(9):2181–2191.
33. Bridges AA, Gladfelter AS (2015) Septin form and function at the cell cortex.J Biol Chem290(28):17173–17180.
34. Bridges AA, Jentzsch MS, Oakes PW, Occhipinti P, Gladfelter AS (2016) Micron-scale plasma membrane curvature is recognized by the septin cytoskeleton.J Cell Biol 213(1):23–32.
35. Sirajuddin M, et al. (2007) Structural insight into filament formation by mammalian septins.Nature449(7160):311–315.
36. Bertin A, et al. (2008) Saccharomyces cerevisiae septins: Supramolecular organization of heterooligomers and the mechanism of filament assembly.Proc Natl Acad Sci USA 105(24):8274–8279.
37. Bridges AA, et al. (2014) Septin assemblies form by diffusion-driven annealing on membranes.Proc Natl Acad Sci USA111(6):2146–2151.
38. Kaplan C, et al. (2015) Absolute arrangement of subunits in cytoskeletal septin fila-ments in cells measured by fluorescence microscopy.Nano Lett15(6):3859–3864. 39. Fabrini R, et al. (2009) Monomer-dimer equilibrium in glutathione transferases: A
critical re-examination.Biochemistry48(43):10473–10482.
40. Kusumi A, Sako Y, Yamamoto M (1993) Confined lateral diffusion of membrane re-ceptors as studied by single particle tracking (nanovid microscopy). Effects of calcium-induced differentiation in cultured epithelial cells.Biophys J65(5):2021–2040. 41. Azzam RMA (1982) Division-of-amplitude photopolarimeter (DOAP) for the
simulta-neous measurement of all four Stokes parameters of light.J Mod Opt29(5):685–689.
BIOPHYSIC
S
AND
COMPUTAT
IONAL
BIOLOGY
APPLIE
D
PHY
SICAL
SCIENCES
PNAS