A
BSTRACTI
NTRODUCTIONDiabetes is a group of metabolic diseases characterized by impaired insulin production by pancreatic beta cells. To mitigate or avoid serious complications of diabetes (e.g., coma, limb amputation, blindness) that are associated with poor blood glucose management, diabetics must regularly self-monitor blood glucose levels.1 Self-monitoring has traditionally been accomplished using portable
“finger prick” glucometers; however, this method is unable to provide frequent enough monitoring to manage glucose levels in a way that minimizes or avoids the negative effects of hyperglycemia and hypoglycemia. The ability to monitor blood glucose levels continuously, rather than at set time points, is thus critical to managing diabetes and improving overall health. Specifically, a continuous glucose monitor would allow diabetics to effectively adjust their diet and exercise routines to ensure their blood glucose levels remain in the appropriate range (~4–6 mM).
While implantable glucose monitors that operate in subcutaneous tissue have been developed and approved for implantation in humans, they are not without limitations.2 A major shortcoming of all implantable glucose sensors is diminished in vivo analytical performance as a consequence of the foreign body response (FBR). Initiated in response to damaged vascularized tissue, the FBR consists of a physiological cascade that begins with protein adsorption to the implant and ultimately the recruitment of inflammatory cells (e.g. neutrophils, macrophages). As macrophages attempt to digest the implant without success, the site becomes perpetually inflamed and macrophages fuse into foreign body giant cells (FBGC) at the tissue/implant interface. The inability to digest the implant results in a release of cytokines by the FBGCs, which causes fibroblasts to deposit collagen around the implant. The resulting avascular capsule sequesters the implant from the surrounding tissue and consequently obstructs the diffusion of interstitial glucose to the sensor. Over time, sensor sensitivity diminishes and device failure often ensues.3,4
that the release of NO into the tissue surrounding the implantable device is a viable strategy for mitigating the foreign body response and improving sensor analytical performance.3-8 Hetrick et al. implanted
subcutaneous NO-releasing xerogels in a murine model and observed that the NO-releasing implants, which generated ~1.35 µmol cm-2 NO over 72 h at fluxes greater than 1 pmol cm-2 s-1, exhibited reduced
fibrous encapsulations (>25%) after 3 and 6 weeks compared to control implants. Nichols et al. used percutaneously implanted microdialysis probes that released constant fluxes of NO to assess glucose probe recovery as a function of time. The NO-releasing probes exhibited near constant glucose recovery, while control probes exhibited significantly diminished glucose recovery after a 1-week implant period. Subsequent histological analysis of the tissue surrounding the probes revealed fewer inflammatory cells and a reduced fibrous capsule compared to the control probes. Soto et al. percutaneously implanted NO-releasing needle-type glucose biosensors with varied NO-release durations (16 h and > 3 d) in a porcine model and observed that greater glucose sensor sensitivities and decreased error corresponded well with the NO-release kinetics; sensor performance improved during periods of NO release, but performance was similar to control sensors after the NO had been exhausted. In all of the research mentioned above, at least three days of NO release was required to influence long-term tissue response. 3,4,9
The reported average sensitivity and NO-release duration for the aforementioned sensor experiments were 1-2 nA and 16 h, respectively. Of note, although a separate sensor composition released NO for 3d, the materials used to prepare the sensors were unstable at room temperature and not feasible for further study. Although the aforementioned sensitivity lies above the acceptable threshold
(~0.5–1.0 nA/mM), longer NO release durations are necessary to influence long-term tissue response. Traditionally, NO-releasing glucose sensors were designed by doping NO-releasing silica nanoparticles
into polyurethane membranes that coat all commercial sensors. Thus, there are two components of the glucose sensor membrane that can be manipulated in order to extend NO release: the nanoparticles and the polyurethane. Nitric oxide-releasing particles are synthesized by grafting aminosilanes on to mesoporous silica nanoparticles, followed by amine conversion to N-diazeniumdiolate NO donors.10 The
stability in physiological buffer, as N-diazeniumdiolate NO donors decompose by reacting with hydronium ions to yield NO (Scheme 1). For example, methylaminopropyltrimethoxysilane (MAP3)
functionalized nanoparticles release nitric oxide in less than 18 hours, whereas (3-trimethoxysilyl)diethylenetriamine (DET3) functionalized nanoparticles slowly release NO over three days.
Scheme 1. N-diazeniumdiolate decomposition
The NO-release kinetics are further tuned by doping the particles into a polyurethane membrane, a commonly used synthetic polymer with widespread application in biomedical implants. When water is absorbed into the particle-doped polyurethane, the functionalized nanoparticles release their NO. The rate at which this occurs depends on the hydrophobicity of the polyurethane used. Because NO is liberated from the N-diazeniumdiolate donors via proton exchange, using more hydrophobic polyurethanes that impede the diffusion of water favorably extends the duration of NO release, whereas comparatively hydrophilic polyurethanes do the opposite. However, with regard to making a functional sensor, the use of hydrophobic polyurethanes to coat the sensing cavity has been observed to diminish sensitivity to glucose, as glucose is water-soluble, whereas using hydrophilic polyurethanes will increase sensitivity. Therefore, simultaneously achieving optimal sensor analytical performance and NO-release properties has required further investigation due to the observation that the optimization of one parameter tends to lead to deficits in the other. Herein, we worked to optimize NO-releasing polyurethane sensor membranes with the goal that the coated sensor would retain acceptable performance upon the application of the
polyurethane, functional NO-releasing glucose sensors were prepared with NO-release durations exceeding four days.
M
ETHODS ANDM
ATERIALSMATERIALS:Glucose oxidase (GOx; type VII from Aspergillus niger, >100,000 units g-1), D-(+)-glucose anhydrous, phenazine methosulfate (PMS), fetal bovine serum (FBS), trypsin, 3-(4,5-dimethylthizaol-2-yl)-5-(3-carboxymethoxyphenyl)-2-(4-sulfophenyl)-2H-tetrazolium inner salt (MTS) were purchased from Sigma-Aldrich (St. Louis, MO). Tetrahydrofuran (THF), ethanol (EtOH), aqueous ammonium hydroxide (30 wt%), and all salts were purchased from Fisher Scientific (St. Louis, MO), Tetraehtylorthosilicate (TEOS), (3-trimethoxysilyl)diethylenetriamine (DET3), and (3-methylaminopropyl)trimethoxysilane (MAP3) were purchased from Gelest (Tullytown, PA). Methyltrimethoxysilane (MTMOS) was purchased from Fluka (Buchs, Switzerland). Cetyltrimethylammonium bromide (CTAB) was purchased from Acros Organics (Geel, Belgium). L-929 mouse fibroblasts were obtained from the UNC Tissue Culture Facility (Chapel Hill, NC). Hydrothane (AL25-80A) polyurethane (HPU) was a gift from AvanSource Biomaterials (Wilmington, MA). Tecoflex (SG-85A) polyurethane (TPU), Carbothane (PC-3585A), and Tecothane (TT-1075D-M) was a gift from
Lubrizol (Cleveland, OH). Ag and Pt-Ir wire were purchased from A-M Systems. Argon, nitrogen, oxygen, and nitric oxide calibration gas was purchased from Praxair (Danbury, CT). Water was purified
using a Millipore Milli-Q UV Reference System (Bedford, MA) to a resistivity of 18.2 MΩ•cm and a total organic content of <6 ppb. Unless noted otherwise, all materials were of analytical-reagent grade and used as received without further purification.
SYNTHESIS OF NITRIC OXIDE-RELEASING SILICA NANOPARTICLES: Synthesis of NO-releasing silica nanoparticles was carried out following a previously published procedure.8 Briefly, amine-functionalized
methylaminopropyltrimethoxysilane (MAP3), and the alkoxysilane tetraethoxysilane (TEOS).8 The amines on the mesoporous silica particles were then converted to N-diazeniumniolate NO donors by
reacting the particles with high pressures of NO (10 bar) for three days and purified as described previously. Denoted DET3 or MAP3, these particles served as polyurethane dopants for all of the experiments described herein.
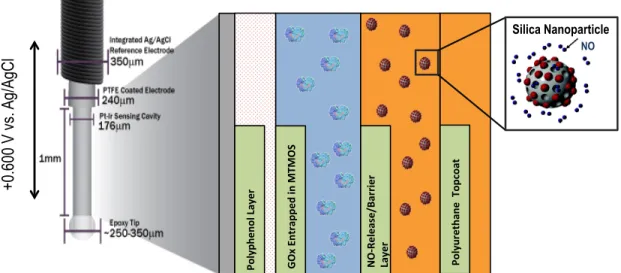
SENSOR FABRICATION/DESIGN: Uncoated sensors were first fabricated following the design shown in Figure 1. The working electrode is a 90-10 platinum-iridium (Pt-Ir) composite wire with a diameter of 176 µm. Located at the distal tip of the Pt-Ir wire is an epoxy bead (250-300 micrometer diameter) to cover any uneven or sharp edges at the end of the wire. Reference electrodes were fabricated in the laboratory by soaking silver wire in a saturated ferric chloride solution, chloridizing the wire surface and making it electrochemically active. The silver-silver chloride (Ag/AgCl) pseudo-reference electrode is wrapped around a PTFE (Teflon)-covered portion of the Ir wire. The PTFE coated on the length of Pt-Ir wire between the epoxy bead and the reference electrode was removed and the resulting metal served as
the sensing cavity (~2.0 mm), i.e., the portion of sensor to be coated with particle-doped polyurethane that is ultimately responsible for detecting glucose.
Figure 1. Implantable glucose sensor schematic
Before coating the sensors with the nanoparticle/polyurethane composite membranes, two other functional layers were deposited onto the sensing cavity: a polyphenol layer and a glucose oxidase sol-gel
layer. Deposition of these layers has been described previously.9 The polyphenol membrane functions as a molecular size exclusion layer to prevent large, interfering compounds (e.g., ascorbate) from reaching the Pt-Ir surface. Glucose oxidase, an enzyme that oxidizes glucose and is subsequently reduced by O2 to
produce hydrogen peroxide, is immobilized on the electrode surface for glucose recognition. The hydrogen peroxide generated by this reaction is able to readily pass through the polyphenol layer due to its small size and undergoes an electrochemical oxidation at the surface of the working electrode, generating two protons, oxygen, two electrons, and consequently, an electrical current (Figure 2). Under conditions of excess oxygen, the reaction produces a stoichiometric quantity of hydrogen peroxide with respect to glucose, and thus, the electrical current is proportional to the media glucose concentration.
Figure 2. Glucose-glucose oxidase redox reaction
As noted above, the part of the sensor to which polyurethane coats were applied is represented in its entirety by the schematic in Figure 1. Two procedures were used to apply the polyurethane coats: dip coating and loop casting. During the dip coating procedure, the sensor was slowly lowered to the bottom of a 1-dram vial containing 3.00 mL of a specific polyurethane/particle composite solution and then immediately withdrawn and placed in a vertical position to dry for approximately five minutes. Subsequent coats were applied in the same manner. For the loop casting protocol, the sensor was held vertically in place while a steel wire loop (2 mm diameter) containing a 6.5 µL liquid bead of
β-D-glucose oxygen
GOx
D-glucono-1,5
-lactone
particle/polyurethane was passed over the sensor, reliably depositing a thin polyurethane membrane with each cast.
CYTOTOXICITY OF NO-RELEASING DOPANT NANOPARTICLES: Previous studies have shown that the NO-releasing silica nanoparticle dopants slowly leach out of the polyurethane sensor membranes at 10-60
µg levels.9 Therefore, it was of interest to determine the concentrations at which the particles were toxic to
mammalian cells. Cytotoxicity experiments were performed on L-929 fibroblasts, a mammalian cell line that is commonly used for toxicity evaluations due to ubiquitous tissue presence. The fibroblasts were cultured in Dulbecco’s Modified Eagle Medium (DMEM) supplemented with fetal bovine serum (10 vol.%) and penicillin/streptomycin (1 wt%) and kept under 5% CO2 atmosphere in a 37 °C cell incubator.
For cytotoxicity evaluation, the cells were first incubated in a 24-well microtiter plate containing culture media for approximately 72 hours (until confluency). After this period, both NO-releasing and non-NO-releasing silica nanoparticles with different NO donor modifications (MAP3 and DET3) were sonicated in PBS to disperse the particles and injected into the microtiter plate wells at different concentrations. It is known that while high levels (µM concentrations) of nitric oxide can kill mammalian cells, NO concentrations in the pM–nM range enhance their proliferation. Thus, it was also important to determine any potential differences in toxicity solely due to NO released from the particles, in addition to potential toxicity of the organosilica scaffold. The cells were then incubated in the 24-well microtiter with the non-NO-releasing and non-NO-releasing nanoparticles for 48 hours. Following the incubation period, a MTS assay (colorimetric cell proliferation assay) was performed to analyze cell viability. To each well, 500 µL of a mixture of DMEM/MTS/PMS (105/20/1, v/v/v) was added. After 1.5 h of incubation at 37 °C, 100
Percent cell viability = [(Abs490 – Absblank)/(Abscontrol – Absblank)] x 100%.
MEMBRANE CYTOTOXICITY: In addition to the prior cytotoxicity studies, another was performed in
which cytotoxicity of the particle-doped polyurethane films (coated onto a steel wire) were evaluated. L-929 cell viability was assessed with respect to NO release from the final film materials, as we hypothesized large NO fluxes could potentially result in toxicity. Test materials were initially fabricated by dip coating stainless steel wire (357 µm diameter) into particle-containing polyurethane solutions. The temporal NO release profile of the films was manipulated by control over the NO-releasing particle and the polyurethane identities. Specifically, MAP3 and DET3 particles were doped at 20 wt% (relative to the polyurethane) into 80 mg/mL solutions (in THF) of AL-25-80A (HPU) or TT-1075D-M polyurethanes, respectively. An additional SG-85A (TPU) polyurethane topcoat (60 mg/mL in THF) was applied via dip coating to eliminate potential effects of differing surface chemistry to cell viability. Control (i.e., non-NO-releasing) films containing particles were also prepared. The membrane cytotoxicity experiments followed a similar protocol as previously described for the free silica nanoparticles, differing only in that the NO-releasing films were added to wells containing the cells and DMEM, rather than the particles. Films incorporating MAP3 were expected to release large amounts of NO more rapidly than those containing DET3 due to increased DET3 NO donor stability and membrane hydrophobicity. The particle-doped polyurethane films were incubated for 48 hours and cell viability was assessed using the MTS assay, as described in the previous section.
FIBROBLAST MORPHOLOGY: In addition to L-929 toxicity, fibroblast morphology and membrane adhesion was examined after exposure to NO-releasing films with varying temporal NO release profiles.
particles as film dopants. Each of the silicone mats was placed in separate wells of a 12-well microtiter plate. Next, 2.7 mL of DMEM was added to the wells containing the mats. Confluent L-929 fibroblasts
were trypsinized and re-suspended in 2.5 mL of DMEM. A hemocytometer was then used to determine the cell density. After determining that the cell density was on the same order of magnitude found in vivo (2.5 x 10⁶ cells mL-1), 300 µL aliquots of the cell suspension were added to each of the wells containing
the DMEM and the silicone rubber mats. The cells were then incubated on the substrates for 18 hours. To prepare the cells for imaging using scanning electron microscopy, the silicone mats were transferred to a new microtiter plate and fixed in 2.5% glutaraldehyde in PBS for 2 h at 37 °C. Afterwards, the cells/substrates were carefully washed in water (3×10 min), and dehydrated by gradient ethanol rinses (25%, 50%, 75%, 90%, 2×100% EtOH) every 10 minutes. The polyurethane films were carefully removed from the silicone rubber mats and dried using a Tousimis Semidri PVT-3 CO2 critical point
dryer to prevent cell deformation. The polyurethane films containing the dried cells were then sputter-coated with 7 nm gold (Cressington 108 Auto Sputter Coater) to improve sample conductivity. The cells were visualized using scanning electron microscopy (FEI Helios 600 Nanolab Dual Beam System).
SENSOR EVALUATION: Fabricated sensors were soaked in 10 mM phosphate buffered saline (PBS; pH 7.4) overnight to hydrate the polyurethane layers prior to testing them with a potentiostat the following day. Sensors (working electrode and reference electrode) were submerged in 30 mL of PBS (pH 7.4, 37 °C) and a +0.600V potential was applied at the working electrode (sensing cavity) versus the Ag/AgCl pseudo-reference electrode using a CHI 1030a multichannel potentiostat. The sensors were then polarized for approximately 30 minutes to achieve a stable background current prior to glucose
select sensors were tested in DMEM and in porcine serum to examine performance in complex media. The amounts of media and serum used, along with the injection protocol and potentiostat parameters were
the same as described for the experiments carried out in PBS.
MEASUREMENT OF NITRIC OXIDE RELEASE: Nitric oxide release measurements were carried out using a Sievers 280i NO analyzer. Generation of NO was detected indirectly via chemiluminescence from excited state nitrogen dioxide formed upon the reaction of NO with ozone. The NOA was calibrated using a two-point linear calibration; air passed through a Sievers NO zero-filter served as the blank value and 25.87 ppm NO in N2 was used as the second calibration point. NO-releasing polyurethane films were
submerged in the NOA sample flask containing 30 mL deoxygenated PBS at 37 °C. A stream of N2 gas
(80 mL min-1) was continuously bubbled through solution to carry liberated NO to the analyzer. Supplemental nitrogen flow was provided to the flask to match the instrument collection rate of 200 mL min-1. Instantaneous NO concentrations were measured at a sampling frequency of 1 Hz, providing near real-time information regarding NO-release kinetics from the films. The NO measurements were terminated when NO release from the films was below 1 pmol cm-2 s-1.
R
ESULTSFigure 3. LD-50 curves for free control and NO-releasing DET3 and MAP3 silica nanoparticles
Table 1. Free particle concentrations at which L-929 fibroblasts were 50% viable
Nanoparticle Concentration (mg/mL) Average Viability (%) Standard Deviation (%)
DET3 1.75 50.6 5.5
DET3/NO 0.50 52.5 12.5
MAP3 2.00 48.0 8.7
MAP3/NO 1.50 48.2 11.3
MEMBRANE CYTOTOXICITY: Cytotoxicity evaluations for the NO-releasing membranes are displayed in Table 2. Two different membranes were evaluated: a large flux (up to 200 pmol • cm-2 • s-1) NO-releasing film and a low flux (<15 pmol • cm-2 • s-1) NO-releasing film. Additionally, blank membranes
Figure 4. NO fluxes over time for MAP3/large flux (left) and DET3/low flux (right) films coated onto wire substrates
Table 2. L-929 Fibroblast viability following 2d incubation with NO-releasing membranes
Film MAP3 Control MAP3/NO DET3 Control DET3/NO
Average Viability (%) 100.6 97.5 104.0 103.3
Standard Deviation (%) 4.0 5.4 4.4 5.2
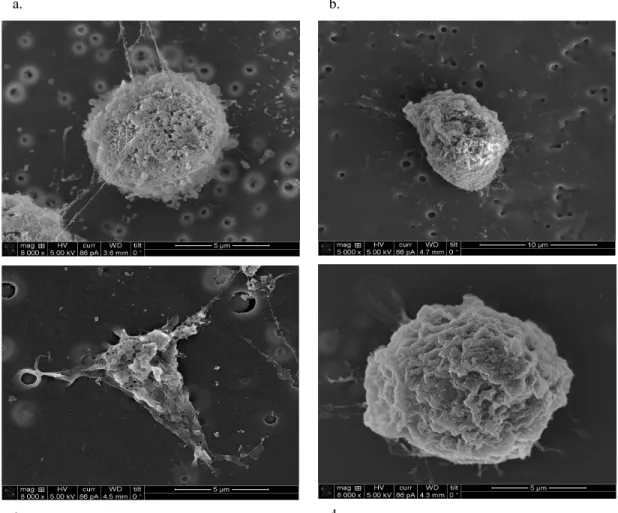
Figure 5. SEMs of L-929 fibroblasts cultured on substrates with varied NO-release kinetics: (3a) HPU/MAP3-NO, (b) HPU control, (c) TT-1075D-M/DET3-NO, (d) TT-1075D-M control
Figure 6. Temporal NO-release profiles for TT-1075D-M/DET3 membranes (left) and HPU/MAP3 (right)
a. b.
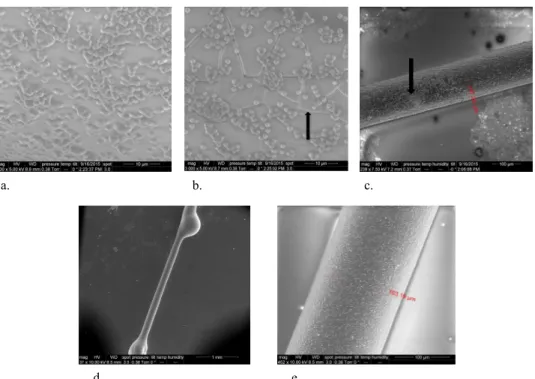
SENSOR MEMBRANE DEPOSITION: Figure 7a–e shows SEMs of particle-doped polyurethane coated sensors. The sensors in Figure 7a – 7c were coated following the dip coating protocol. The bottom two
images show sensors fabricated using the loop casting protocol. In the images of the dip-coated sensors, there are regions of the sensing cavity in which the glucose oxidase layer beneath the polyurethane layer is exposed (indicated by black arrows). The polyurethane coat does not display uniform thickness and fails to provide adequate coverage in certain regions of the sensing cavity. In contrast, images of the sensors produced via loop casting (Figure 7d – 7e) show uniform deposition of the particle-doped polyurethane along the length of the sensing cavity, and constant membrane thickness. Of note, the enlarged beads on either end of the sensor in Figure 7d are the epoxy bead and the reference electrode, with the area in between being the sensing cavity. The results of this study prompted the use of the loop casting protocol for all subsequent sensor fabrications.
Figure 7. SEMs of sensors with different casting protocols. (a–c): sensors produced via dip coating, (d– e): sensors coated via loop casting
a. b. c.
MEMBRANE OPTIMIZATION: The first polyurethane composition applied to sensors was 1:1 HPU:TPU in 3:1 THF:DMF, which was chosen as a promising candidate for study because previous work
demonstrated that it was an optimal sensor membrane, albeit, for a non-implantable version of the sensor.11 Three solutions of different polyurethane concentrations were prepared: 40, 50, and 60 mg/mL.
Figure 8. HPU:TPU-coated sensors of varied polyurethane concentrations: (black) 60 mg/mL, (red) 50 mg/mL, (green) 40 mg/mL. Sensitivities: 0, 0.061, 0.183 nA/mM, respectively. LDR: 0, 1-27, 1-27 mM, respectively. (All 1:1 HPU:TPU at 10 casts.)
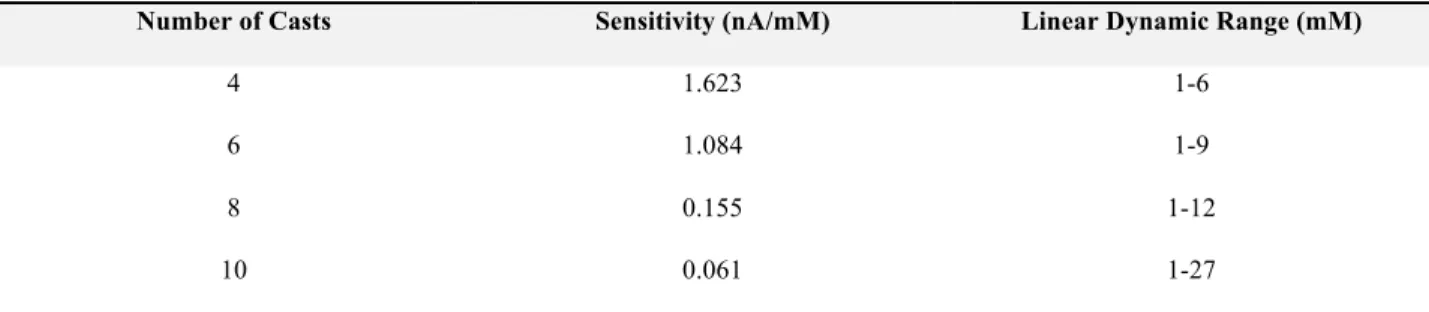
Table 3. HPU:TPU-modified sensor performance at varied membrane thicknesses.
Number of Casts Sensitivity (nA/mM) Linear Dynamic Range (mM)
4 1.623 1-6
6 1.084 1-9
8 0.155 1-12
10 0.061 1-27
*All 50 mg/mL 1:1 HPU:TPU, varied casts (Fig. 8b)
Sensitivity of a glucose sensor is generally greater when more hydrophilic polyurethanes are applied as the external membranes due to greater glucose diffusion to the sensing element. The previous experiments yielded sensors with acceptable sensitivities, but poor linear dynamic ranges from thinner membranes of 50 mg/mL 1:1 HPU:TPU. Thicker membranes of the same composition yielded acceptable linear dynamic ranges, but poor sensitivities. Based on the previous results, it was hypothesized that applying a comparatively more hydrophilic and thicker membrane would successfully optimize both
parameters. Therefore, sensors were coated with the more hydrophilic HPU or HP93A composites as the external membranes. The initial experiments showed that the sensitivity of a sensor with 10 casts of HPU
was approximately 13 times greater (~0.8 nA/mM) than the sensitivity of a sensor with 10 casts of 1:1 HPU:TPU (~0.06 nA/mM). Furthermore, both exhibited comparable linear dynamic ranges of 1-24 and 1-27 mM, respectively, as shown in Tables 3 and 4. Using the HPU membranes for further study, sensor sensitivity was, again, examined as a function of the number of applied coats (and thus, membrane thickness) at 5, 8, and 10 coats. As expected, these sensors displayed acceptable sensitivities (Table 5). Again, sensors with thicker external membranes had the lowest sensitivities. And while the thinnest membranes (five coats), exhibited the greatest glucose sensitivity (~6.6 nA/mM), the consequence of the thin membranes meant that fewer NO-releasing particles could be coated onto the sensor. Therefore, a sensor with eight casts was ultimately decided to be a suitable compromise to provide sufficient sensitivity and membrane thickness.
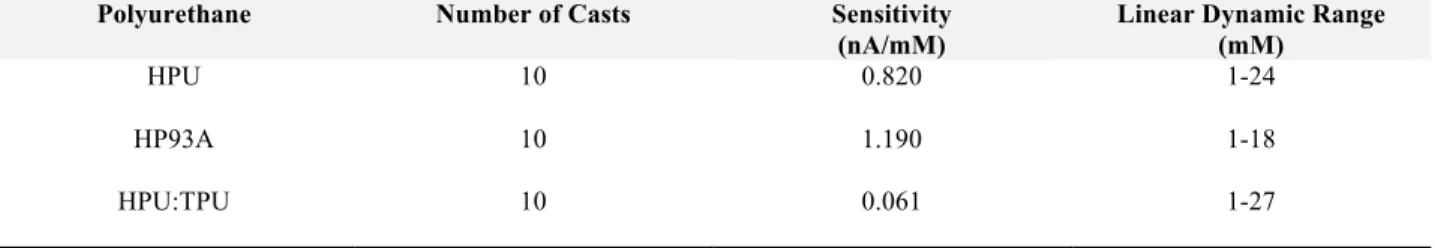
Figure 9. Amperometric glucose response of glucose sensors with different external membrane compositions. a) sensors were coated with either HPU (red), HPU:TPU (purple), or HP93A (black) b) HPU-coated sensors modified with 5, 8, or 10 coats.
Table 4. Performance of sensors with different membrane compositions (Fig. 9a). Polyurethane Number of Casts Sensitivity
(nA/mM)
Linear Dynamic Range (mM)
HPU 10 0.820 1-24
HP93A 10 1.190 1-18
HPU:TPU 10 0.061 1-27
* All 50 mg/mL in 3:1 THF:DMF
Table 5. Sensor performance for HPU sensor membranes of varied thickness (Fig. 9b). Number of Casts Sensitivity
(nA/mM)
Linear Dynamic Range (mM)
5 6.63 1-6
8 2.92 1-12
10 2.00 1-15
*All 50 mg/mL HPU in 3:1 THF:DMF
TOPCOAT MODIFICATION AND SENSOR TESTING IN PBS,DMEM, AND PORCINE SERUM: Different polyurethanes were applied as external coatings to increase the linear dynamic range of the sensor. Initially, TPU was used as a topcoat, but unfortunately, these sensors all exhibited very low sensitivity
a. b.
(Figure 10). To make the topcoat slightly more hydrophilic, a composition of 3:1 PC-3585A:AL-2580A (Carbothane:HPU) was prepared and applied on top of the previously optimized HPU base layer. These
sensors displayed acceptable performances when tested in PBS (Figure 11 and Table 6). With the final application of the sensors in mind (i.e., being implanted in tissue), the optimized sensors were also tested in cell media and porcine serum to determine if/how protein adhesion to the sensor impacted analytical performance. Table 6 shows that the performance of these particular sensors is not compromised in more complex media; however, it is probable that different topcoat compositions will cause different degrees of protein adhesion, and thus, sensor performance in complex media.
Figure 10. Amperometric glucose response for HPU-based sensors with no topcoat (black), 30 mg/mL (red), 40 mg/mL (yellow), and 50 mg/mL (blue) TPU topcoats.
Table 6. HPU base layer/Carbothane:HPU topcoat-cast sensor performance in different media. Media Sensitivity (nA/mM) Linear Dynamic Range (mM)
PBS 0.40±0.13 1–26
DMEM 0.46±0.12 1–18
SERUM 0.41±0.07 1–28
POLYURETHANE MEMBRANES WITH ELEVATED PARTICLE CONCENTRATIONS: While the previous experiments resulted in an optimal sensor membrane composition, additional membrane optimization
experiments took a different approach to converge on alternative optimized compositions. Because of the tendency of the nanoparticles to leach from the membranes to some extent, these final glucose sensor
experiments consisted of applying hydrophobic polyurethanes doped with high NO-releasing silica nanoparticle concentrations relative to compositions previously tested. It was hypothesized that increasing the particle concentration would create a more porous membrane (space created where particles once occupied) through which glucose could readily diffuse to the sensing element. Furthermore, based on previous experiments, it was observed that using a hydrophobic polyurethane instead of a hydrophilic one would maintain an acceptable linear dynamic range. While all polyurethane compositions of previous experiments held particle concentrations at a constant 20 wt%, in the following experiments the total particle concentration was increased to 50 wt%. In addition to analyzing how the sensitivity and linear dynamic range was affected by increasing the particle concentration, these parameters were further evaluated by utilizing two differently nanoparticles (DET3 and MAP3) and observing if the particle identity led to different sensitivities and linear dynamic ranges when added to identical 85A polyurethane solutions at the same concentration (50 wt%). Figure 11 shows SG-85A/MAP3 and SG-85A/DET3 amperometric i-t curves and the associated glucose sensitivities.
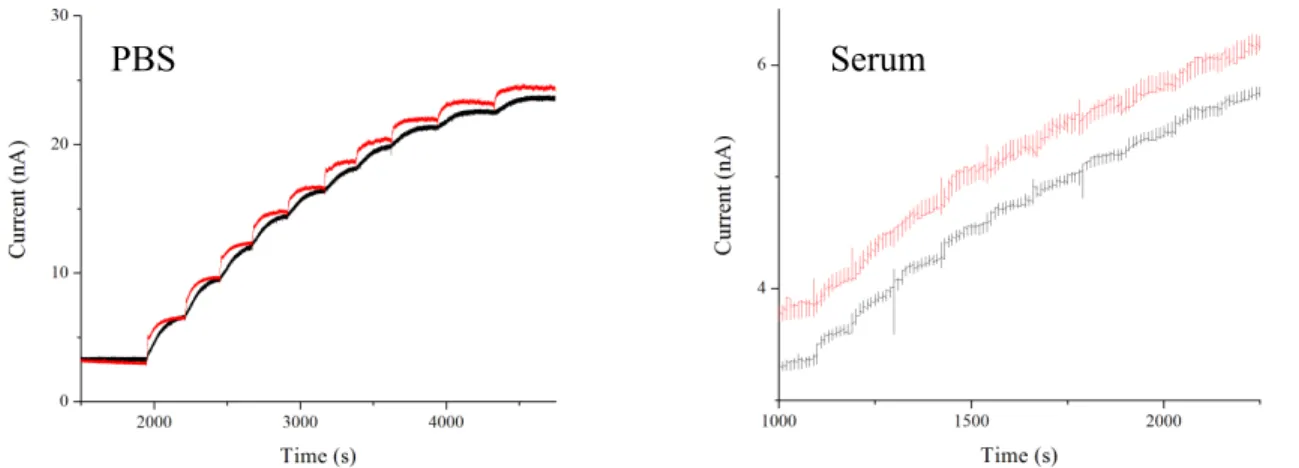
Figure 11. Amperometric i-t curves for SG-85A sensors in PBS (left) and serum (right) testing media. SG-85A/DET3 (black) sensitivity: 0.58±0.28 nA/mM and SG-85A/MAP3 (red) sensitivity: 0.59±0.26 nA/mM in PBS.
Lastly, another hydrophobic polyurethane, TT-1075D-M/DET3 (50 wt%), was prepared, applied to sensors, and tested to investigate whether increasing the particle concentration led to similar sensitivities
and linear dynamic ranges in a different hydrophobic polyurethane. Figure 12 shows amperometric i-t curves of several identical TT-1075D-M/DET3 sensors and their associated average sensitivity and LDR. Figure 13 shows NO fluxes over time for the sensor membrane compositions tested in these experiments: SG-85A/MAP3, SG-85A/DET3, and TT-1075D-M. The total NO fluxes were used to reconcile differences in the sensitivities between the SG-85A and TT-1075D-M sensors.
Figure 12. Amperometric i-t curves for TT-1075D-M/DET3-NO sensors in PBS (left) and serum (right) testing media. Average sensitivity in PBS: 3.44±2.62 nA/mM.
Figure 13. Temporal NO-release profiles for a) SG-85A/DET3 b) SG-85A/MAP3 c) TT-1075D-M/DET3 polyurethane/particle membranes
D
ISCUSSIONPARTICLE AND MEMBRANE CYTOTOXICITY: With the future application of the sensors in mind, it was important to determine if the sensors prepared as previously described are toxic to mammalian cells. The cytotoxicity data in Table 2 and Table 3 show that the levels at which the free DET3-NO particles are toxic to mammalian cells are large (0.5 – 2.0 mg/mL) and well above the concentrations that would be expected, even in the case of total particle leaching (~60 µg). Indeed, the viability of mammalian cells was neither diminished nor enhanced by the presence of either the 12d NO-releasing films or the 1d NO-releasing films. The limitations of these cytotoxicity studies are that they are carried out in the same, fixed volume over two days. In vivo, fluids are
a
.
b
continuously exchanged and waste products are carried away from the interstitial fluid by the lymphatic system. Therefore, the results are not directly transferrable to how leaching of particles
might affect the local cellular or tissue response in vivo; however, it is reasonably hypothesized that cells would remain viable due to the low toxicity of the particles and films. Future work should incorporate toxicity evaluations in a more representative culture system in which fluids and their contents are continuously exchanged.
FIBROBLAST MORPHOLOGY: Implantable glucose sensors that are currently commercially available exhibit high error (≥15%) and need to be replaced frequently.1,2 A widely acknowledged
tenet is that poor performance is inherently linked with the foreign body response. Mammalian cells in the vicinity of a foreign object do not recognize it as belonging to the body and mount an inflammatory attack in an attempt to degrade or remove the implant. The materials that comprise the implantable portion of a glucose sensor are relatively insensitive to phagocytosis by macrophages and, instead, are walled off from the local microenvironment in a collagen capsule. The basis for creating an implantable sensor that continuously releases therapeutic levels of NO is that this property could mitigate aspects of the foreign body response by altering macrophage functional phenotype and stimulating angiogenesis. In fact, NO is acknowledged to play integral roles in many FBR aspects, including collagen deposition by fibroblasts.3 Indeed, previous research has shown that NO-releasing implants reduce collagen encapsulation.4,7 To provide insight into NO’s relationship with fibroblast behavior, the morphologies of fibroblasts incubated on NO-releasing and control substrates for 18 hours were compared. The SEMs of the fibroblasts
spherical, which is generally a marker of poor cell adhesion as the surface area in contact with the underlying substrate is minimized. A reasonable interpretation of these results is that the
continuous release of therapeutic levels of NO creates a local microenvironment at the foreign body that encourages normal cell behavior. The TT-1075D-M/DET3-NO substrate provides this sustained release of detectable levels of NO (>35 hours), whereas the HPU/MAP3-NO substrates release NO at a rate that depletes the stored NO below therapeutic levels in approximately six hours. Therefore, the results are congruent with initial expectations; when the substrates were observed under the SEM after 18 hours of incubation, the only fibroblasts with morphology different from the others were the fibroblasts that had been exposed to NO right up to the point of preparing the cells for observation.
COATING PROTOCOL: After determining that the NO-releasing films were relatively non-toxic, the next step consisted of designing a working implantable glucose sensor capable of NO release. Based on the former observation, design of the glucose sensor was pursued with focus on extending NO release for the maximum possible duration. Indeed previous literature supports that at least 2–3 d continuous NO release is necessary to mitigate long-term inflammation (7 d) and collagen encapsulation (2–6 weeks).1 This extended NO release was accomplished by applying different NO-releasing polyurethane compositions to bare sensors and subsequently ensuring that NO storage and release from the sensor membrane did not compromise device analytical performance. This process posed several challenges, as adding a polyurethane membrane and increasing its thickness to store as much NO as possible progressively diminishes the sensitivity of
the analytical device. Furthermore, the polyurethane membrane application protocol presented its own obstacles, as the membranes needed to be uniform to ensure reproducibility among sensors with identical membrane compositions.
results were usually not reproducible. Hypothesizing that the application protocol might be the source of error, SEMs of sensors prepared via dip coating were taken and they revealed
non-uniform membrane deposition as the cause of irreproducibility. Some areas of the sensing cavity were found to have minimal polyurethane deposition, while other areas had a comparatively thick polyurethane layer. This meant that some sensors would have had areas along the sensing cavity through which glucose could easily diffuse relative to other areas. The membrane non-uniformity necessitated that a new deposition protocol be developed.
Several experiments were conducted to find an alternative to dip coating. Among the
alternatives that were considered, loop casting was found to be viable way to apply polyurethane
coats of uniform thickness (target thickness 10–40 µm) While it remains unclear why this method is
superior to dip coating, it could be that exact aliquots of the polyurethane composition are applied to
the sensing cavity each time with loop casting. Additionally, with the loop casting protocol the
sensor remains stationary as the polyurethane is applied to the sensing cavity. Dip coating, on the
other hand, requires that the sensor be moved up and down during the application process. It is
possible that the lack of movement of the sensor during loop casting prevented the polyurethane
from accumulating as beads within the sensing cavity prior to drying. Regardless, once this new
protocol was observed to lead to reproducible results, optimization of the polyurethane coat became
the primary focus.
MEMBRANE OPTIMIZATION: Specific polyurethanes were selected with the final application of
the sensors in mind. To elaborate, the ideal glucose sensor membrane is a polyurethane
composition that is neither too hydrophilic nor too hydrophobic. The membrane needs to be
hydrophilic enough for glucose to readily diffuse through and react with the underlying glucose
oxidase, but hydrophobic enough so that the nitric oxide stored in silica nanoparticle donors,
days) of small, therapeutic amounts of NO is a desired membrane quality. Furthermore,
membranes exhibiting some degree of hydrophobicity balance the diffusion of oxygen and glucose
to the glucose oxidase layer, which is important for extending the linear dynamic range. To briefly
explain, the ideal composition would allow an excess of oxygen (relative to glucose) to diffuse
through the polyurethane layer to the glucose oxidase layer (Figure 2 in Methods). In an overly
hydrophilic polyurethane composition, glucose diffuses through the polyurethane too readily,
causing the change in current that is generated by the enzymatic reaction to be limited by the
available oxygen, which gives rise to a poor sensor linear dynamic range. On the other hand, if
glucose diffuses through the membrane more slowly, the rate at which glucose oxidase is
regenerated by oxygen matches the rate at which glucose oxidase binds glucose, resulting in an
improved linear dynamic range.
Initial attempts to create an ideal membrane composition consisted of combining
hydrophilic polyurethanes and hydrophobic polyurethanes in a single composition and also altering
the polyurethane concentration in the loop casting solvent. Initially, a 1:1 mixture of HPU:TPU
was used, as it has successfully been used for glucose sensor membranes previously.9 Such success
was attributed to HPU being a hydrophilic polyurethane and TPU being a hydrophobic
polyurethane, balancing the required glucose and oxygen permeabilities. However, when tested,
these sensors were found to have low sensitivities and non-ideal linear dynamic ranges. Increasing
the sensitivity meant that the membrane permeability to glucose had to be increased. A
polyurethane composition consisting only of the more hydrophilic HPU polyurethane (doped with
DET3-NO) was prepared and applied to sensors. When tested, the results were as expected, with
thinner membranes yielding substantially greater sensitivity and decreased linear dynamic range.
The increased sensitivity provided the flexibility needed to apply a sensitivity diminishing
of nitric oxide release. Therefore, the next set of experiments for membrane optimization
consisted of selecting and applying a polyurethane topcoat.
The logic behind determining a proper topcoat was that it should be hydrophobic enough to
increase the linear dynamic range by slowing the diffusion of glucose, but not so much that it
prevented the diffusion of glucose altogether. After finding that even thin topcoats of (hydrophobic)
TPU and Carbothane polyurethane severely diminished sensor sensitivity, it was hypothesized that
a less hydrophobic Carbothane/HPU mixture, when applied as a topcoat to the HPU base layer
sensors, could provide acceptable sensitivities and linear dynamic ranges. Following membrane
deposition and testing, the sensitivities were observed to be on the lower end of the acceptable
range; however, the linear dynamic range extended to greater glucose concentrations than any
composition tested up to that point (1-27 mM). Further modifications to the topcoat to make it
slightly less hydrophobic may be appropriate, as long as it does not compromise gains made with
the sensor linear dynamic range. These promising results prompted further testing of the sensors in
DMEM and porcine serum to determine if they function similarly in biologically relevant media.
The similar observed sensor sensitivities and linear dynamic ranges across testing media indicates
that the presence of proteins in the more complex media does not significantly impair the
performance of this particular sensor design, which is pertinent information to have obtained prior
to any future in vivo studies. Interestingly, sensor performance is somewhat diminished in DMEM,
which could possibly be due to differences in electrolyte concentrations of the media that would
interfere with the function of the electroanalytical device.
ELEVATED NANOPARTICLE CONCENTRATIONS: The final sensor experiments involved altering
the concentration of the NO-releasing nanoparticles in the polyurethane compositions to elucidate
elevated particle concentrations, more hydrophobic membranes served as suitable glucose sensor
membranes. For example, sensors coated with a thin SG-85A (a hydrophobic polyurethane)
membrane did not respond to glucose at low film concentrations of DET3 nanoparticles (<33.3
wt%), but yielded suitable sensitivity at elevated particle concentrations (50 wt%). It was
hypothesized that the large wt% of silica nanoparticles in the films contributed to an enhanced
signal and that similar sensor performance could be obtained if the dopant identity was altered.
Thus, additional coating experiments were carried out using two different types of NO donors
(MAP3 and DET3 nanoparticles) in an attempt to control NO-release kinetics without precluding
adequate sensor performance. The average sensitivities of the 85A/DET3-NO and
SG-85A/MAP3-NO sensors were 0.58 and 0.59 nA/mM, respectively. The linear dynamic ranges were
1-18 and 1-24 mM. As a whole, these data indicate that adding different nanoparticles does not
result in different membrane properties in an otherwise identical polyurethane composition. These
results are in stark contrast to the sensitivities of SG-85A sensors with 20 wt% particle
concentrations, which yielded no detectable current (<100 pA) in response to 30 mM glucose.
Furthermore, increasing the nanoparticle concentration of the sensor membrane increases the
sensitivity of a sensor. In separate work, it was revealed that leaching of nanoparticles increases
when incorporated into polyurethane membranes at higher concentrations, which may, in part,
describe the heightened sensitivity, as glucose diffuses through spaces one occupied by the
particles. Nevertheless, the total amount of silica leached from the working electrode (~60 µg) is
unlikely to be significantly toxic. Although prior experiments consisted of adding hydrophilic
polyurethanes to the membrane composition to increase sensitivity, these experiments that utilized
a single type of hydrophobic polyurethane with a higher particle concentration can also effectively
The analytical performances of sensors fabricated using SG-85A and large concentrations
(50 wt%) of either MAP3 or DET3 particles were greater than all other previously tested
compositions. However, a final attempt to further optimize the sensor membrane composition arose
from an unanswered question: How does using different hydrophobic polyurethanes at the
increased nanoparticle concentration alter sensor performance? Another hydrophobic candidate
polyurethane, TT-1075D-M was examined for utility as a glucose sensor membrane component. A
TT-1075D-M/DET3 composite was successfully applied to glucose sensors and tested in PBS and
porcine serum. The average sensitivity and linear dynamic range of the sensors was found to be
3.44 nA/mM and 1-30 mM in PBS. The determined glucose sensitivity is nearly six times greater
than that of the SG-85A sensors and well above the threshold of acceptable sensitivity (~0.5–1.0
nA/mM) and linear dynamic range (1–21 mM). TT-1075D-M is a more hydrophobic polyurethane
than SG-85A, which explains the wider linear dynamic range, but not the increased sensitivity.
Therefore, the manner in which the glucose permeability of polyurethane sensor membranes is
affected is likely due to properties other than hydrophobicity that are inherent to the particular
polyurethane used. This is supported by the NO-release data for the TT-1075D-M/DET3-NO
sensors, which released a lower amount of total NO than the SG-85A/DET3-NO sensors. This
indicates that a thinner NO-releasing polyurethane coat was deposited on these sensors, which is
likely the source of increased sensor sensitivity. Indeed, specific properties of the TT-1075D-M
polyurethane (e.g. molecular weight) or the composite solution (e.g. surface tension, viscosity) may
affect the coating process and associated sensor analytical performance. The consequence of
decreased polyurethane deposition is a thinner membrane, which allows glucose to more readily
reach the glucose oxidase layer in a shorter amount of time. Although particle leaching was not
measured for this particular composition, increased porosity as a result of leaching creates a less
C
ONCLUSIONSDesigning an implantable analytical device capable of both glucose measurement and sustained NO release is an important area of research due to the long-term positive impacts it could have on the ability to manage diabetes, potentially augmenting in vivo sensor accuracy and extending the useable lifetime. Cytotoxicity and cell morphology experiments show that the modifications that endow the device with the ability to store and release NO are not overly harmful to mammalian cells up to relatively large material concentration (~1 mg mL-1). Low NO fluxes (1–10 pmol cm-2 s-1) correlate with dendritic
fibroblast morphology, potentially indicating greater propensity for cell adhesion on NO-releasing substrates, whereas non-adherent morphologies were observed on all implants that were not actively releasing NO.
The addition of nitric oxide-releasing nanoparticle-doped polyurethanes to the sensing cavity of an implantable glucose sensor posed a unique challenge of determining a composition that would not preclude acceptable glucose sensor sensitivity and linear dynamic range. Functional sensors were designed by altering the polyurethane identity, adopting a multilayer coating structure, and using elevated concentrations of the NO donor-modified silica nanoparticles. The best sensor performance in terms of suitable glucose sensitivity and dynamic range was obtained using the last approach. One potential reason for enhanced performance is leaching of the zwitterionic N-diazeniumdiolate particles from the membranes, which potentially introduced membrane porosity and provided less hindered glucose diffusion paths to the interior of the sensor. Additional research is needed to maximize stability of the NO-donor modified silica in polyurethane membranes. Specifically, neutral NO donor modifications (e.g., S-nitrosothiols) should be pursued as an alternative to potentially avoid particle leaching.
This research has yielded two effective approaches to producing a working implantable glucose sensor. The approach taken will depend on the NO donor used and the desired membrane NO-release
side-by-side for S-nitrosothiol-doped polyurethane compositions. The optimized sensor formulations should be tested as detailed in these experiments to establish feasibility for future in vivo testing.
A
CKNOWLEDGEMENTSR
EFERENCES1. Centers for Disease Control and Prevention. Diabetes Report Card 2014. Atlanta, GA: Centers for Disease Control and Prevention, US Dept of Health and Human Services; 2015.
2. Gifford, R. “Continuous glucose monitoring: 40 years, what we’ve learned, and what’s next”
Chemphyschem 2013, 14, 2032–2044.
3. Nichols, S. P.; Koh, A; Storm, W. L.; Shin, J. H.; Schoenfisch, M. H. Chem. Rev. 2013, 113, 2528-2549.
4. Hetrick, E. M.; Prichard, H. L.; Klitzman, B.; Schoenfisch, M. H. Biomaterials, 2007, 28, 4571-4580.
5. Macmicking, J.; Xie, Q.; Nathan, C. “Nitric oxide and macrophage function” Annu. Rev.
Immunol. 1997, 15, 323–350.
6. Cooke, J. P. “Nitric oxide and angiogenesis” Atheroscler. Suppl. 2003, 4, 53–60.
7. Nichols, S. P.; Koh, A.; Brown, N. L.; Rose, M. B.; Sun, B.; Slomberg, D. L.; Riccio, D. A.; Klitzman, B.; Schoenfisch, M. H. Biomaterials2012, 33, 6305-6312.
8. Nichols, S. P.; Le, N. N.; Klitzman, B.; Schoenfisch, M. H. Anal. Chem. 2011, 83, 1180-1184. 9. Soto, R. J.; Privett, B. J.; Schoenfisch, M. H. Anal. Chem. 2014, 86, 7141-7149.
10. Soto, R. J.; Yang, L.; Schoenfisch, M. H. “Functionalized mesoporous silica via an aminosilane surfactant ion exchange reaction: Controlled scaffold design and nitric oxide release” ACS Appl.
Mater. Interfaces 2016, 8, 2220–2231.
11. Koh, A.; Riccio, D. A.; Sun, B.; Carpenter, A. W.; Nichols, S. P.; Schoenfisch, M. H. Biosens.