Die Hu. A Study of Cluster-based System for Information Exploration. A Master’s Paper for the M.S. in I.S degree. October, 2015. 30 pages. Advisor: Javed Mostafa
Researchers always need to find publication to support their study. Traditionally,
researchers will search in an information retrieval system where researchers input a query and obtain a ranked list of retrieved results. However, traditional information retrieval systems cannot help researchers if they are in anomalous state of knowledge. Due to linguistic barriers or lack of knowledge in a field, researchers may be unable to specify a query and thus, unable to do an efficient and effective publications search. A cluster-based information retrieval system will be designed to resolve the problem by presenting a topic map. The purpose of this study is to see whether such a system could help
researchers in exploring information.
Headings:
Cluster-based
Information retrieval
Information retrieval system
Topic Map
Usability
A STUDY OF CLUSTER-BASED SYSTEM FOR INFORMATION EXPLORATION
by Die Hu
A Master’s paper submitted to the faculty of the School of Information and Library Science of the University of North Carolina at Chapel Hill
in partial fulfillment of the requirements for the degree of Master of Science in
Information Science.
Chapel Hill, North Carolina
July 2016
Approved by
Table of Contents
Table of Contents ...1
I
NTRODUCTION...2
L
ITERATURER
EVIEW...4
Visualization in information retrieval ...4
Cluster hypothesis ...6
Topic Map ...8
Summary ...8
R
ESEARCHM
ETHODOLOGY...10
System Design ...10
Data source ...10
Text mining algorithm ...10
System introduction ...12
Participant recruitment ...14
Experiments process ...15
Data Collection ...16
S
YSTEMU
SABILITYR
EPORT...17
Pre-Test Findings ...17
Efficiency and Effectiveness Evaluation ...18
Users’ Satisfaction ...19
Evaluation of the Interface Design ...22
Implications and Future Work ...24
I
NTRODUCTIONInformation seeking is an indispensable part of our everyday lives. Researchers always
need to find resources to support their studies and know up-to-date developments in their
fields. Publications are good sources for fulfilling researchers’ information needs. One
way that researchers can find publications is by searching in an information retrieval (IR)
system. In an IR system, they usually present their queries and then the system helps
them to find documents that are relevant to the queries and returns a list of retrieved
results. They then evaluate the information obtained from the system and determine if the
information needs are completely satisfied, only partially satisfied, or not satisfied.
Obviously, the query plays a crucial role in the process of searching. The
quality of a query will explicitly influence the quality of retrieved results. That is, if a
query cannot represent the information needs appropriately, the retrieved results could
deviate from our information needs to some extent. For some easy information-searching
tasks, such as searching a publication with a known title, information needs must be
clearly known in order to construct a representative query for searching. However, when
it comes to a complicated context, the query is not easy to construct. The most common
situation is known as Anomalous States of Knowledge (ASK) (Belkin, 1982).
The ASK hypothesis is that an information need arises from a recognized
anomaly and our state of knowledge concerning some topic or situation and that, in
anomaly. Concretely, we may be incapable of elucidating what would resolve our
problems due to a lack of knowledge in a specific field or expressing the information
need as a query for the IR system due to linguistic barriers. Thus, for the purpose of IR, it
is more suitable to attempt to describe that ASK than to be required to specify a need as a
query for the system.
In a collection of documents, a topic map that contains terms representative of
those documents shows relationships between terms and groups relevant terms as a
cluster. Also, the topic map can function as knowledge representation of this collection.
This topic map provides an overview of the whole collection, offering foundational
knowledge about this collection.
The purpose of this study is to design a cluster-based topic map of an IR system
for a collection of publications and test its effectiveness, efficiency, and level of user
satisfaction by conducting usability testing. When searching in the cluster-based system,
we will be presented with a topic map of all representative terms. Representative terms
can be used to index documents in the collection and are extracted by using text-mining
techniques (Fu, Bauer and Mostafa, 2002). Users can find documents relevant to each
term by simply clicking the term, and the system will return a list of documents relevant
to the term. We assume that such a system will help to resolve the ASK problems by
providing an overview of knowledge representation and avoiding the need for specifying
L
ITERATURER
EVIEWVisualization in information retrieval
It is often said that an image is worth a thousand words because people can easily detect
subtle changes in size, color, shape, movement, or texture. Information visualization as a
form of presenting and manipulating large amounts of information in a “picture” uses
interactive visual representation of abstract data to amplify cognition (Shneiderman,
2005).
Visualization for information retrieval can be defined as a process
“transforming invisible abstract data and their semantic relationship into a visible display and visualizing the internal retrieval process for users” (Shneiderman, 2005).
From this perspective, we can find two components consisting of visualization
for information retrieval: visually presenting objects in a more meaningful way for better
browsing, and visualizing the information-seeking process for better control.
A traditional IR system is often criticized for not fully using browsing
capabilities. Thus, in 1991, a new model which opened the possibility for browsing of an
IR system, was proposed by using the concept of a reference point (Korfhage, 1991).
Users are presented with a graphic image with points that represent different documents.
Rather than offering a linear retrieval results list provided in a traditional IR system, this
model aims to not only provide relevance between a query and retrieved documents but
visualization tools, for example, opening points to view documents, selecting subsets of
documents, and viewing documents’ interrelationships in a collection, users also gain
more control over the information retrieval process.
A study in 2004 (Koshman, 2004) which compared usability between VIBE
(Visual Information Browsing Environment; Olsen, Korfhage, Sochats, Spring, &
Williams, 1993) and askSam, a text-based system for information retrieval, indicated that
though there are no significant differences in usability of the two systems, significant
performance differences for some tasks were found. 31 participants were recruited for the
study. Most askSam tasks were solved correctly while VIBE tasks had higher error rates.
Many participants indicated that VIBE’s document display was moderately easy to
navigate, but found that the features were poorly presented. Participants could locate
features to solve tasks, but could not always solve the tasks correctly, which explained
the differences in error rates between the two systems. Also, more participants found that
VIBE was faster at retrieving the small data sets than the larger data sets.
As the volume and diversity of information grow rapidly, it even may be
difficult for a highly visual retrieval system to satisfy every user’s information need. Thus,
based on the VIBE system, an adaptive VIBE framework (Ahn, & Brusilovsky, 2013) is
proposed with an approach to combing exploratory search, personalized search, and
adaptive visualization based on VIBE. This highly interactive retrieval system allows
users to learn about and investigate problems in the iterative retrieval process to reach the
final goal.
There are some other studies that reveal different visualization strategies in
browsing method named Scatter/Gather in a system to view retrieval results in a visual
way. They reported that using Scatter/Gather to present retrieval results is significantly
better than similarity search ranking alone.
Marchionini, Wildemuth, and Geisler (2006) introduced a distinguished visual
search system, Open Video Digital Library (OVDL). OVDL has an innovative user
interface that offers multiple kinds of visual surrogates to people searching for videos.
Relation Browser, the tool developed by Capra and Marchionini, helps people to
understand relationships between items in a collection and explore an information space
by using visualization technologies.
Researchers in the field of visualization for information retrieval now assume
that IR systems assisted by visualization are more usable than text-only versions.
However, the findings of a study comparing a visualization and a text-based IR system
demonstrate that the visual retrieval system is obviously not superior to the text-based
system in interacting with users (Korshman, 2004). Another study that aimed at
evaluating the effectiveness of visual user interface for information retrieval also
concludes that while visual user interfaces for information searching might seem to be
more useable, they may not actually improve performance (Sutcliffe, Ennis, & Hu, 2000).
Cluster hypothesis
Perhaps one of the most popular forms of visualization in information retrieval is
clustering. Clusters are groups of items that are placed together because of the similarity
between a query and retrieved documents and the interrelationship between retrieved
items.
It has been demonstrated that cluster-based information retrieval can be helpful
for improving retrieval effectiveness (Kang, Na, Kim, & Lee, 2007), and cluster-based
document browsing is more effective than a single merged list (Crestani, Wu, 2006).
Crestani and Wu’s study in 2006 demonstrates that cluster hypothesis continues to be
applicable in heterogeneous distributed information retrieval environments, and creating
hierarchical clusters is highly effective for presenting retrieved results in heterogeneous
distributed information retrieval environments. However, findings from the use of
cluster-based IR systems are not always absolute. Voorhees (1985) reported that in a
clustered-based retrieval, there is not a full ranking of the document collection and thus,
clustered-based retrieval is not agreeable to the creation of recall and precision graphs.
A more promising way of using the cluster hypothesis may be the visualized
clustering presentation of retrieval results. Evidence from Hearst and Pedersen’s
Scatter/Gather system supports the cluster hypothesis by employing a clustering
algorithm to cluster documents that have been retrieved (Hearst & Pedersen, 1996). A
study by Leuski evaluated the cluster hypothesis with six different hierarchical clustering
methods (single link, complete link, group average, weighted average, centroid, and
Ward) and concluded that the cluster-based results presentation indeed improves retrieval
systems’ effectiveness (Leuski, 2001). Another study by Xu and Croft proposed several
cluster-based browsing models and re-asserted the effectiveness of cluster-based
Topic Map
In the system developed for our study, clusters will be presented as a topic map. The
centroid of a cluster will be a topic, and other vectors will be treated as occurrences. The
use of topic maps is one of the most popular areas in the information retrieval field (Chen
& Yu, 2009). By using topic maps, users can navigate documents in a systematic manner
rather than browse through a generally unstructured list.
Stanescu’s study in 2009 developed a software tool by using a topic map for
graphical visualization of the MeSH thesaurus containing medical terms, which was
adopted by the Gastroenterology Department of the Medicine and Pharmacy University
of Craiova in Romania. 60 students using this software participated in a usability testing
experiment. 75% of them considered the topic map as an instinctive alternative tool
because it allows the graphical visualization of the associations between medical terms.
90% of the students regarded the query available in the topic map as much more efficient,
particularly the one using synonyms.
Yi’s study in 2008 explored how a topic maps-based ontology approach affects
users’ searching performance. Ultimately, recall is higher and search time is shorter in a
topic map-based IR system than a thesaurus-based IR system.
Summary
As a widely used method for presenting things impressively, visualization has proved
effective in the field of information retrieval. Though visualization of information
mentioned above demonstrate that clustering can benefit the process of information
R
ESEARCHM
ETHODOLOGYA new visualized IR system has been developed for this study. The system is a
cluster-based topic map of the IR system, which provides topic overview of a collection of
documents and aims to help users explore information in seeking documents in this
collection.
System Design
Data source
The visualized IR system is a cluster-based topic map publication search system. Thus,
the system is created based on a collection of publications. We used NeuroIS annual
proceedings as our data source. NeuroIS is a highly dynamic field where new knowledge
continually evolves and has resulted in a steady increase in the number of conference
proceedings. The proceedings of annual conference of NeuroIS involve past
achievements, current research and development projects, and possible avenues for the
future development of NeuroIS. Finally, we selected proceedings collections from 2012
to 2014, ending up with 75 publications in total.
Text mining algorithm
The algorithm that generated the clusters in the system were developed and published in a
the collection of documents was created for further analysis. TF*IDF was used to
calculate token/document weight and then a rank for each unique token in each document
was established based on the token/document weight. After that, the list of ranks in each
document was sorted. Tokens that were ranked between 1-R in at least D documents were
extracted. R and D are parameters selected by users and determine the quantity of the
tokens. In our system, we set R to 5 and D to 5% as default after parameter screening.
Since we only have 75 documents, the influence of D on token’s quantity is not
applicable. After we changed D from 1% to 13%, the quantity of tokens did not change at
all. However, if we change D from 13% to 14% with R set to 5, the tokens’ quantity
decreases from 322 to 40. The reason is that with a few documents, tokens that appear in
at least 2 documents are not very common (14% * 7 = 1.05, rounding to 2). Therefore, we
just enabled users to select R-value and kept D-value stable.
After the dictionary creation, each document was represented as a vector.
Latent Semantic Information was introduced to enhance document vectors. The next step
was to cluster vectors. The formula was adopted to calculate
the distance between two vectors. Then, calculated distances were used to group vectors.
A parameter theta was used to determine the appreciable fraction of the distance between
two existing clusters. In our system, we set theta to 0.9 as a result of parameter screening.
Experiments were conducted to test how well the algorithm clustered related
terms. The findings indicate that the implemented algorithms are stable, robust, and are
System introduction
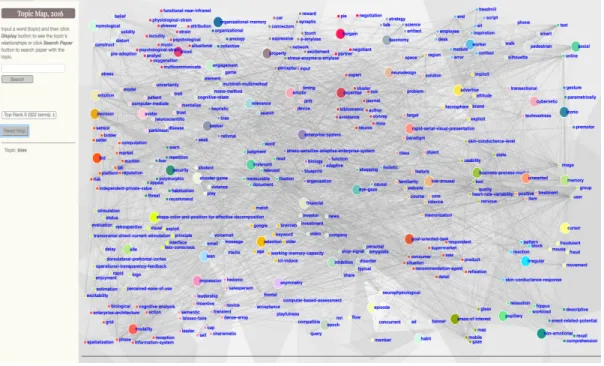
The cluster-based topic map developed in this study is a prototype of visualized IR
system. It mainly includes three components - an interactive topic map, a search result
section, and a side bar. The system is presented to users as shown in figure 1. The topic
map occupies a large part of the screen, with a side bar on the left. Under the topic map,
there is a section that displays search results for users’ retrieval. The retrieved documents
are ranked by token/document value.
Figure 1. The cluster-based topic map of IR system overview
In the topic map, each circle represents a token. Circles with the same color
indicate that the represented tokens are grouped into one cluster. In each cluster, the
circle that is bigger than others means that it is the centroid. That is, it stands for the topic
in its cluster. The circles with smaller size are occurrences of their topic.
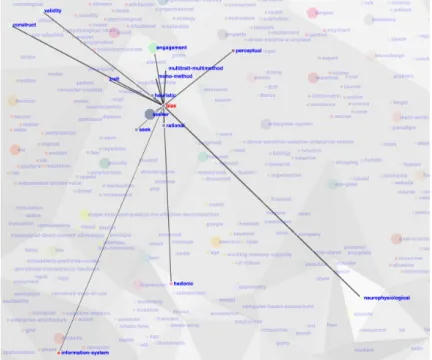
In the side bar, the search box has been implemented. Users can input a token
to display the relationships under this token (Figure 2). The relationships represent
model. The similarity values are ranked from high to low and presented below the search
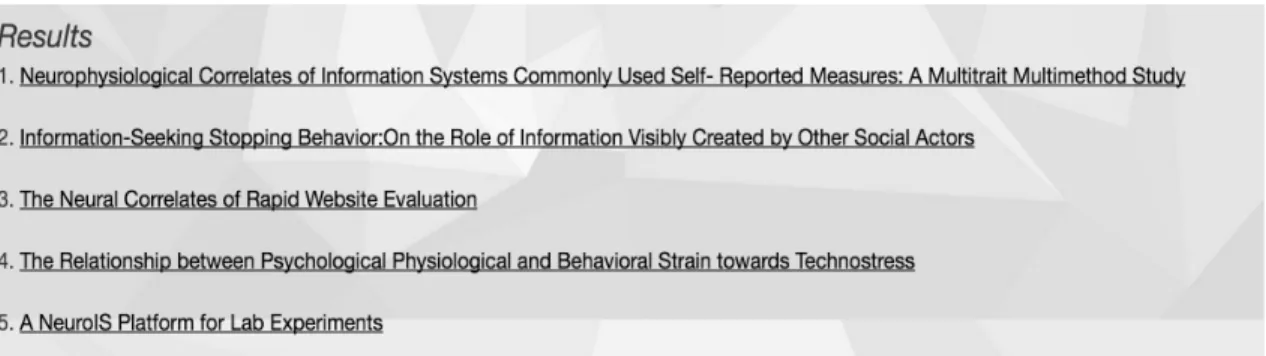
box (Figure 3). At the same time, the results from using this token as a query are
displayed in the search result section (Figure 4). Additionally, a filter is provided to select
the quantity of tokens by choosing the value of R.
Figure 2. Relationship display
Figure 4. Result section
This system is interactive. The functions built within search box can be
accessed by simply clicking a token in the topic map. That is, after clicking a token, the
token’s relationships and similarity values will be presented, as well as the search results
based on the token.
In general, the system is a simple but highly interactive representation of a
topic map. Technically, the interface is implemented by using JavaScript and D3 library.
Participant recruitment
Participants for the usability testing were all recruited from the University of North
Carolina at Chapel Hill by direct contact. The study protocol was approved by the
Institutional Review Board (IRB) and IRB number for this study is 16-0645. The
objective participants are graduate students, because our purpose is to see if our system
can help researchers to find publications more efficiently. We defined a researcher as an
individual who conducts research into something and has rich experience in searching
publications. Compared to undergraduate students, graduate students are more
strategies. According to Neilsen’s theory (1992), it is enough to run a usability test with a
small number of users such as 3 or 5, and we finally recruited 4 participants.
Experiments process
Experiments were all conducted using the Mac OS X system. Before usability testing
started, all participants were asked to self-evaluate their IR ability because we wanted to
make sure that all participants had exposure to IR systems and were experienced
information seekers. Specifically we asked questions: 1) ow much will you grade the
search effectiveness of your previous information seeking experience; 2) how much will
you grade the search efficiency of your previous information seeking experience; and 3)
how much are you confident about your previous information seeking results. The grade
of those questions ranges from 1 to 10. The higher the grade , the better the self-evaluated
IR ability is.
After asking the pre-test questions, we started usability testing. First,
participants were oriented to use the system. We showed them a contextual search task
and how to use the system to find information we need. The second step was to ask
participants to finish a search task. During this process, some questions like “why do you
click here?”, “why do you select this paper?” were asked to encourage participants to
think aloud. At the end, all participants were asked to answer post-test questions to
evaluate their satisfaction by using this system. The questions are below:
Q1 - I would like to use it to search papers in the future
Q2 - The system surprised me
Q4 - I can find papers easily
Q5 - The system helped me recall something I had not thought about
Q6 - The system helped me make decision
Q7 - I am confident that I made the right decision
In order to improve the intuitiveness of the system, we also collected
participants’ opinion towards system’s functionalities. The system offers a search box, a
filter to select tokens quantity and similarity details. Because we wanted to know how
much they are useful to information search in the system, we asked participants to grade
the usefulness of those functionalities from extremely useful (7) to extremely useless (1).
At the end of experiments, we also interviewed participants to clarify their feedback.
Data Collection
Each completed experiment was audio-recorded and participants search behavior were
extensively observed. The post-questionnaires provided by participants were thoroughly
S
YSTEMU
SABILITYR
EPORTThis part will mainly discuss findings from participants’ experiments. This study aims to
evaluate the effectiveness, efficiency and users’ satisfaction of the cluster-based topic
map of IR system. Thus, the results will primarily focus on these three aspects.
Simultaneously, because this system is just a prototype and there is still space for
improvement, we want to use participants’ feedbacks to offer valuable suggestions for
future enhancement. The discussion section which follows is an evaluation of the
interface design.
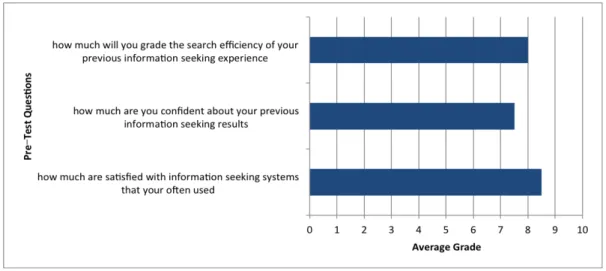
Pre-Test Findings
As mentioned before, all participants need to have exposure to IR system and are
experienced information seekers. The purpose of pre-test is to make sure the all
participants met the requirements. As we can see form the figure below, the average
grade of three questions are all greater than 7, which means participants all think that they
Figure 5. Grades on participants’ self-evaluation IR ability
Efficiency and Effectiveness Evaluation
The findings (Table 1) show that in general the average time taken by each participant for
the task is higher than the baseline time estimated. That P1 took a longer time than other
participants is because this participant wanted to find as many documents as possible. In
fact, this participant found the closely related document very quickly but spent a lot of
time in exploring more documents. Given that the collection only has 75 documents, the
ideal search results for the task actually only contain one document. It explains why this
participant’s search time is unexpectedly longer than others. However, the other
participants’ search time is not unacceptably longer than baseline.
Participant Search Time
P1 13:09
P2 5:57
P3 7:39
P4 5:20
Average 11:02 Baseline 5:34
All participants were able to successfully find papers related to the task, which
demonstrates that this system is effective for information exploration.
Users’ Satisfaction
Post-test questions results indicates that, overall, the participants were satisfied with the
system. All participants were able to easily navigate through the system and explore
information with the help of the topic map.
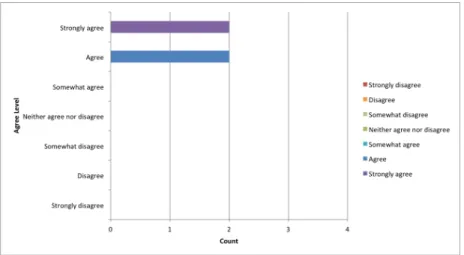
Four participants gave positive feedback about the system. Two of them stronly
agreed to use this system in the future, while other two agree with that. One participant
mentioned that by increasingly interactively, the system should have more power for
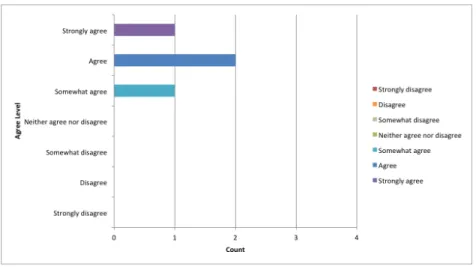
information retrieval. For the statement that the system surpised me, two participants
agreed with it. Two participants expressed that they have seen topic maps being used in
IR systems before so this visulized IR system might not be a surpise for them. All
participants agreed that the papers they found satisfied their information need and they
could conduct the search easily, which means participants were able to locate relevant
information in a short time. Those participants all showed high agreement on the
statement that the system helped them recall things that they had not thought about. It
was found, after participants navigated to a specific token, they would check all tokens
that have relationship to it very carefully. Some participants were surprise to find helpful
tokens associated to their information needs. All participants were confident that they
made right decision in navigating and searching tokens. It reflects that the system did
assist in reducing participants’ uncertainty during the search process.
Figure 6. Q1- I would like to use it to search paper in the future
Figure 7. Q2 – The system surprised me
Figure 9. Q4 - I can find papers easily
Figure 11. Q6 - The system helped me make decisions
Figure 12. Q7 – I am confident that I made the right decision
Evaluation of the Interface Design
The system has several functionalities to facilitate users’ information seeking: a search
box, a filter to decide the quantity of tokens, similarity values detail. The post
questionnaire also asked participants to judge how useful the three functionalities are.
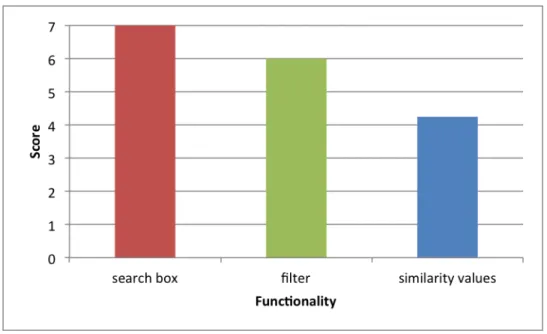
Figure 13. User’s feedback on three functionalities
Participants relied heavily on the search box
As shown in the Figure 13, participants gave an average score of 7 for the search box
functionality, which means all of them thought that the search box is extremely useful.
All participants started their search by inputting a token in the search box because the
topic map has so many tokens, and it can be overwhelming. It was found that every time
participants wanted to start a new search or they were unable to obtain useful information
by looking through topic map relationships after clicking a token, they would use search
box to quickly navigate through the system. However, the topic map still offers clues for
The filter can be more functional
The average score of this functionality is 6. 2 Participants did not use this functionality
because they said they forgot to use it. They indicated, however, they were likely to use
this functionality if they were reminded about it.
Participants did not care about the details of similarity values
The lowest score came from the similarity values component. During the experiment, we
found that only one participant cast a glance on the similarity values but this participant
said that it did not help to the information seeking.
Implications and Future Work
According to the results of obtained, the cluster-based topic map of IR system
demonstrates its strength in helping users seek information. Participants were able to find
papers easily by using the system and the topic map indeed gave clues for participants’
information exploration.
Still, some limitations were revealed. First, the system only allows single token
search. However, researchers tend to use combination of multiple words to search
nowadays. Therefore, it would be better if users can select different tokens at the same
time, as it can reduce less relevant documents. Second, the search box does not allow
full-text or derivations search. Participants cannot find the token unless they input exact
token. Since participants heavily rely on the search functionality, we need to empower
them to conduct more practical and meaningful search. Finally, in our system, we only
situation. With the increase of documents, we need improve this functionality by giving
B
IBLIOGRAPHYAhn, J. W., & Brusilovsky, P. (2013). Adaptive visualization for exploratory information retrieval. Information Processing & Management, 49(5), 1139-1164.
Belkin, N. J., Oddy, R. N., & Brooks, H. M. (1982). ASK for information retrieval: Part I. Background and theory. Journal of documentation, 38(2), 61-71.
Capra, R. G., & Marchionini, G. (2008, June). The relation browser tool for faceted exploratory search. In Proceedings of the 8th ACM/IEEE-CS joint conference on Digital libraries (pp. 420-420). ACM.
Chalmers, M., & Chitson, P. (1992, June). Bead: Explorations in information
visualization. In Proceedings of the 15th annual international ACM SIGIR conference on Research and development in information retrieval (pp. 330-337). ACM.
Chen, J., & Yu, Y. (2009, August). Information retrieval based on topic map and grid agent technologies. In IT in Medicine & Education, 2009. ITIME'09. IEEE International Symposium on (Vol. 1, pp. 341-344). IEEE.
Crestani, F., & Wu, S. (2006). Testing the cluster hypothesis in distributed information retrieval. Information Processing & Management, 42(5), 1137-1150.
Dearholt, D. W., & Schvaneveldt, R. W. (1990). Properties of Pathfinder networks. Griffiths, A., Robinson, L. A., & Willett, P. (1984). Hierarchic agglomerative clustering methods for automatic document classification. Journal of Documentation,
40(3), 175-205.
Fu, Y., Bauer, T., Mostafa, J., Palakal, M., & Mukhopadhyay, S. (2002, November). Concept extraction and association from cancer literature. In Proceedings of the 4th international workshop on Web information and data management (pp. 100-103). ACM.
Hearst, M. A., & Pedersen, J. O. (1996, August). Reexamining the cluster hypothesis: scatter/gather on retrieval results. In Proceedings of the 19th annual international ACM SIGIR conference on Research and development in information retrieval (pp. 76-84). ACM.
Hemmje, M., Kunkel, C., & Willett, A. (1994, January). LyberWorld—a visualization user interface supporting fulltext retrieval. In SIGIR’94 (pp. 249-259). Springer London.
Johnson, B., & Shneiderman, B. (1991, October). Tree-maps: A space-filling approach to the visualization of hierarchical information structures. In Visualization, 1991. Visualization'91, Proceedings., IEEE Conference on (pp. 284-291). IEEE.
Kang, I. S., Na, S. H., Kim, J., & Lee, J. H. (2007). Cluster-based patent retrieval.
Information processing & management, 43(5), 1173-1182.
Korfhage, R. R. (1991, September). To see, or not to see—is That the query?. In
Proceedings of the 14th annual international ACM SIGIR conference on Research and development in information retrieval (pp. 134-141). ACM.
Koshman, S. (2004). Comparing usability between a visualization and text-based system for information retrieval. Journal of Documentation, 60(5), 565-580.
Koshman, S. (2006). Visualization-based information retrieval on the web. Library & information science research, 28(2), 192-207.
Leuski, A. (2001, October). Evaluating document clustering for interactive information retrieval. In Proceedings of the tenth international conference on Information and knowledge management (pp. 33-40). ACM.
Lin, X., Soergel, D., & Marchionini, G. (1991, September). A self-organizing semantic map for information retrieval. In Proceedings of the 14th annual international ACM SIGIR conference on Research and development in information retrieval (pp. 262-269). ACM.
Marchionini, G. (2006). Exploratory search: from finding to understanding.
Communications of the ACM, 49(4), 41-46.
Marchionini, G., Wildemuth, B. M., & Geisler, G. (2006). The open video digital library: a Möbius strip of research and practice. Journal of the American Society for Information Science and Technology, 57(12), 1629-1643.
Nielsen, J. (1992). The usability engineering life cycle. Computer, 25(3), 12-22. Olsen, K. A., Korfhage, R. R., Sochats, K. M., Spring, M. B., & Williams, J. G. (1993). Visualization of a document collection: The VIBE system. Information Processing & Management, 29(1), 69-81.
Voorhees, E. M. (1985). The effectiveness and efficiency of agglomerative hierarchic clustering in document retrieval. Cornell University.
Shneiderman, S. B., & Plaisant, C. (2005). Designing the user interface 4 th edition. ed: Pearson Addison Wesley, USA.
Stanescu, L., & Burdescu, D. (2009). Information structuring and retrieval with topic maps for medical E-learning. Advances in Electrical and Computer Engineering, 9(3), 27-33.
Xu, J., & Croft, W. B. (1999, August). Cluster-based language models for distributed retrieval. In Proceedings of the 22nd annual international ACM SIGIR conference on Research and development in information retrieval (pp. 254-261). ACM.
Yi, M. (2008). Information organization and retrieval using a topic maps‐based ontology: Results of a task‐based evaluation. Journal of the American Society for Information Science and Technology, 59(12), 1898-1911.