A Novel Trust Evaluation Model Using Graph
Clustering Approach
Mohammad Ali Mahmoodyar
MSc Student, IT GroupIndustrial Engineering Department, K. N. Toosi University of Technology, Tehran, Iran
Mohamamd Jafar Tarokh
PhD., Associate Professor, IT Group
Industrial Engineering Department, K. N. Toosi
University of Technology, Tehran, Iran
[email protected]
Received: November 4, 2015- Accepted: April 23, 2016
Abstract— This is the time of rapidly developme nt of electronic relationships between the users of a social
network. Any entity in e-interactions has to make decision about trust/distrust to others with respect to the data available on the network. Also the lack of significant information about the entities becomes a challenge that any trust evaluation model has to deals with it. In this paper, a model for evaluation trust with respect to the users’ feedbacks is proposed. The model, is based on a unique generated trusted graph which is the result of applying a proposed initial trust value metric. Also, the communities consisting the network is detected using Markov Clustering Algorithm (MCL). This paper also presents a categorical -based appr oac h for trust evaluation. The proposed model has been compared to another trust metric which is proposed by another paper and. The results, which achieved using Normalized Root Mean Squared Error (NRMS E), show the effects of proposed initial trust value and proposed final trust rate on the final trust evaluations . By more affecting the final trust rate, the model goes more closely to the basis trust metric used for comparing results.
Keywords-component; Trusted Graph; User Reputation; Graph Clustering; Markov Clustering Algorithm (MCL)
I. INT RODUCT ION
Trust in this rapidly developing age, is one of the most important issues which has to be considered by anyone who wants to have some interactions in the online social platforms or make some transactions using the tools provided by electronic commerce. In the case of commercial interactions, trust will find more and more important than other conditions. But with lack of significant information about unknown entities, evaluating trust has become to a challenging issue in the electronic social platforms such as online communities. The fundamental question is that, how a new entered entity in an electronic network, can trust to others when his/her information about others is not sufficient? Also,
what is the effect of efficiently trust evaluation on the network performance?
Nevertheless, both, the lack of significant information about unknown entities and also providing some trust measures are the issues which have to be considered is trust evaluation. Furthermore, another aspect of trust evaluation is about the network size and the complexity of the electronic social networks which contains thousands or millions number of edges /nodes. Also, any electronic social network consists of some communities which links the related people whom share some interest together. To realizing these communities, the graph clustering is a good approach to
deal with the complexity and huge number of nodes and edges.
The key idea and main contributions of this paper is as follows:
A. Trusted Graph Producing: A new measure based on both trust/distrust feedbacks, provided by the users of the network, is proposed to producing the basic trusted graph. The proposed measure is then used for clustering the trusted graph and finding related people on the same communities.
B. Trusted Graph Clustering: By using the produced trusted graph in the previous step, the graph clustering approach is used in order to find the communities consisting the network and also dealing with the complexity of the initial network.
C: Considering Users Reputations: By clustering the trusted graph, a method for evaluating undefined trust between nodes with a categorical-based approach is proposed. The categorical-based approach enables the model to apply on a broad range of information provided by the users. In other words, the model uses the feedbacks provided by users on the contents published by others and these feedbacks will be a valuable information in order to calculation of trust in the social network.
The rest of the paper is organized as follows: Some important concepts have been mentioned in section 2. Also some related works and papers about trust evaluation in social networks have been addressed in the section. In section 3, the model and its methodology has been introduced. This section also consists of trust evaluation measures and mathematical relationships between the nodes of the produced network. In section 4, the dataset used for applying the model has been described and some results and experiments have been mentioned. Finally, in section 5, some notes and conclusions about the work have been addressed and also some suggestions have been proposed for the future woks.
II. BASIC CONCEPT S
In this section, some important concepts about trust evaluating in an electronic social network is explained and then a few related works have been addressed for review the area.
A. Important Concepts
Trusted Graph: A trusted graph is a sub-network of a trust network, starting from a trustor, ending at a trustee, and connect by a set of trusted paths. [1]
Trustor: a trustor is a user who wants to know whether to trust someone else and starts the transitive trust evaluation. [1]
Trustee: a trustee is a use who is being considered for interaction and is end of a transitive trus t evaluation. [1]
Transitive Trust Evaluation: evaluating trust of a trustee from a trustor which contains multiple paths to trustee and there is not any direct path from start node to the end node.
Graph Clustering: the process of separation of sparsely connected dense sub-graphs from each other’s is called graph clustering. [2]
B. Related Work s
Trust evaluating in social networks and online communities is one the most challenging issues in scientific papers. In order to find the basis of trust evaluation, in this sub section some related works have been mentioned. [3] proposed a robust trust management scheme and separates attacks in an online network to three types of “Bad mounting”, “on-off attack” and “Sybil attack”. Trust assessment strategy in the paper consists of two separated parts: direct trust and indirect trust. In order to calculate direct trust, the paper proposed to use an erosion function which reflects the satisfaction and dissatisfaction of a user. For calculating indirect trust value, total number of communication from a single node is considered and a trust value maintenance is proposed. Another paper [4] proposed a novel method using reputation and risk to calculate trust value of a user. The paper notes that a trust metrics consists of both trust value and risk value and overall trust is result of differentiating these two variables. As like as previous reviewed paper, the paper uses both direct and indirect trust in order to calculate trust value. Because of case study uses in this paper, this paper separates the quality of services to four dimensions which can be defined by the user of system. Also this paper uses the term “credibility” to describe how much a peer can trust the recommendations provided from another peer.
Another paper [5] which is more related to the work in this paper, proposed an effective trust based recommendations method using a novel graph clustering algorithm. The paper proposed a graph clustering algorithm and is focused on finding effective recommendations based on trust and similarities between users of a community. Also, the authors proposed to use the ratings provided by users of a network to products and before proposing the method, a graph visualization is passed. The produced graph in the paper consists of nodes, edges and also likeness of users of the network. Authors also use a new proposed graph clustering algorithm to find natural groups amongst thousands groups in the network.
Another paper [12] proposed a trust framework named MeTrust which bridging between a user’s profile and multi evidence trust. The paper divides trust management system to three steps: Evidence Collection, Trust Evaluation and Decision Making. In the paper, trust is calculating in three layers: node, path and graph (network). In each layer, each node collects some multi dimensions evidences from his/her neighbors and evaluates trust based on combining these collected evidences. In the path layer, based on trustor’s threshold and the power of trust, some paths in order to generating a trusted graph will find and also an erosion rate will define by the user. The erosion rate used in the paper is one of the personal dimensions used for trust evaluation. The authors say that multi dimensions can be viewed as a vector version of the traditional evidences.
III. PROPOSED MODEL
In this section, the model and the methodology used for trust evaluation is described. Also the relationships between the nodes of the generated network have been mentioned. Address the distrust measure is one of the main differences between this model and some other previous presented models. Also, this model cons ists of a graph clustering step in order to deal with the huge number of nodes in the trusted graph. Another aspect of difference of this work with others, is using a categorical approach which enables it to use for any contents.
A. Proposed Methodology
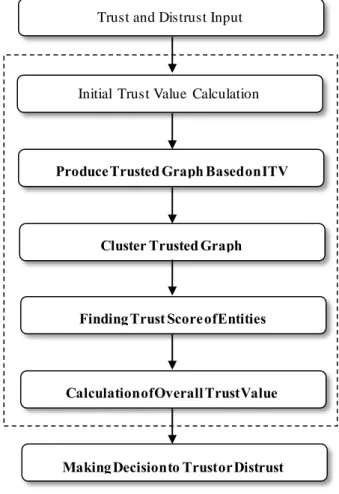
As shown in Fig. 1 the model consists of five main phases. At step one, an initial trust value (ITV) is calculated between nodes pairwise in order to generating the unique trusted graph. This initial trust value considers both trust/distrust feedbacks which provided by the users of the network. At second phase, the trusted network can be generated using initial trust value. Third phase, deals with clustering the produced trusted graph using Markov Clustering Algorithm (MCL) [6] which is one the best algorithms for clustering graphs. At fourth phase, the score of the generated clusters, as the network communities, can be calculated. This score will be used as a measure for evaluating final trust value. After that, in fifth phase, the model goes ahead of finding the overall trust value between two distinct nodes.
B. Initial Trust Value
As described in the previous section, in order to generating the trusted network, it is necessary to find an initial weight for edges which represents the initial relationships of the nodes pairwise. Both trust/distrust measures have been considered in determination of initial trust value. In this measure, only the distrust feedbacks provided by the friends of an entity have been considered which converts the ITV to a cynical measure. Initial Trust Value is defined as follows:
𝐼𝑇𝑉𝑖𝑗 = {
0. 𝐶𝐷𝑉𝑖𝑗 ≥ 𝐽𝐹𝑖𝑗
1 −𝐶𝐷𝑉𝑖𝑗
𝐽𝐹𝑖𝑗 . 𝑒𝑙𝑠𝑒
(1)
Eq. (1) is consists of two other variables 𝐶𝐷𝑉𝑖𝑗 and
𝐽𝐹𝑖𝑗. The first variable 𝐶𝐷𝑉𝑖𝑗 addresses distrust measure
and calculates the number of node i’s friends which have distrust relationship with j. For example if node i has 10 friends and 6 of them have distrust relationship with node j, then 𝐶𝐷𝑉𝑖𝑗 will equals to %60. The second
variable in Eq. (1) is 𝐽𝐹𝑖𝑗 which represents the number
of joint friends for both nodes i and j. This variable considers the trust relationship between nodes pairwise. If a single node has trust assessment of another node, it can be considered the relationship as a friend relationship. With considering 𝐽𝐹𝑖𝑗 the relationship
graph can be generated and then the edges’ weight can be calculated using Eq. (1). So the unique trusted network is made by this equation.
Fig. 1 - The Proposed Methodology for trust evaluation
C. Clustering the Generated Trusted Graph
This is the third step of the proposed model that deals with the huge number of nodes and edges in the produced trusted graph, described in the previous sub-section. Tens thousands of nodes and edges are ready to face with the model and if the communities consisting this network can be detected, then more accuracy will be gained. So the graph clustering approach is proposed to use in order to partitioning the graph and groups of users with respect to Eq. (1) used to build the trusted graph. In order to clustering the graph, an interesting graph clustering algorithm named Markov Clustering Algorithm (MCL) [11] has been used. It is an unsupervised clustering method that has been successfully used in biology [6] and text mining. [7]. MCL is based on the data mining slogan which says more and more relationships between items of a clusters and less and less relationships between any two items in two separated clusters. So in graph clustering, each cluster may have many link between the nodes placed in the cluster and few across clusters [8]. This algorithm is based on random walk idea which says if we start randomly from a node, it is possible to stay in the cluster of nodes if we randomly move to the neighborhoods of the node. From the performance point of view, we can say that MCL is more powerful than some other graph clustering algorithms such as Geometric MST Clustering (GMC). [2]
Initial Trust Value Calculation
Produce Trusted Graph Based on ITV
Cluster Trusted Graph
Finding Trust Score of Entities
Calculation of Overall Trust Value
Making Decision to Trust or Distrust Trust and Distrust Input
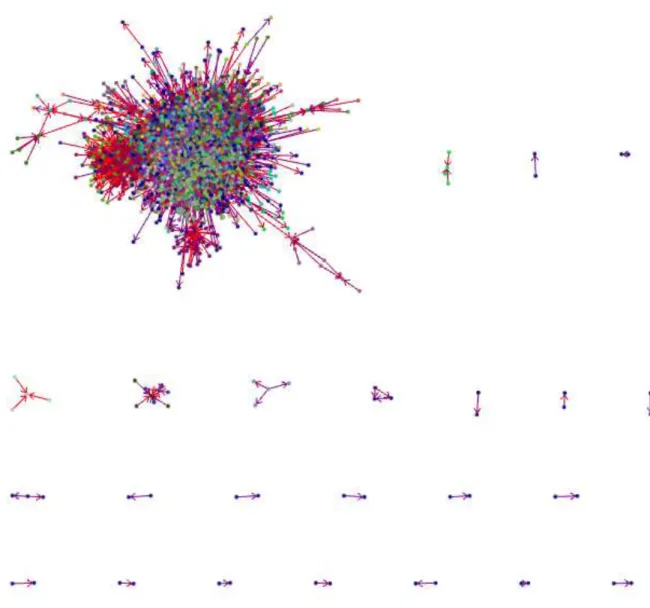
Fig. 2 – Stages of follow simulation in MCL [11] Based on [11], MCL algorithm process is shown in Fig. 2. The initial state is placed on top-left and final state of graph clusters is shown on bottom right. Fig. 2 shows cutting the weak connectivity between nodes on the graph and clustering process in MCL.
D. Trust Score
In the model proposed in this paper, any entity based on published contents and ratings received, will find a score and then this score can be used in order to find the clusters’ score and finally, the clusters’ score can be used for finding the Overall Trust Value between two distinct users of the network.
As described before, this model focused on a category-based concept and data provided by users of the social network. Then, there is some categories which contain of a few related contents in them. We may assume the categories set and contents set as follows:
𝑆𝑒𝑐𝑡𝑖𝑜𝑛𝑠 𝑆𝑒𝑡 = {𝑆1. 𝑆2. … . 𝑆𝑚}
𝐶𝑜𝑛𝑡𝑒𝑛𝑡𝑠 𝑆𝑒𝑡 = {𝐶1. 𝐶2. … . 𝐶𝑛}
As mentioned, any user in the network can rate others published contents and this is a precious feedback provided by the customers of the network. This feedback is a fundamental element in calculating trust score of user i in section s. The user’ i trust score in section s can be calculated using Eq. (2) as follows:
𝑇𝑆𝑠𝑖=
∑ ( 1
𝜏𝑠−𝐷𝑀𝑗𝑠+1) ∑∀𝑐∈𝑆(𝑖 .𝑠)𝑅𝑒𝑖𝑗𝑐 ∀𝑗∈𝐴(𝑖)
∑𝑐∈𝑆(𝑠)𝑅𝑎𝑐 (2) In Eq. (2), 𝐴(𝑖) is the set of all users, rated to i's contents. Also, 𝑆(𝑠) and 𝑆(𝑖. 𝑠) are the set of all contents published in category s and all contents published by i in category s respectively. Another variable 𝑅𝑒𝑖𝑗𝑐 reflects the rate of user j to user i for
content c. Finally 𝑅𝑎𝑐 is used in order to normalize the
effect of the numerator variables and reflects the rate of provided by all users in category c.
Using Eq. (2) a measure to find a node score with respect to his friends’ feedbacks to his/her contents is obtained with respect to the contents categories. Also Eq. (2) addresses the number of published contents in a category. But in the equation two other variables:
𝜏𝑠. 𝐷𝑀𝑗𝑠 are placed that described as follows.
There is a variable called Distinction Mean (DM) for illustrating difference of a user to the overall state. This variable, is the result of differentiation of two other variables called Overall Rating Standard Deviations (ORSD) and User Rating Standard Deviations (URSD) which have described below:
𝐷𝑀𝑚𝑠 = |𝑂𝑅𝑆𝐷𝑠 − 𝑈𝑅𝑆𝐷𝑚𝑠| (3)
𝐷𝑀𝑗𝑠 is used to show the difference of a user j from
overall state of database records in a specific category s. 𝑂𝑅𝑆𝐷𝑠 is the standard deviations of total ratings
provided by all users in category s. Also 𝑈𝑅𝑆𝐷𝑚𝑠𝑘 is the
standard deviations of ratings provided by user m in category s. So these two variables can be used in order to find the difference of a user from overall state of network.
Now the misconduct behavior of a user by using Eq. (3) is calculated. So to protect the trust score calculation from the misconduct behavior, another variable 𝜏𝑠,
maximu m distinction mean is calculated as follows:
∀𝑛 ∈ 𝑀𝑒𝑚𝑏𝑒𝑟𝑠 . 𝜏𝑠= 𝑀𝑎𝑥{𝐷𝑀𝑛𝑠} (4)
By using Eq. (4) the maximum value of distinction mean can be fined and this variable can be used to affect trust score calculation and difference of a user from others in the network.
This is final stage of trust calculation in our model. ITV and TS are using in this step in order to find final trust value (FTV). After calculating trust score of each entity in a cluster, the average of trust scores in each cluster can be fined the clusters can be sorted using this average. So the score of each cluster C can be fined using Eq. (5) as follows:
𝑇𝐴𝐶 =
∑∀𝑖∈𝐶. ∀𝑠∈𝑆𝑇𝑆𝑠𝑖
𝑛 (5)
In Eq. (5), n is total number of nodes placed in cluster C and 𝑇𝑆𝑠𝑖 is calculated using Eq. (2).
Now it is time to find the Final Trust Rate (FTR) of two nodes using clusters average score, initial trust value of cluster nodes to the target node and initial trust value of trustor to a cluster’s members. We can calculate FTR using the following equation:
𝐹𝑇𝑅𝑖𝑗= ∑∀𝐶𝑇𝐴𝐶(∑∀𝑚∈𝐶𝐼𝑇𝑉𝑖𝑚)(∑∀𝑛∈𝐶𝐼𝑇𝑉𝑛𝑗) (6)
In Eq. (6), C reflects to each cluster, i is the trustor who wants to know if he/she can trust j as trustee.
The trust value between two distinct nodes can be fined from Eq. (7) as follows:
𝑇𝑉𝑖𝑗 = 𝛼𝐹𝑇𝑅𝑖𝑗 + (1 − 𝛼)𝐼𝑇𝑉𝑖𝑗 (7)
In Eq. (7) three variables have placed for trust value of the nodes pairs. FTR and ITV are described variables which reflects the final trust rate and initial trust value respectively. But another variable alpha, is placed in
Eq. (7) in order to find which conditions is the best for both FTR and ITV. Some results about this variable has been explained in next section.
IV. EXPERIMENT S AND SIMULAT IONS
Now, it is time to pass the model from a real dataset. The dataset specifications have been described in follows and evaluation measures have been mentioned in sub-section 4.3. Also, some results from applying model to the dataset is described in sub-section 4.3.
A. Dataset
The model has been applied on Epinions Extended Dataset in order to find the real experiments about the model. In the dataset, users can rate to others published contents and also any content is placed on a unique category. Another aspect of the dataset is the Boolean trust/distrust feedbacks provided by users. In other words, any user may has complementally trust or complementally distrust to other user. So, these feedbacks can be used for applying in the proposed model. In table 1 records size of the dataset is presented.
Table 1 – Initial size of Epinions Dataset Data Type Number of Records
Users 131828
Trust Relationship 717667 Distrust Relationship 123705
User Ratings 13668319
Content Published 1560144
But before applying the model on this dataset, it is important to pass a preprocess step for cleaning the dataset from missed or unmatched data. Then the cleaning step has been passed and then the finally size of the dataset reduced in some types of record s. For instance, some user ratings didn’t match to the contents published by users. Also from the definitions in Epinions, any user may rate to others published contents from 1 to 5. But in the dataset, some records had ratings with value of 6. So these ratings have been deleted from the dataset. Another aspect of cleaning was about content published by users. Some records in this type of data, didn’t match to the category of contents records. In other words, some contents provided by users didn’t place to any category in the dataset. Therefor the dataset has been cleaned from these missed or unmatched data. Table 2 shows the finally size of used dataset to applying the model.
Table 2 – Dataset size after preprocessing
Data Type Records Change
Users 131828 -
Trust Relationship 717667 - Distrust Relationship 123705 - User Ratings 12771543 -%7.00 Content Published 1082244 -%30.63
B. Applying the Model
As described in section 3, the first step in the methodology is applying Eq. (1) on the dataset to find
Fig. 3 – Initial Trust Value (ITV) Distribution the initial trust value and generating the unique trusted graph.
Then by using this equation, the initial and unique trusted graph based on trust/distrust feedbacks provided by users of Epinions is generated. The weight of edges in this graph, represents the initial trust value from a trustor to a trustee which is obtained from two variables based on Eq. (1): number of joint friends and number of trustor’s friends whom have distrust appraisement to trustee. But based on Eq. (1) some edges found the weight of zero and because this equation is initial trust metric, then these edges were excluded. Then, a dataset with about 7000 records of users (as the trusted graph nodes) more than 100000 records of relationship between the users (as the trusted graph edges) is reached to using in the next step. Fig. 3 represents the Equal-Width diagram of initial trust value distribution based on Epinions trust and distrust dataset. Horizontal axis in this figure represents the amount of initial trust value calculated using Eq. (1).
It is shown in Fig. 3 that 11616 relationships between the users is recognized as completely no -trust. Also, the figure gives the fact that the users have an increased tendency for trust when ITV is greater than %65.
By applying Initial Trust Value with respect to trust/distrust measures, a trusted graph with 112346 edges has been generated. In table 1, it is mentioned that there is 717667 trust relationship in the dataset. But after applying ITV, some edges have been erased due to distrust feedbacks. In other words, some of edges, received ITV score of zero or a negative number and then, they haven’t considered in the trusted graph producing step. The produced trusted graph has been shown in Fig. 4 using BioLayout Express3D [10] which is a good tool for graph visualization and also graph clustering. Then, the clustering step has been performed using MCL clustering algorithm with this software. The inflation parameter used for clustering was 2.2.
C. Evaluation Measurement
By passing the dataset from the model, a unique trust measure is produced. So it is important to compare this measure from another trust metrics provided by other published papers. So, the trust metric used in paper [5] has been chosen in order to compare the results of the model. This paper, also uses the graph clustering concept and finds trust value based on common rated contents by two distinct users .
11616
21 104 203 485 645 274 1416 744 565
6062
450 2264 1349
6385 7084 6886 7621
15794 23527 24019 N O T R U S T 1 0 5 0 6 1 0 1 1 1 5 1 6 2 0 2 1 2 5 2 6 3 0 3 1 3 5 3 6 4 0 4 1 4 5 4 6 5 0 5 1 5 5 5 6 6 0 6 1 6 5 6 6 7 0 7 1 7 5 7 6 8 0 8 1 8 5 8 6 9 0 9 1 9 5 9 6 1 0 0 #Nodes
Fig. 4 - Epinions Network Based on Initial Trust Value
This trust metric can be calculated using Eq. (8) as follows:
𝑇𝑟𝑢𝑠𝑡 (𝑢. 𝑣) =𝑐𝑎𝑟𝑑(𝐴𝑢.𝑣)
𝑐𝑎𝑟𝑑(𝐴𝑢) (8) In Eq. (8) 𝐴𝑢 .𝑣 is a set of common rated items by
user u and v and 𝐴𝑢 is the set of items rated by user u.
𝑐𝑎𝑟𝑑 (𝐴𝑢.𝑣) and 𝑐𝑎𝑟𝑑 (𝐴𝑢)defines the number of
elements in sets 𝐴𝑢.𝑣 and 𝐴𝑢.
Then, Normalized Root Mean Square Error (NRMSE) has been used for comparing both metrics provided by the proposed model and the metric proposed in the paper [5]. This is a useful metric when one wants to compare two values of predicted and sample state. NRMSE can be find from Eq. (9) as follows:
𝑁𝑅𝑀𝑆𝐸 = 1 𝑣⁄ 1
√∑𝑛𝑖 =1(𝑣2− 𝑣1)2
𝑛
⁄ (9)
In Eq. (9), n is the total number of items are comparing and 𝑣1 and 𝑣2 are the predicted value and
basic value.
The model has been applied on the dataset using a personal computer with 2.3 GHz CPU and 8GB of RAM. For simplicity, all data converted to SQL format. Also in converting step some functions have been wrote using VB.NET.
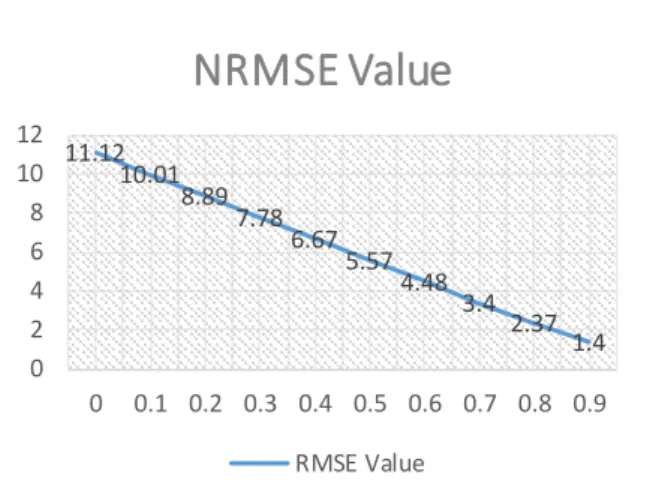
As mentioned before, the metric NRMSE has been used for comparing the model with the described trust measure. In Fig. (5) NRMSE has been shown for different values of α in Eq. (7).
Figure 5 shows that by decreasing the value of alpha in Eq. (7), the final results will closer and better to the another proposed trust metric described before.
Fig. 5 – NRMSE results for different 𝛼 values It is a predictable result. Because the proposed model in this paper, uses feedbacks provided by friends and also uses a graph clustering approach in order to find the related people in the same communities. So initial trust value which only relies on the Boolean feedbacks of users (trust or dis trust) can’t be a good measure for finally decision making. So the rating, contents published by users and also ratings received have to be considered in trust evaluation.
All these variables have been mentioned in the proposed methodology and proposed mod el in this paper and.
V. CONCLUSIONS
Trust in online communities which consists of the entities who didn’t know them, is one interesting subject and the models to predict trust are developing through time. Feedbacks of the users in an online community, is a precious material for predicting trust. Actually this may the only data which is available for trust evaluating and any model has to consider this data. In this paper, users’ feedbacks to others have been used in two steps: first in initial trust value, the Boolean feedback of trust/distrust has been used for generating the trusted graph and second, the users’ feedbacks and also contents published by a user in a category was another measure in predicting trust value between two users. Also, the graph clustering approach has been used in order to find the communities consisting the network. This, was a good choose because of the complexity of the network and huge number of edges and nodes in the generated trusted graph. So the clustered trusted graph was the basic material of trust evaluation in the proposed model in this paper. Also in order to test the model, Epinions Extended dataset has been used and also some cleanings on the dataset have been performed. Finally, in order to find the accuracy of the proposed model, another trust metric provided by another paper which also used the graph clustering approach, has been chose for comparing the model. The final trust metrics provided by both models were compared using Normalized Root Mean Squared Error and results shows that by less effect of initial trust value, more accurate predicted trust value will achieve.
REFERENCES
[1] Jiang, Wenjun, Guojun Wang, and Jie Wu. "Generating
trusted graphs for trust evaluation in online social networks." Future generation computer systems 31 (2014): 48-58.
[2] Brandes, U., Gaertler, M ., & Wagner, D. (2003).
Experiments on graph clustering algorithms (pp. 568-579). Springer Berlin Heidelberg.
[3] An, Do-sik, Byong-lae Ha, and Gi-hwan Cho. "A
Robust Trust M anagement Scheme against the M alicious Nodes in Distributed P2P Network." International Journal of Security and Its Applications 7.3 (2013): 317-326.
[4] Tian, Chunqi, and Baijian Yang. "Trust, a reputation
and risk based trust management framework for large-scale, fully decentralized overlay networks." Future Generation Computer Systems 27.8 (2011): 1135-1141.
[5] M oradi, Parham, Sajad Ahmadian, and Fardin
Akhlaghian. "An effective trust-based recommendation method using a novel graph clustering algorithm." Physica A: Statistical M echanics and its Applications (2015).
[6] Enright, Anton J., Stijn Van Dongen, and Christos A.
Ouzounis. "An efficient algorithm for large-scale detection of protein families." Nucleic acids research 30.7 (2002): 1575-1584.
[7] Theodosiou, Theodosios, et al. "PuReD-M CL: a
graph-based PubM ed document clustering methodology." Bioinformatics 24.17 (2008): 1935-1941.
[8] Valsamidis, Stavros, et al. "A clustering methodology
of web log data for learning management systems." Journal of Educational Technology & Society 15.2 (2012): 154-167.
[9] M assa, Paolo, and Paolo Avesani. "Trust -aware
bootstrapping of recommender systems." Proceedings of ECAI 2006 workshop on recommender systems. Vol. 28. 2006.
[10] Goldovsky, Leon, et al. "BioLayoutJava." Applied
bioinformatics 4.1 (2005): 71-74.
[11] Van Dongen, Stijn. "A cluster algorithm for graphs."
Report-Information systems, 10 (2000): 1-40.
[12] Wang, Guojun, and Jie Wu. "M ulti-dimensional
evidence-based trust management with multi-trusted paths." Future Generation Computer Systems 27.5 (2011): 529-538
Mohammad Ali Mahmoodyar is a M .Sc. student in Electronic Commerce at K.N. Toosi University of Technology. His current research interests are in graph analysis, graph mining, trust evaluation
and social networks analysis.
Mohammad Jafar Tarokh is an associate proffessor in the departement of Inudstrial Enginnering at K.N. Toosi University of Technology, Tehran, Iran. Recentrly, he has established Strategic Intelligence Research Lab (SIRL) at K.N. Toosi University of Technology . He received his B.Sc from Sharif University of Technology in Tehran, his M .Sc from University of Dundee in UK and his Ph.D from University of Bradford, UK. His main research interests are in knowledge management, business intelligence, customer relationship management and supply chain & management.
11.12 10.01
8.89 7.78
6.67 5.57
4.48 3.4
2.37 1.4 0
2 4 6 8 10 12
0 0.1 0.2 0.3 0.4 0.5 0.6 0.7 0.8 0.9
NRMSE Value
RMSE Value
![Fig. 2 – Stages of follow simulation in MCL [11]](https://thumb-us.123doks.com/thumbv2/123dok_us/8369830.2222918/4.893.105.433.84.410/fig-stages-follow-simulation-mcl.webp)