For release 10:00 a.m. (EDT) Wednesday, June 18, 2014
USDL-14-1137
Technical information: (202) 691-6339 • [email protected] • www.bls.gov/tus
Media contact:
(202) 691-5902 • [email protected]
A
MERICAN
T
IME
U
SE
S
URVEY
—
2013
R
ESULTS
On an average day in 2013, employed adults living in households with no children under age 18 engaged
in leisure activities for 4.5 hours, about an hour more than employed adults living with a child under age
6, the U.S. Bureau of Labor Statistics reported today. Nearly everyone age 15 and over (95 percent)
engaged in some sort of leisure activity, such as watching TV, socializing, or exercising.
These and other results from the American Time Use Survey (ATUS) were released today. These data
include the average amount of time per day in 2013 that individuals worked, did household activities,
and engaged in leisure and sports activities. Additionally, measures of the average time per day spent
providing childcare—both as a primary (or main) activity and while doing other things—for the
combined years 2009-13 are provided. For a further description of ATUS data and methodology, see
the Technical Note.
Working (by Employed Persons) in 2013
Employed persons worked an average of 7.6 hours on the days they worked. More hours were
worked, on average, on weekdays than on weekend days—7.9 hours compared with 5.5 hours.
(See table 4.)
On the days they worked, employed men worked 53 minutes more than employed women. This
difference partly reflects women's greater likelihood of working part time. However, even among
full-time workers (those usually working 35 hours or more per week), men worked longer than
women—8.3 hours compared with 7.7 hours. (See table 4.)
Many more people worked on weekdays than on weekend days: 83 percent of employed persons
worked on an average weekday, compared with 34 percent on an average weekend day. (See
table 4.)
On the days they worked, 83 percent of employed persons did some or all of their work at their
workplace and 23 percent did some or all of their work at home. They spent more time working
at the workplace than at home—7.9 hours compared with 3.0 hours. (See table 6.)
Multiple jobholders were more likely to work on an average day than were single jobholders—
77 percent compared with 67 percent. (For a definition of average day, see the Technical Note.)
Multiple jobholders also were more likely to work at home than were single jobholders—31
percent compared with 22 percent. (See table 6.)
- 2 -
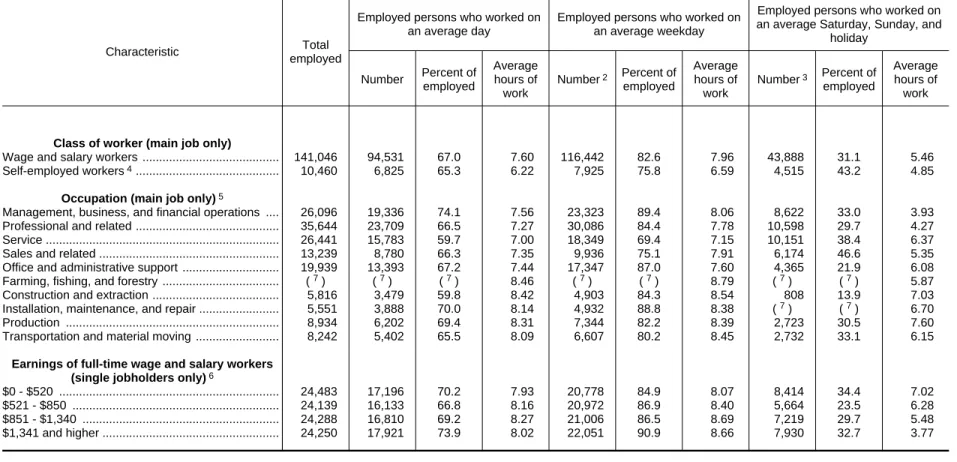
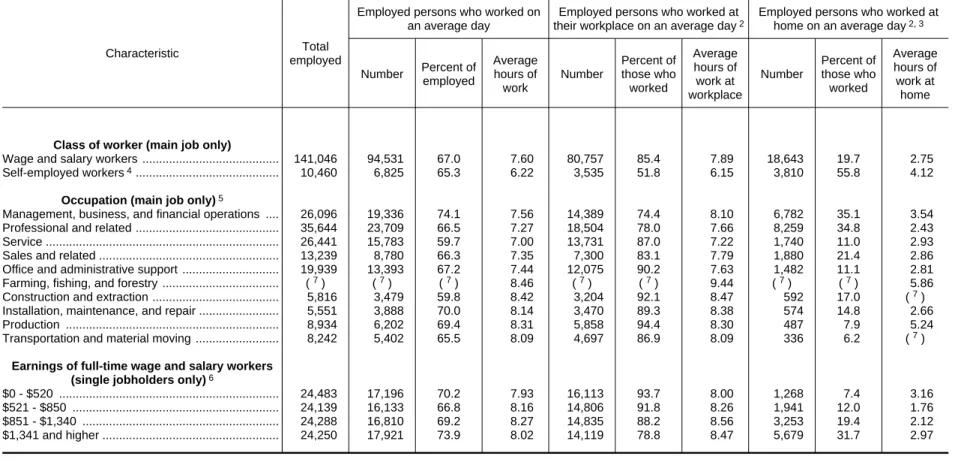
Self-employed workers were nearly three times more likely than wage and salary workers to
have done some work at home on days worked—56 percent compared with 20 percent.
Self-employed workers also were more likely to work on weekend days than were wage and salary
workers—43 percent compared with 31 percent. (See tables 5 and 7.)
On the days they worked, 36 percent of employed people age 25 and over with a bachelor's
degree or higher did some work at home, compared with only 7 percent of those with less than a
high school diploma. (See table 6.)
Household Activities in 2013
On an average day, 83 percent of women and 65 percent of men spent some time doing
household activities such as housework, cooking, lawn care, or financial and other household
management. (See table 1.)
On the days they did household activities, women spent an average of 2.6 hours on such
activities, while men spent 2.1 hours. (See table 1.)
On an average day, 19 percent of men did housework—such as cleaning or doing laundry—
compared with 49 percent of women. Forty-two percent of men did food preparation or cleanup,
compared with 68 percent of women. (See table 1.)
Leisure Activities in 2013
On an average day, nearly everyone age 15 and over (95 percent) engaged in some sort of
leisure activity, such as watching TV, socializing, or exercising. Of those who engaged in
leisure activities, men spent more time in these activities (5.9 hours) than did women (5.2
hours). (See table 1.)
Watching TV was the leisure activity that occupied the most time (2.8 hours per day),
accounting for more than half of leisure time, on average, for those age 15 and over.
Socializing, such as visiting with friends or attending or hosting social events, was the next
most common leisure activity, accounting for 43 minutes per day. (See table 1.)
Men were more likely than women to participate in sports, exercise, or recreation on any given
day—21 percent compared with 16 percent. On the days that they participated, men also spent
more time in these activities than did women—1.9 hours compared with 1.3 hours. (See table 1.)
On an average day, adults age 75 and over spent 7.5 hours engaged in leisure activities—more
than any other age group; 25- to 34-year-olds spent 4.3 hours and 35- to 44-year-olds spent 4.1
hours engaged in leisure and sports activities—less than other age groups. (See table 11.)
Time spent reading for personal interest and playing games or using a computer for leisure
varied greatly by age. Individuals age 75 and over averaged 1.0 hour of reading per weekend day
and 20 minutes playing games or using a computer for leisure. Conversely, individuals ages 15
to 19 read for an average of 4 minutes per weekend day and spent 52 minutes playing games or
using a computer for leisure. (See table 11.)
- 3 -
Employed adults living in households with no children under age 18 engaged in leisure activities
for 4.5 hours per day, about an hour more than employed adults living with a child under age 6.
(See table 8.)
Care of Household Children for the period 2009-13
Adults living in households with children under age 6 spent an average of 2.0 hours per day
providing primary childcare to household children. Adults living in households where the
youngest child was between the ages of 6 and 17 spent less than half as much time providing
primary childcare to household children—47 minutes per day. Primary childcare is childcare
that is done as a main activity, such as physical care of children and reading to or talking with
children. (See table 9.)
On an average day, among adults living in households with children under age 6, women spent
1.0 hour providing physical care (such as bathing or feeding a child) to household children; by
contrast, men spent 26 minutes providing physical care. (See table 9.)
Adults living in households with at least one child under age 6 spent an average of 5.4 hours per
day providing secondary childcare—that is, they had at least one child in their care while doing
activities other than primary childcare. Secondary childcare provided by adults living in
households with children under age 6 was most commonly provided while doing leisure
activities (2.1 hours) or household activities (1.3 hours). (See table 10.)
Adults living in households with children under age 6 spent more time providing primary
childcare on an average weekday (2.1 hours) than on an average weekend day (1.8 hours).
However, they spent less time providing secondary childcare on weekdays than on weekend
days—4.5 hours compared with 7.4 hours. (See tables 9 and 10.)
Additional Data
ATUS 2013 data files are available for users to do their own tabulations and analyses. In accordance
with BLS and Census Bureau policies that protect survey respondents' privacy, identifying information
was removed from the data files. The 2013 data files are available on the BLS website at
- 4 -
Partial Federal Government Shutdown
Some agencies of the federal government—including the Bureau of Labor Statistics—were
shut down or
operating at reduced staffing levels from October 1, 2013, through October 16, 2013.
All American Time Use Survey (ATUS) operations were suspended from October 1 through October
16. No call attempts were made and no interviews were completed during the shutdown. Because ATUS
interviews are conducted every day and collect time diaries about
″
yesterday
″
—that is, the day prior to
the interview day—there are no ATUS data for September 30 through October 15. Data collection
resumed on October 17.
The shutdown primarily affected ATUS data for the fourth quarter of 2013, as nearly all of the missing
time diaries were in this period. ATUS estimates included in this news release have been weighted such
that the time diaries for October 16 through December 30 represent all days in the quarter, including
those missing because of the shutdown. For information on the ATUS weights, please see the Technical
Note.
It is possible that ATUS estimates for 2013 or for the fourth quarter of 2013 could have been affected by
the loss of data due to the shutdown. If people’s time use in early October 2013 differed from their time
use in the remainder of the year, ATUS estimates would fail to account for this difference. For example,
people who were affected by the shutdown may have modified how they spent their time, but the
estimates would not capture this. Any seasonal differences in activities between these periods could also
affect the estimates, although ATUS data historically have exhibited minimal seasonality. It is not
possible to quantify the effect of the shutdown on the ATUS estimates.
Technical Note
The estimates in this release are based on annual
average data from the American Time Use Survey (ATUS).
The ATUS, which is conducted by the U.S. Census Bureau
for the Bureau of Labor Statistics (BLS), is a continuous
survey about how individuals age 15 and over spend their
time.
Information in this release will be made available to
sensory impaired individuals upon request. Voice phone:
(202) 691-5200; Federal Relay Service: (800) 877-8339.
Survey methodology
Data collection for the ATUS began in January 2003.
Sample cases for the survey are selected monthly, and
interviews are conducted continuously throughout the year.
In 2013, approximately 11,400 individuals were interviewed.
Estimates are released annually.
ATUS sample households are chosen from the
households that completed their eighth (final) interview for
the Current Population Survey (CPS), the nation’s monthly
household labor force survey. ATUS sample households are
selected to ensure that estimates will be nationally
representative.
One individual age 15 or over is randomly chosen from
each sampled household. This "designated person" is
interviewed by telephone once about his or her activities on
the day before the interview—the "diary day."
All ATUS interviews are conducted using Computer
Assisted Telephone Interviewing. Procedures are in place to
collect information from the small number of households that
did not provide a telephone number during the CPS
interview.
ATUS designated persons are preassigned a day of the
week about which to report. Preassignment is designed to
reduce variability in response rates across the week and to
allow oversampling of weekend days so that accurate
weekend day measures can be developed. Interviews occur
on the day following the assigned day. For example, a person
assigned to report about a Monday would be contacted on the
following Tuesday. Ten percent of designated persons are
assigned to report about each of the five weekdays.
Twenty-five percent are assigned to report about each weekend day.
Households are called for up to 8 consecutive weeks (for
example, 8 Tuesdays) in order to secure an interview.
About the questionnaire
In the time diary portion of the ATUS interview, survey
respondents sequentially report activities they did between 4
a.m. on the day before the interview ("yesterday") until 4
a.m. on the day of the interview. For each activity,
respondents are asked how long the activity lasted. For
activities other than personal care activities (such as sleeping
and grooming), interviewers also ask respondents where they
were and who was in the room with them (if at home) or who
accompanied them (if away from home). If respondents
report doing more than one activity at a time, they are asked
to identify which one was the "main" (primary) activity. If
none can be identified, then the interviewer records the first
activity mentioned. After completing the time diary,
interviewers ask respondents additional questions to clearly
identify work, volunteering, and secondary childcare
activities. Secondary childcare is defined as having a child
under age 13 in one’s care while doing other activities.
Questions to identify eldercare providers and activities done
as eldercare were added to the survey in 2011.
In addition, the ATUS includes an update of the
household composition from the last CPS interview (2 to 5
months prior to the ATUS interview) and the employment
status of the respondent and his or her spouse or unmarried
partner. For respondents who became employed or changed
jobs between the last CPS interview and the ATUS
interview, information also is collected on industry,
occupation, class of worker, and earnings. For those who are
unemployed or on layoff, CPS questions on job search
activities are asked. Those who report being on layoff are
asked if or when they expect to be recalled to work. Finally,
a question about current school enrollment status is asked of
all respondents ages 15 to 49.
After completing the interview, primary activity
descriptions are assigned a single 6-digit code using the
ATUS Coding Lexicon. The 3-tier coding system consists of
17 major activity categories, each with multiple second- and
third-tier subcategories. These coding lexicon categories are
then combined into composite categories for publication,
such as in this news release. Descriptions of categories
shown in this release can be found in the Major activity
category definitions section of this Technical Note. The
ATUS Coding Lexicon can be accessed at
www.bls.gov/tus/lexicons.htm.
Concepts and definitions
Average day. The average day measure reflects an
average distribution across all persons in the reference
population and all days of the week. Average day measures
for the entire population provide a mechanism for seeing the
overall distribution of time allocation for society as a whole.
The ATUS collects data about daily activities from all
segments of the population age 15 and over, including
persons who are employed and not employed. Activity
profiles differ based upon age, employment status, gender,
and other characteristics. On an average day in 2013, persons
in the United States age 15 and over did work and
work-related activities for 3.5 hours, slept 8.7 hours, spent 5.3
hours doing leisure and sports activities, and spent 1.8 hours
doing household activities. The remaining 4.7 hours were
spent doing a variety of other activities, including eating and
drinking, attending school, and shopping. (See table 1.) By
comparison, an average weekday for persons employed full
time on days that they worked included 9.2 hours doing work
and work-related activities, 7.8 hours sleeping, 2.8 hours
doing leisure and sports activities, and 0.9 hour doing
household activities. The remaining 3.3 hours were spent in
other activities, such as those described above. (These
estimates include related travel time.)
Many activities typically are not done on a daily basis,
and some activities only are done by a subset of the
population. For example, only 42 percent of all persons age
15 years and over worked on an average day in 2013 because
some were not employed and those who were employed did
not work every day. (See table 1.)
Average hours per day. The average number of hours
spent in a 24- hour day (between 4 a.m. on the diary day and
4 a.m. on the interview day) doing a specified activity.
Average hours per day, population. The average
number of hours per day is computed using all
responses from a given population, including those
of respondents who did not do a particular activity
on their diary day. These estimates reflect how
many population members engaged in an activity
and the amount of time they spent doing it.
Average hours per day, persons who did the
activity. The average number of hours per day is
computed using only responses from those who
engaged in a particular activity on their diary day.
Diary day. The diary day is the day about which the
respondent reports. For example, the diary day of a
respondent interviewed on Tuesday is Monday.
Earnings
Usual weekly earnings. Estimates represent the
earnings of full-time wage and salary workers with
one job only (both incorporated and unincorporated
self-employed are excluded), before taxes and other
deductions. They include any overtime pay,
commissions, or tips usually received. Usual
weekly earnings are only updated in ATUS for
about a third of employed respondents—if the
respondent changed jobs or employment status
between the CPS and ATUS interviews or if the
CPS weekly earnings value was imputed. This
means that the earnings information could be out of
date because the CPS interview was done 2 to 5
months prior to the ATUS interview. Respondents
are asked to identify the easiest way for them to
report earnings (hourly, weekly, biweekly, twice
monthly, annually, or other) and how much they
usually earn in the reported time period. Earnings
reported on a basis other than weekly are converted
to a weekly equivalent. The term "usual" is as
perceived by the respondent. If the respondent asks
for a definition of usual, interviewers are instructed
to define the term as more than half the weeks
worked during the past 4 or 5 months.
Weekly earnings ranges. The ranges used represent
approximately 25 percent of full-time wage and
salary
workers
(both
incorporated
and
unincorporated self-employed are excluded) who
held only one job. For example, 25 percent of
full-time wage and salary workers with one job only had
weekly earnings of $520 or less. These dollar values
vary from year to year.
Employment status
Employed. All persons who, at any time during the
7 days prior to the interview:
1) Did any work at all as paid employees; worked
in their own business, profession, or on their own
farm; or usually worked 15 hours or more as unpaid
workers in a family-operated enterprise; or
2) Were not working but had jobs or businesses
from which they were temporarily absent due to
illness, bad weather, vacation, childcare problems,
labor-management disputes, maternity or paternity
leave, job training, or other family or personal
reasons, whether or not they were paid for the time
off or were seeking other jobs.
Employed full time. Full-time workers are those
who usually worked 35 hours or more per week at
all jobs combined.
Employed part time. Part-time workers are those
who usually worked fewer than 35 hours per week
at all jobs combined.
Not employed. Persons are not employed if they do
not meet the conditions for employment. The not
employed include those classified as unemployed as
well as those classified as not in the labor force
(using CPS definitions).
The numbers of employed and not employed persons in
this report do not correspond to published totals from the
CPS for several reasons. First, the reference population for
the ATUS is age 15 years and over, whereas it is age 16 years
and over for the CPS. Second, ATUS data are collected
continuously, the employment reference period being the 7
days prior to the interview. By contrast, CPS data are usually
collected during the week including the 19th of the month
and refer to employment during the week containing the 12th
of the month. Finally, the CPS accepts answers from
household members about other household members
whereas such proxy responses are not allowed in the ATUS.
One consequence of the difference in proxy reporting is that
a significantly higher proportion of teenagers report
employment in the ATUS than in the CPS. While the
information on employment from the ATUS is useful for
assessing work in the context of other daily activities, the
employment data are not intended for analysis of current
employment trends. Compared with the CPS and other
estimates of employment, the ATUS estimates are based on
a much smaller sample and are only available with a
substantial lag since ATUS data and estimates are published
during the year following data collection.
Household children. Household children are children
under age 18 residing in the household of the ATUS
respondent. The children may be related to the respondent
(such as his or her own children, grandchildren, nieces or
nephews, or siblings) or not related (such as foster children
or children of roommates).
Primary activity. A primary activity is the main activity
a respondent was doing at a specified time. With the
exception of secondary childcare in table 10, the estimates
presented in this release reflect time spent in primary
activities only.
Secondary activities. A secondary (or simultaneous)
activity is an activity done at the same time as a primary
activity. With the exception of the care of children under age
13, information on secondary activities is not systematically
collected in the ATUS.
Secondary childcare. Secondary childcare is care for
children under age 13 that is done while doing an activity
other than primary childcare, such as cooking dinner.
Secondary childcare estimates are derived by summing the
durations of activities during which respondents had a
household child or their own nonhousehold child under age
13 in their care while doing activities other than primary
childcare. It is restricted to times the respondent was awake.
Secondary childcare time for household children is further
restricted to the time between when the first household child
under age 13 woke up and the last household child under age
13 went to bed. If respondents report providing both primary
and secondary care at the same time, the time is attributed to
primary care only.
Weekday, weekend, and holiday estimates. Estimates for
weekdays are an average of reports about Monday through
Friday. Estimates for weekend days and holidays are an
average of reports about Saturdays, Sundays, and the
following holidays: New Year’s Day, Easter, Memorial
Day, the Fourth of July, Labor Day, Thanksgiving Day, and
Christmas Day. Data were not collected about New Year’s
Day in 2012, Christmas Day in 2011, and the Fourth of July
in 2010.
Major activity category definitions
The following definitions describe the activity
categories shown in this report. All major time-use
categories in tables 1-12 include related travel time and
waiting time. For example, time spent "driving to the
stadium" and time spent "waiting to get into the stadium to
play ball" are included in Leisure and sports.
Personal care activities. Personal care activities
include sleeping, grooming (such as bathing or dressing),
health-related self-care, and personal or private activities.
Receiving unpaid personal care from others (for example,
"my sister put polish on my nails") also is captured in this
category. In general, respondents are not asked who they
were with or where they were for personal care activities, as
such information can be sensitive.
Eating and drinking. All time spent eating or drinking
(except eating and drinking done as part of a work or
volunteer activity), whether alone, with others, at home, at a
place of purchase, or somewhere else, is classified here.
Household activities. Household activities are those
done by persons to maintain their households. These include
housework; cooking; lawn and garden care; pet care; vehicle
maintenance and repair; home maintenance, repair,
decoration, and renovation; and household management and
organizational activities (such as filling out paperwork or
planning a party). Food preparation, whether or not reported
as done specifically for another household member, is
always classified as a household activity unless it was done
as a volunteer, work, or income-generating activity. For
example, "making breakfast for my son" is coded as a
household activity, not as childcare.
Purchasing goods and services. This category includes
purchases of consumer goods, professional and personal care
services, household services, and government services.
Consumer purchases include most purchases and rentals of
consumer goods, regardless of the mode or place of purchase
or rental (in person, via telephone, over the Internet, at home,
or in a store). Gasoline, grocery, other food purchases, and
all other shopping are further broken out in subcategories.
Time spent obtaining, receiving, and purchasing
professional and personal care services provided by someone
else also is classified in this category. Professional services
include childcare, financial services and banking, legal
services, medical and adult care services, real estate services,
and veterinary services. Personal care services include day
spas, hair salons and barbershops, nail salons, and tanning
salons. Activities classified here include time spent paying,
meeting with, or talking to service providers, as well as time
spent receiving the service or waiting to receive the service.
Time spent arranging for and purchasing household
services provided by someone else also is classified here.
Household services include housecleaning; cooking; lawn
care and landscaping; pet care; tailoring, laundering, and dry
cleaning; vehicle maintenance and repairs; and home repairs,
maintenance, and construction.
This category also captures the time spent obtaining
government services—such as applying for food stamps—
and purchasing government-required licenses or paying fines
or fees.
Caring for and helping household members. Time
spent doing activities to care for or help any child (under age
18) or adult in the household, regardless of relationship to the
respondent or the physical or mental health status of the
person being helped, is classified here. Caring for and
helping activities for household children and adults are coded
separately in subcategories.
Primary childcare activities include time spent
providing physical care; playing with children; reading to
children; assistance with homework; attending children's
events; taking care of children's health needs; and dropping
off, picking up, and waiting for children. Passive childcare
done as a primary activity (such as "keeping an eye on my
son while he swam in the pool") also is included. A child's
presence during the activity is not enough in itself to classify
the activity as childcare. For example, "watching television
with my child" is coded as a leisure activity, not as childcare.
Secondary childcare occurs when persons have a child
under age 13
″
in their care" while doing activities other than
primary childcare. For a complete definition, see the
Concepts and definitions section of this Technical Note.
Caring for and helping household members also
includes a range of activities done to benefit adult members
of households, such as providing physical and medical care
or obtaining medical services. Doing something as a favor
for or helping another household adult does not
automatically result in classification as a helping activity.
For example, a report of "helping my spouse cook dinner" is
considered a household activity (food preparation), not a
helping activity, because cooking dinner benefits the
household as a whole. By contrast, doing paperwork for
another person usually benefits the individual, so a report of
"filling out an insurance application for my spouse" is
considered a helping activity.
Caring for and helping
nonhousehold
members.
Caring
for and helping nonhousehold members includes activities
persons do to care for or help those—either children (under
age 18) or adults—who do not live with them. When done
for or through an organization, time spent helping
nonhousehold members is classified as volunteering, rather
than as helping nonhousehold members. Care of
nonhousehold children, even when done as a favor or helping
activity for another adult, is always classified as caring for
and helping nonhousehold children, not as helping another
adult.
Working and work-related activities.
This category
includes time spent working, doing activities as part of
one's job, engaging in income-generating activities (not as
part of one's job), and job search activities. "Working"
includes hours spent doing the specific tasks required of
one's main or other job, regardless of location or time of
day. "Work-related activities" include activities that are not
obviously work but are done as part of one's job, such as
having a business lunch or playing golf with clients. "Other
income-generating activities" are those done "on the side"
or under informal arrangement and are not part of a regular
job. Such activities might include selling homemade crafts,
babysitting, maintaining a rental property, or having a yard
sale, and are those that persons "are paid for or will be paid
for."
Travel time related to working and work-related
activities includes time spent traveling to and from work, as
well as time spent traveling for work-related,
income-generating, and job search activities.
Educational activities. Educational activities include
taking classes (including Internet and other distance-learning
courses) for a degree as well as for personal interest; doing
research and homework; and taking care of administrative
tasks related to education, such as registering for classes or
obtaining a school ID. For high school students, before- and
after-school extracurricular activities (except sports) also are
classified as educational activities. Educational activities do
not include time spent for classes or training received as part
of a job. Time spent helping others with their
education-related activities is classified in the Caring for and helping
categories.
Organizational, civic, and religious activities. This
category captures time spent volunteering for or through an
organization, performing civic obligations, and participating
in religious and spiritual activities. Civic obligations include
government-required duties, such as serving jury duty or
appearing in court, and activities that assist or influence
government processes, such as voting or attending town hall
meetings. Religious activities include those normally
associated with membership in or identification with specific
religions or denominations, such as attending religious
services; participating in choirs, youth groups, orchestras, or
unpaid teaching (unless identified as volunteer activities);
and engaging in personal religious practices, such as praying.
Leisure and sports. The leisure and sports category
includes sports, exercise, and recreation; socializing and
communicating; and other leisure activities. Sports, exercise,
and recreation activities include participating in—as well as
attending or watching—sports, exercise, and recreational
activities. Recreational activities are leisure activities that are
active in nature, such as yard games like croquet or
horseshoes. Socializing and communicating includes
face-to-face social communication and hosting or attending social
functions. Leisure activities include watching television;
reading; relaxing or thinking; playing computer, board, or
card games; using a computer or the Internet for personal
interest; playing or listening to music; and other activities,
such as attending arts, cultural, and entertainment events.
Telephone calls, mail, and e-mail. This category
captures telephone communication and handling household
or personal mail or e-mail. This category also includes
texting and Internet voice and video calling. Telephone and
Internet purchases are classified in Purchasing goods and
services. Telephone calls, mail, or e-mail identified as related
to work or volunteering are classified as work or
volunteering.
Other activities, not elsewhere classified. This residual
category includes security procedures related to traveling,
traveling not associated with a specific activity category,
ambiguous activities that could not be coded, and missing
activities. Missing activities result when respondents did not
remember what they did for a period of time, or when they
considered an activity too private or personal to report.
Processing and estimation
After ATUS data are collected, they go through an
editing and imputation procedure. Responses to CPS
questions that are re-asked in the ATUS go through the
regular CPS edit and imputation procedures. Some item
nonresponses for questions unique to the ATUS (such as
where an activity took place or how much time was spent
doing secondary childcare) also are imputed. Missing
activities and missing values for who was present during an
activity are never imputed.
ATUS records are weighted quarterly to reduce bias in
the estimates due to differences in sampling and response
rates across subpopulations and days of the week.
Specifically, the data are weighted to ensure the following:
Weekdays represent about 5/7 of the weighted data,
and weekend days represent about 2/7 of the
weighted data for the population as a whole. The
actual proportions depend on the number of
weekdays and weekend days in a given quarter.
The sum of the weights is equal to the number of
person-days in the quarter for the population as a
whole and for selected subpopulations.
Reliability of the estimates
Statistics based on the ATUS are subject to both
sampling and nonsampling error. When a sample, rather than
the entire population, is surveyed, estimates differ from the
true population values they represent. The component of this
difference that occurs because samples differ by chance is
known as sampling error, and its variability is measured by
the standard error of the estimate.
Sample estimates from a given survey design are
unbiased when an average of the estimates from all possible
samples would yield, hypothetically, the true population
value. In this case, the sample estimate and its standard error
can be used to construct approximate confidence intervals,
or ranges of values that include the true population value
with known probabilities. If the process of selecting a sample
from the population were repeated many times, an estimate
made from each sample, and a suitable estimate of its
standard error calculated for each sample, then
approximately 90 percent of the intervals from 1.645
standard errors below the estimate to 1.645 standard errors
above the estimate would include the true population value.
BLS analyses are generally conducted at the 90-percent level
of confidence.
The ATUS data also are affected by nonsampling error,
which is the average difference between population and
sample values for samples generated by a given process.
Nonsampling error can occur for many reasons, including
failure to sample a segment of the population, inability to
obtain information for all persons in the sample, inability or
unwillingness of respondents to provide correct information,
and errors made in the collection or processing of the data.
Errors also could occur if non-response is correlated with
time use.
Publication requirements
Estimates of average hours per day and participation
rates are not published unless there are a minimum number
of respondents representing the given population. Additional
publication criteria are applied that include the number of
respondents who reported doing a specified activity and the
standard error or coefficient of variation for the estimate.
Estimates that are considered "close to zero" or that round to
0.00, are published as approximately zero or "~0." For a
detailed description of the statistical reliability criteria
necessary for publication, please contact ATUS staff at
[email protected].
Table 1. Time spent in primary activities
1and percent of the civilian population engaging in each activity, averages per day
by sex, 2013 annual averages
Activity
Average hours per day, civilian population
Average percent engaged in the activity per day
Average hours per day for persons who engaged in the activity
Total Men Women Total Men Women Total Men Women
Total, all activities 2... 24.00 24.00 24.00 – – – – – –
Personal care activities ... 9.54 9.31 9.76 100.0 99.9 100.0 9.55 9.31 9.76 Sleeping ... 8.74 8.65 8.82 99.9 99.9 99.9 8.75 8.66 8.82 Eating and drinking ... 1.23 1.26 1.20 96.4 96.5 96.2 1.27 1.31 1.24 Household activities ... 1.78 1.34 2.19 74.5 65.1 83.4 2.39 2.06 2.63 Housework ... .57 .25 .87 34.4 19.4 48.5 1.67 1.30 1.80 Food preparation and cleanup ... .57 .33 .80 55.3 41.7 68.1 1.03 .80 1.17 Lawn and garden care ... .18 .25 .12 9.3 11.3 7.4 1.98 2.26 1.60 Household management ... .13 .10 .16 17.2 14.2 20.1 .75 .73 .77 Purchasing goods and services ... .75 .63 .86 42.9 38.7 46.8 1.74 1.62 1.83 Consumer goods purchases ... .37 .29 .45 39.2 35.1 43.1 .94 .81 1.04 Professional and personal care services ... .08 .06 .10 7.4 5.9 8.8 1.11 1.07 1.13 Caring for and helping household members ... .53 .36 .69 25.5 20.5 30.3 2.07 1.75 2.28 Caring for and helping household children ... .41 .27 .54 20.9 16.2 25.3 1.96 1.68 2.13 Caring for and helping nonhousehold members ... .19 .17 .22 11.5 10.0 12.9 1.68 1.69 1.68 Caring for and helping nonhousehold adults ... .06 .07 .06 7.2 7.0 7.4 .87 .94 .81 Working and work-related activities ... 3.46 4.20 2.77 43.2 49.7 37.2 8.01 8.45 7.46 Working ... 3.14 3.80 2.52 41.5 47.8 35.7 7.55 7.95 7.06 Educational activities ... .48 .47 .48 8.0 7.6 8.3 5.98 6.25 5.74 Attending class ... .26 .27 .25 5.0 5.0 5.1 5.10 5.35 4.88 Homework and research ... .18 .17 .19 5.8 5.7 5.9 3.09 2.95 3.22 Organizational, civic, and religious activities ... .32 .29 .36 14.0 11.3 16.5 2.31 2.52 2.17 Religious and spiritual activities ... .14 .12 .17 9.1 7.3 10.8 1.58 1.64 1.55 Volunteering (organizational and civic activities) ... .14 .13 .15 6.1 5.1 7.1 2.31 2.62 2.11 Leisure and sports ... 5.26 5.61 4.94 95.3 95.1 95.4 5.52 5.89 5.17 Socializing and communicating ... .72 .65 .78 36.8 34.0 39.5 1.95 1.92 1.97 Watching television ... 2.77 2.98 2.57 79.4 80.4 78.5 3.49 3.71 3.27 Participating in sports, exercise, and recreation ... .30 .40 .20 18.6 21.0 16.3 1.60 1.90 1.25 Telephone calls, mail, and e-mail ... .15 .10 .19 20.4 15.2 25.3 .72 .64 .77 Other activities, not elsewhere classified ... .31 .27 .35 17.5 15.5 19.5 1.77 1.77 1.78
1 A primary activity refers to an individual’s main activity. Other activities done simultaneously are not included. 2 All major activity categories include related travel time. See Technical Note for activity category definitions. – Not applicable.
Table 2. Time spent in primary activities
1and percent of the civilian population engaging in each
activity, averages per day on weekdays and weekends, 2013 annual averages
Activity
Average hours per day, civilian population
Average percent engaged in the activity
per day
Average hours per day for persons who engaged in the activity
Weekdays
Weekends and holidays
Weekdays
Weekends and holidays
Weekdays
Weekends and holidays
Total, all activities 2... 24.00 24.00 – – – –
Personal care activities ... 9.30 10.11 100.0 100.0 9.30 10.11 Sleeping ... 8.48 9.34 99.9 100.0 8.49 9.34 Eating and drinking ... 1.17 1.37 96.9 95.2 1.20 1.44 Household activities ... 1.65 2.09 74.2 75.3 2.22 2.77 Housework ... .54 .65 33.9 35.5 1.60 1.82 Food preparation and cleanup ... .55 .63 56.0 53.7 .98 1.18 Lawn and garden care ... .15 .25 8.7 10.7 1.77 2.38 Household management ... .12 .15 17.0 17.8 .73 .82 Purchasing goods and services ... .70 .84 42.6 43.7 1.66 1.93 Consumer goods purchases ... .31 .50 38.0 42.2 .83 1.17 Professional and personal care services ... .10 .03 9.0 3.8 1.15 .86 Caring for and helping household members ... .56 .46 27.0 22.2 2.08 2.07 Caring for and helping household children ... .43 .37 22.3 17.5 1.90 2.12 Caring for and helping nonhousehold members ... .18 .22 10.9 12.9 1.68 1.68 Caring for and helping nonhousehold adults ... .05 .08 6.5 8.9 .85 .92 Working and work-related activities ... 4.41 1.27 52.2 22.6 8.46 5.63 Working ... 4.01 1.14 50.6 20.7 7.92 5.48 Educational activities ... .60 .18 9.2 5.2 6.59 3.50 Attending class ... .37 .01 7.1 .3 5.16 2.55 Homework and research ... .19 .16 6.3 4.8 2.99 3.38 Organizational, civic, and religious activities ... .22 .56 11.5 19.9 1.94 2.79 Religious and spiritual activities ... .07 .31 6.4 15.5 1.17 1.98 Volunteering (organizational and civic activities) ... .12 .18 5.8 6.8 2.11 2.71 Leisure and sports ... 4.74 6.46 94.7 96.7 5.01 6.68 Socializing and communicating ... .54 1.12 34.6 41.9 1.57 2.68 Watching television ... 2.57 3.24 79.2 79.8 3.24 4.05 Participating in sports, exercise, and recreation ... .27 .36 19.0 17.5 1.42 2.04 Telephone calls, mail, and e-mail ... .16 .13 21.9 17.1 .71 .75 Other activities, not elsewhere classified ... .31 .32 17.9 16.8 1.73 1.88
1 A primary activity refers to an individual’s main activity. Other activities done simultaneously are not included. 2 All major activity categories include related travel time. See Technical Note for activity category definitions. – Not applicable.
Table 3. Time spent in primary activities
1for the civilian population by age, sex, race, Hispanic or Latino ethnicity, marital status, and
educational attainment, 2013 annual averages
Characteristic
Average hours per day spent in primary activities 2
Personal care activities
Eating and drinking
Household activities
Purchasing goods and services
Caring for and helping household
members
Caring for and helping
non-household
members
Working and
work-related activities
Education-al activities
Organiza-tional, civic, and
religious activities
Leisure and sports
Telephone calls, mail, and e-mail
Other activities,
not elsewhere
classified
Total, 15 years and over ... 9.54 1.23 1.78 0.75 0.53 0.19 3.46 0.48 0.32 5.26 0.15 0.31 15 to 19 years ... 10.49 1.04 .75 .50 .15 .18 1.05 3.41 .28 5.61 .20 .34 20 to 24 years ... 9.91 1.21 .94 .64 .40 .18 3.66 1.06 .21 5.22 .10 .47 25 to 34 years ... 9.39 1.21 1.53 .76 1.04 .14 4.65 .41 .21 4.30 .09 .27 35 to 44 years ... 9.27 1.16 1.85 .76 1.15 .13 4.82 .09 .27 4.12 .10 .26 45 to 54 years ... 9.33 1.16 1.97 .76 .47 .22 4.66 .06 .33 4.65 .13 .27 55 to 64 years ... 9.32 1.26 2.14 .78 .19 .24 3.62 .01 .30 5.70 .17 .29 65 to 74 years ... 9.37 1.41 2.45 .82 .13 .34 1.15 .02 .56 7.13 .24 .37 75 years and over ... 10.13 1.46 2.24 .87 .06 .13 .39 ~0 .60 7.48 .26 .35
Men, 15 years and over ... 9.31 1.26 1.34 .63 .36 .17 4.20 .47 .29 5.61 .10 .27 15 to 19 years ... 10.47 1.00 .75 .44 .12 .11 1.13 3.09 .25 6.19 .14 (3) 20 to 24 years ... 9.48 1.22 .66 .44 .10 .17 4.42 1.13 .20 5.63 .08 (3) 25 to 34 years ... 9.07 1.27 1.08 .64 .54 .13 5.55 (3) .18 4.84 .06 .16 35 to 44 years ... 8.97 1.23 1.33 .66 .88 .17 5.88 .05 .24 4.33 .05 .21 45 to 54 years ... 9.09 1.19 1.45 .64 .38 .19 5.37 .05 .29 4.98 .08 .28 55 to 64 years ... 9.21 1.27 1.69 .65 .14 .14 4.34 ~0 .22 5.89 .13 .30 65 to 74 years ... 9.22 1.48 2.08 .71 .12 .31 1.49 ~0 .60 7.57 .14 .28 75 years and over ... 9.91 1.56 1.56 .82 .07 .12 .79 (3) .54 8.13 .18 .31
Women, 15 years and over ... 9.76 1.20 2.19 .86 .69 .22 2.77 .48 .36 4.94 .19 .35 15 to 19 years ... 10.52 1.08 .75 .56 .19 .25 .96 3.74 .30 5.01 .27 .38 20 to 24 years ... 10.35 1.20 1.23 .83 .69 .19 2.91 .98 .22 4.82 .11 (3) 25 to 34 years ... 9.71 1.16 1.97 .88 1.53 .15 3.76 .34 .23 3.77 .12 .37 35 to 44 years ... 9.57 1.10 2.35 .87 1.41 .09 3.80 .14 .30 3.92 .14 .32 45 to 54 years ... 9.56 1.13 2.47 .88 .54 .25 3.98 .06 .37 4.33 .18 .26 55 to 64 years ... 9.41 1.25 2.55 .90 .23 .33 2.95 ~0 .37 5.52 .20 .28 65 to 74 years ... 9.51 1.35 2.77 .92 .13 .37 .86 ~0 .53 6.75 .33 .45 75 years and over ... 10.29 1.40 2.71 .91 .06 .13 .11 ~0 .64 7.03 .32 .38
White, 15 years and over ... 9.48 1.26 1.85 .76 .53 .20 3.51 .45 .30 5.21 .15 .30 Men ... 9.26 1.30 1.40 .63 .37 .18 4.30 .47 .26 5.47 .10 .25 Women ... 9.69 1.23 2.28 .88 .68 .22 2.75 .43 .34 4.95 .19 .35
Table 3. Time spent in primary activities
1for the civilian population by age, sex, race, Hispanic or Latino ethnicity, marital status, and
educational attainment, 2013 annual averages — Continued
Characteristic
Average hours per day spent in primary activities 2
Personal care activities
Eating and drinking
Household activities
Purchasing goods and services
Caring for and helping household
members
Caring for and helping
non-household
members
Working and
work-related activities
Education-al activities
Organiza-tional, civic, and
religious activities
Leisure and sports
Telephone calls, mail, and e-mail
Other activities,
not elsewhere
classified
Black or African American, 15 years
and over ... 9.93 0.91 1.28 0.67 0.43 0.19 3.08 0.48 0.47 6.00 0.15 0.41 Men ... 9.52 .95 .90 .59 .20 .14 3.32 .47 .51 6.87 .08 (3) Women ... 10.27 .88 1.60 .74 .62 .23 2.89 .50 .43 5.26 .21 .38
Hispanic or Latino ethnicity, 15 years
and over ... 9.94 1.19 1.80 .73 .67 .13 3.48 .69 .30 4.61 .11 .35 Men ... 9.76 1.16 1.13 .62 .45 .10 4.59 .53 .32 4.90 .09 .34 Women ... 10.12 1.22 2.46 .84 .89 .16 2.36 .85 .28 4.32 .13 .36
Marital status and sex:
Married, spouse present ... 9.29 1.31 2.07 .78 .74 .17 3.88 .07 .37 4.89 .13 .29 Men ... 9.08 1.33 1.53 .66 .55 .15 4.81 .07 .34 5.17 .08 .23 Women ... 9.50 1.29 2.63 .90 .95 .19 2.93 .08 .41 4.61 .17 .34 Other marital statuses ... 9.81 1.14 1.46 .71 .30 .22 3.02 .91 .27 5.65 .17 .33 Men ... 9.57 1.18 1.12 .59 .14 .19 3.48 .95 .23 6.12 .12 .32 Women ... 10.02 1.10 1.76 .81 .44 .25 2.62 .87 .31 5.25 .21 .35
Educational attainment, 25 years and over:
Less than a high school diploma ... 9.88 1.11 2.17 .57 .57 .18 2.46 ~0 .35 6.29 .08 .34 High school graduates, no college ... 9.54 1.19 2.15 .77 .44 .23 3.24 .04 .30 5.69 .14 .26 Some college or associate degree ... 9.39 1.19 1.91 .81 .61 .20 3.78 .23 .31 5.10 .15 .31 Bachelor’s degree and higher ... 9.15 1.39 1.79 .84 .69 .17 4.40 .14 .40 4.57 .18 .29
1 A primary activity refers to an individual’s main activity. Other activities done simultaneously are not included. 2 All major activity categories include related travel time. See Technical Note for activity category definitions.
3 Estimate is suppressed because it does not meet the American Time Use Survey publication standards. ~0 Estimate is approximately zero.
Table 4. Employed persons working
1and time spent working on days worked by full- and part-time status and sex, jobholding
status, educational attainment, and day of week, 2013 annual averages
(Numbers in thousands)
Characteristic Total employed
Employed persons who worked on an average day
Employed persons who worked on an average weekday
Employed persons who worked on an average Saturday, Sunday, and
holiday
Number Percent of employed
Average hours of work
Number 2 Percent of employed
Average hours of work
Number 3 Percent of employed
Average hours of work
Full- and part-time status and sex
Total, 15 years and over 4 ... 151,665 103,157 68.0 7.58 125,773 82.9 7.94 51,300 33.8 5.50 Full-time workers ... 116,607 83,784 71.9 8.09 102,863 88.2 8.50 39,920 34.2 5.68 Part-time workers ... 35,059 19,374 55.3 5.34 22,889 65.3 5.43 11,384 32.5 4.90 Men 4... 80,456 57,341 71.3 7.97 69,079 85.9 8.39 30,169 37.5 5.77 Full-time workers ... 68,059 50,212 73.8 8.34 60,608 89.1 8.77 25,889 38.0 5.96 Part-time workers ... 12,397 7,129 57.5 5.42 8,426 68.0 5.60 4,296 34.7 4.66 Women 4... 71,210 45,816 64.3 7.08 56,679 79.6 7.40 21,172 29.7 5.13 Full-time workers ... 48,548 33,572 69.2 7.73 42,248 87.0 8.11 14,104 29.1 5.17 Part-time workers ... 22,662 12,244 54.0 5.29 14,470 63.8 5.34 7,076 31.2 5.06
Jobholding status
Single jobholders ... 138,445 92,930 67.1 7.55 114,192 82.5 7.91 44,155 31.9 5.38 Multiple jobholders ... 13,220 10,227 77.4 7.82 11,582 87.6 8.24 7,135 54.0 6.25
Educational attainment, 25 years and over
Less than a high school diploma ... 9,022 6,195 68.7 7.96 7,486 83.0 8.08 2,962 32.8 7.23 High school graduates, no college ... 35,259 24,087 68.3 7.78 29,519 83.7 8.00 11,478 32.6 6.51 Some college or associate degree ... 32,784 22,468 68.5 7.79 27,560 84.1 8.09 10,696 32.6 5.97 Bachelor’s degree and higher ... 52,980 37,545 70.9 7.44 46,430 87.6 8.03 18,000 34.0 4.11
1 Includes work at main and other job(s), and excludes travel related to work.
2 Number was derived by multiplying the "Total employed" by the percent of employed persons who worked on an average weekday.
3 Number was derived by multiplying the "Total employed" by the percent of employed persons who worked on an average Saturday, Sunday, and holiday. 4 Includes workers whose hours vary.
Table 5. Employed persons working
1on main job and time spent working on days worked by class of worker, occupation, earnings,
and day of week, 2013 annual averages
(Numbers in thousands)
Characteristic Total employed
Employed persons who worked on an average day
Employed persons who worked on an average weekday
Employed persons who worked on an average Saturday, Sunday, and
holiday
Number Percent of employed
Average hours of work
Number 2 Percent of employed
Average hours of work
Number 3 Percent of employed
Average hours of work
Class of worker (main job only)
Wage and salary workers ... 141,046 94,531 67.0 7.60 116,442 82.6 7.96 43,888 31.1 5.46 Self-employed workers 4... 10,460 6,825 65.3 6.22 7,925 75.8 6.59 4,515 43.2 4.85
Occupation (main job only) 5
Management, business, and financial operations .... 26,096 19,336 74.1 7.56 23,323 89.4 8.06 8,622 33.0 3.93 Professional and related ... 35,644 23,709 66.5 7.27 30,086 84.4 7.78 10,598 29.7 4.27 Service ... 26,441 15,783 59.7 7.00 18,349 69.4 7.15 10,151 38.4 6.37 Sales and related ... 13,239 8,780 66.3 7.35 9,936 75.1 7.91 6,174 46.6 5.35 Office and administrative support ... 19,939 13,393 67.2 7.44 17,347 87.0 7.60 4,365 21.9 6.08 Farming, fishing, and forestry ... (7) (7) (7) 8.46 (7) (7) 8.79 (7) (7) 5.87 Construction and extraction ... 5,816 3,479 59.8 8.42 4,903 84.3 8.54 808 13.9 7.03 Installation, maintenance, and repair ... 5,551 3,888 70.0 8.14 4,932 88.8 8.38 (7) (7) 6.70 Production ... 8,934 6,202 69.4 8.31 7,344 82.2 8.39 2,723 30.5 7.60 Transportation and material moving ... 8,242 5,402 65.5 8.09 6,607 80.2 8.45 2,732 33.1 6.15
Earnings of full-time wage and salary workers (single jobholders only) 6
$0 - $520 ... 24,483 17,196 70.2 7.93 20,778 84.9 8.07 8,414 34.4 7.02 $521 - $850 ... 24,139 16,133 66.8 8.16 20,972 86.9 8.40 5,664 23.5 6.28 $851 - $1,340 ... 24,288 16,810 69.2 8.27 21,006 86.5 8.69 7,219 29.7 5.48 $1,341 and higher ... 24,250 17,921 73.9 8.02 22,051 90.9 8.66 7,930 32.7 3.77
1 Includes work at main job only and excludes travel related to work.
2 Number was derived by multiplying the "Total employed" by the percent of employed persons who worked on an average weekday.
3 Number was derived by multiplying the "Total employed" by the percent of employed persons who worked on an average Saturday, Sunday, and holiday.
4 Includes self-employed workers whose businesses are unincorporated. Self-employed workers whose businesses are incorporated are classified as wage and salary workers.
5 These values were generated using the 2010 Census occupational classification system which was introduced with the 2011 estimates. Estimates are not strictly comparable to those from earlier years.
6 These values are based on usual weekly earnings. The earnings data are limited to wage and salary workers (both incorporated and unincorporated self-employed workers are excluded). Each earnings range represents approximately 25 percent of full-time wage and salary workers who held only one job.
7 Estimate is suppressed because it does not meet the American Time Use Survey publication standards. NOTE: Data refer to persons 15 years and over.
Table 6. Employed persons working
1at home and at their workplace and time spent working at each location by full- and part-time
status and sex, jobholding status, and educational attainment, 2013 annual averages
(Numbers in thousands)
Characteristic Total employed
Employed persons who worked on an average day
Employed persons who worked at their workplace on an average day 2
Employed persons who worked at home on an average day 2, 3
Number Percent of employed
Average hours of work
Number
Percent of those who worked
Average hours of work at workplace
Number
Percent of those who worked
Average hours of work at home
Full- and part-time status and sex
Total, 15 years and over 4 ... 151,665 103,157 68.0 7.58 85,643 83.0 7.85 23,630 22.9 2.99 Full-time workers ... 116,607 83,784 71.9 8.09 71,235 85.0 8.28 18,164 21.7 3.15 Part-time workers ... 35,059 19,374 55.3 5.34 14,409 74.4 5.76 5,466 28.2 2.44 Men 4... 80,456 57,341 71.3 7.97 48,060 83.8 8.19 13,179 23.0 3.16 Full-time workers ... 68,059 50,212 73.8 8.34 42,674 85.0 8.49 11,040 22.0 3.27 Part-time workers ... 12,397 7,129 57.5 5.42 5,386 75.5 5.77 2,139 30.0 2.57 Women 4... 71,210 45,816 64.3 7.08 37,584 82.0 7.42 10,451 22.8 2.78 Full-time workers ... 48,548 33,572 69.2 7.73 28,561 85.1 7.95 7,124 21.2 2.98 Part-time workers ... 22,662 12,244 54.0 5.29 9,023 73.7 5.75 3,326 27.2 2.35
Jobholding status
Single jobholders ... 138,445 92,930 67.1 7.55 77,593 83.5 7.84 20,434 22.0 2.96 Multiple jobholders ... 13,220 10,227 77.4 7.82 8,050 78.7 7.94 3,196 31.2 3.18
Educational attainment, 25 years and over
Less than a high school diploma ... 9,022 6,195 68.7 7.96 5,787 93.4 7.97 437 7.1 3.35 High school graduates, no college ... 35,259 24,087 68.3 7.78 20,518 85.2 8.00 4,103 17.0 3.98 Some college or associate degree ... 32,784 22,468 68.5 7.79 18,874 84.0 8.06 4,241 18.9 3.10 Bachelor’s degree and higher ... 52,980 37,545 70.9 7.44 28,529 76.0 7.90 13,605 36.2 2.77
1 Includes work at main and other job(s) and at locations other than home or workplace. Excludes travel related to work. 2 Individuals may have worked at more than one location.
3 "Working at home" includes any time persons did work at home and is not restricted to persons whose usual workplace is their home. 4 Includes workers whose hours vary.
Table 7. Employed persons working on main job
1at home and at their workplace and time spent working at each location by class
of worker, occupation, and earnings, 2013 annual averages
(Numbers in thousands)
Characteristic Total employed
Employed persons who worked on an average day
Employed persons who worked at their workplace on an average day 2
Employed persons who worked at home on an average day 2, 3
Number Percent of employed
Average hours of work
Number
Percent of those who worked
Average hours of work at workplace
Number
Percent of those who worked
Average hours of work at home
Class of worker (main job only)
Wage and salary workers ... 141,046 94,531 67.0 7.60 80,757 85.4 7.89 18,643 19.7 2.75 Self-employed workers 4... 10,460 6,825 65.3 6.22 3,535 51.8 6.15 3,810 55.8 4.12
Occupation (main job only) 5
Management, business, and financial operations .... 26,096 19,336 74.1 7.56 14,389 74.4 8.10 6,782 35.1 3.54 Professional and related ... 35,644 23,709 66.5 7.27 18,504 78.0 7.66 8,259 34.8 2.43 Service ... 26,441 15,783 59.7 7.00 13,731 87.0 7.22 1,740 11.0 2.93 Sales and related ... 13,239 8,780 66.3 7.35 7,300 83.1 7.79 1,880 21.4 2.86 Office and administrative support ... 19,939 13,393 67.2 7.44 12,075 90.2 7.63 1,482 11.1 2.81 Farming, fishing, and forestry ... (7) (7) (7) 8.46 (7) (7) 9.44 (7) (7) 5.86 Construction and extraction ... 5,816 3,479 59.8 8.42 3,204 92.1 8.47 592 17.0 (7) Installation, maintenance, and repair ... 5,551 3,888 70.0 8.14 3,470 89.3 8.38 574 14.8 2.66 Production ... 8,934 6,202 69.4 8.31 5,858 94.4 8.30 487 7.9 5.24 Transportation and material moving ... 8,242 5,402 65.5 8.09 4,697 86.9 8.09 336 6.2 (7)
Earnings of full-time wage and salary workers (single jobholders only) 6
$0 - $520 ... 24,483 17,196 70.2 7.93 16,113 93.7 8.00 1,268 7.4 3.16 $521 - $850 ... 24,139 16,133 66.8 8.16 14,806 91.8 8.26 1,941 12.0 1.76 $851 - $1,340 ... 24,288 16,810 69.2 8.27 14,835 88.2 8.56 3,253 19.4 2.12 $1,341 and higher ... 24,250 17,921 73.9 8.02 14,119 78.8 8.47 5,679 31.7 2.97
1 Includes work at main job only and at locations other than home or workplace. Excludes travel related to work. 2 Individuals may have worked at more than one location.
3 "Working at home" includes any time persons did work at home and is not restricted to persons whose usual workplace is their home.
4 Includes self-employed workers whose businesses are unincorporated. Self-employed workers whose businesses are incorporated are classified as wage and salary workers.
5 These values were generated using the 2010 Census occupational classification system which was introduced with the 2011 estimates. Estimates are not strictly comparable to those from earlier years.
6 These values are based on usual weekly earnings. The earnings data are limited to wage and salary workers (both incorporated and unincorporated self-employed workers are excluded). Each earnings range represents approximately 25 percent of full-time wage and salary workers who held only one job.
7 Estimate is suppressed because it does not meet the American Time Use Survey publication standards. NOTE: Data refer to persons 15 years and over.
Table 8. Time spent in primary activities
1for the civilian population 18 years and over by employment status, presence and age of
youngest household child, and sex, 2013 annual averages
TotalActivity
Average hours per day spent in primary activities
Household child under 18
Total Youngest household child under 6
Youngest household child 6 to 17
No household children under 18
Total Men Women Total Men Women Total Men Women Total Men Women
Total, all activities 2... 24.00 24.00 24.00 24.00 24.00 24.00 24.00 24.00 24.00 24.00 24.00 24.00
Personal care activities ... 9.36 9.04 9.64 9.31 8.81 9.73 9.40 9.22 9.56 9.57 9.34 9.79 Sleeping ... 8.60 8.40 8.78 8.60 8.19 8.93 8.61 8.56 8.65 8.75 8.69 8.81 Eating and drinking ... 1.16 1.21 1.12 1.15 1.18 1.13 1.17 1.23 1.11 1.28 1.30 1.25 Household activities ... 1.85 1.26 2.36 1.81 1.19 2.32 1.88 1.31 2.39 1.84 1.45 2.23 Housework ... .68 .27 1.04 .68 .25 1.03 .68 .28 1.04 .55 .25 .84 Food preparation and cleanup ... .70 .39 .97 .74 .43 1.00 .67 .36 .95 .54 .32 .75 Lawn and garden care ... .12 .18 .07 .10 .15 .05 .13 .19 .08 .23 .31 .16 Household management ... .10 .08 .11 .10 .07 .12 .10 .09 .11 .15 .12 .19 Purchasing goods and services ... .73 .62 .83 .71 .63 .78 .75 .61 .88 .78 .65 .90 Consumer goods purchases ... .37 .28 .46 .38 .31 .45 .37 .25 .47 .38 .29 .46 Professional and personal care services ... .06 .06 .07 .06 .06 .05 .07 .05 .09 .09 .07 .12 Caring for and helping household members ... 1.42 .99 1.79 2.06 1.45 2.57 .91 .64 1.15 .07 .05 .09 Caring for and helping household children ... 1.19 .82 1.50 1.84 1.29 2.28 .68 .46 .87 – – – Caring for and helping nonhousehold members ... .12 .11 .13 .07 .09 .06 .16 .13 .18 .24 .20 .27 Caring for and helping nonhousehold adults ... .05 .05 .04 .02 .03 .02 .06 .06 .06 .08 .08 .07 Working and work-related activities ... 4.20 5.48 3.11 4.19 5.97 2.71 4.22 5.11 3.43 3.32 3.86 2.78 Working ... 3.82 4.99 2.81 3.82 5.46 2.47 3.82 4.64 3.09 3.00 3.48 2.53 Educational activities ... .25 .20 .29 .15 .05 .24 .33 .32 .34 .25 .30 .19 Attending class ... .11 .10 .12 .07 ~0 .12 .14 .17 .11 .08 .12 .05 Homework and research ... .12 .08 .15 .07 .04 .09 .16 .11 .20 .14 .16 .13 Organizational, civic, and religious activities ... .31 .28 .33 .27 .31 .23 .34 .27 .41 .33 .29 .37 Religious and spiritual activities ... .13 .13 .13 .14 .16 .11 .13 .11 .15 .15 .12 .19 Volunteering (organizational and civic activities) ... .13 .11 .15 .10 .11 .09 .16 .12 .20 .14 .14 .15 Leisure and sports ... 4.17 4.49 3.91 3.87 4.04 3.74 4.41 4.83 4.04 5.85 6.16 5.56 Socializing and communicating ... .71 .68 .73 .70 .65 .75 .72 .71 .72 .72 .63 .80 Watching television ... 2.17 2.35 2.01 2.06 2.16 1.97 2.25 2.50 2.03 3.17 3.39 2.97 Participating in sports, exercise, and recreation ... .25 .32 .19 .23 .30 .18 .26 .33 .19 .29 .39 .19 Telephone calls, mail, and e-mail ... .11 .07 .14 .08 .07 .09 .13 .08 .17 .17 .11 .23 Other activities, not elsewhere classified ... .31 .24 .36 .31 .21 .39 .30 .26 .34 .31 .28 .34