SUB-BARRIER PHOTOFISSION MEASUREMENTS IN 238U AND 232Th
Jack Andrew Silano
A dissertation submitted to the faculty of the University of North Carolina at Chapel Hill in partial fulfillment of the requirements for the degree of Doctor of Philosophy in the
Department of Physics and Astronomy.
Chapel Hill 2016
Approved by:
Hugon J. Karwowski Nalin R. Parikh Joaquin E. Drut Reyco Henning
ABSTRACT
JACK ANDREW SILANO: SUB-BARRIER PHOTOFISSION
MEASUREMENTS IN 238U AND 232Th.
(Under the direction of Hugon J. Karwowski.)
ACKNOWLEDGMENTS
Though this thesis is my own work, I could not have completed it without the help and support of my friends, family and colleagues. My experiences with them have shaped every part of my dissertation, and it wouldn’t have been the same without them. First and foremost, I would like to thank Hugon Karwowski for his guidance and support throughout my graduate career. I owe nearly everything I have learned through my research experience to his mentorship, and for that I will always be grateful.
In my time at the University of North Carolina at Chapel Hill, I have had the opportunity to take classes and engage with many faculty members of the Physics & Astronomy Depart-ment. I would especially like to thank Tom Clegg and Reyco Henning for their thoughtful and thorough comments on my dissertation.
A special thanks to Nalin Parikh and Adriana Banu for assisting during the experiment. This work would not have been possible without their help. Thank you to Jonathan Mueller, Kevin Wierman, Mohammad Ahmed, Brent Fallin, Krishichayan, and Erin Hansen for their helpful discussions. Thanks to Grayson Rich for laying the groundwork for this project and getting the HIγS beam time approval.
I would like to thank Stepan Mikhailov and the HIγS staff for providing theγ-ray beams that made this work possible, and for their willingness to put up with my endless questions about the facility. Thank you to Bret Carlin and the TUNL staff for sharing their expertise, and for their patience with my many questions and requests over the years. Finally I would like to thank my family and friends for all of the love and friendship they have shown me throughout my life.
TABLE OF CONTENTS
LIST OF FIGURES . . . xiii
LIST OF TABLES . . . xiv
LIST OF ABBREVIATIONS AND SYMBOLS . . . xv
1 INTRODUCTION . . . 1
1.1 Nuclear Fission . . . 1
1.2 Overview of Contents . . . 3
2 FISSION THEORY . . . 5
2.1 General Aspects of Fission . . . 5
2.2 Liquid Drop Model . . . 6
2.3 Strutinsky Hybrid Model . . . 8
2.4 Modern Fission Models . . . 11
3 PHOTOFISSION THEORY . . . 15
3.1 Photoabsorption . . . 15
3.2 Fission Barrier Interpretation . . . 16
3.3 Fission Fragment Angular Distributions . . . 21
3.4 Fission Neutrons . . . 25
4 PREVIOUS PHOTOFISSION MEASUREMENTS . . . 31
4.1 Introduction . . . 31
4.2 Photofission Cross Sections . . . 32
4.2.2 Photofission of 238U . . . 35
4.3 Photofission Neutron Polarization Asymmetries . . . 40
4.4 Photofission Neutron Multiplicities . . . 43
5 THE EXPERIMENT . . . 45
5.1 Introduction . . . 45
5.2 Experiment . . . 45
5.3 HIγS γ-ray Beams . . . 46
5.4 γ-ray Beam Diagnostics . . . 48
5.5 Neutron Detector . . . 53
5.6 Data Acquisition . . . 54
5.7 Targets . . . 56
6 DATA REDUCTION & ANALYSIS I . . . 59
6.1 Introduction . . . 59
6.2 HPGe Detector . . . 59
6.3 Digital Waveforms from the INVS . . . 60
6.3.1 Pulse Shape Discrimination . . . 62
6.4 GEANT4 Model of the INVS . . . 65
6.4.1 Introduction . . . 65
6.4.2 GEANT4 . . . 65
6.4.3 Detector Efficiency Calibration . . . 67
6.4.4 Neutron Asymmetry Calibration . . . 76
6.4.5 Model Validation . . . 77
6.5 γ-ray Beam Flux Monitor Calibration . . . 80
7 MODELING PHOTOFISSION NEUTRONS . . . 84
7.1 Introduction . . . 84
7.2.1 Pre-fission Neutrons . . . 85
7.2.2 Fragment Masses and Charges . . . 85
7.2.3 Fragment Kinetic Energies and Excitations . . . 87
7.2.4 Neutron Emission . . . 90
7.3 Photofission Neutron Spectra . . . 91
7.4 Neutron Angular Correlations . . . 93
8 DATA REDUCTION & ANALYSIS II . . . 98
8.1 Introduction . . . 98
8.2 Moderated Neutron Time Distribution . . . 98
8.3 Background Analysis . . . 101
8.3.1 Cosmic-ray Induced Neutrons . . . 102
8.3.2 Neutrons Produced by the D(γ,n) Reaction . . . 102
8.3.3 Bremsstrahlung Contamination of the HIγS Beam . . . 104
8.3.4 Measuring the Compton and Bremsstrahlung Backgrounds . . . 107
8.3.5 238U(γ,n) Reaction Background Neutrons . . . 113
8.4 Prompt Photofission Neutron Asymmetry Analysis . . . 115
8.4.1 Neutron Asymmetries in the INVS Detector . . . 115
8.4.2 Simulated Asymmetries in the INVS Detector . . . 116
8.5 Photofission Neutron Multiplicity Analysis . . . 118
8.5.1 Rossi-alpha Method . . . 120
8.5.2 Monte Carlo Fitting of Photofission Neutron Multiplicities . . . 123
8.6 Photofission Cross Section Analysis . . . 127
9 RESULTS & DISCUSSION . . . 130
9.1 Introduction . . . 130
9.2 Prompt Photofission Neutron Polarization Asymmetries . . . 130
9.4 Photofission Cross Sections . . . 137
9.4.1 Photofission of 232Th . . . 137
9.4.2 Photofission of 238U . . . 141
9.5 Concluding Remarks . . . 146
Appendix A DEUTERIUM PHOTODISINTEGRATION KINEMATICS . 149 Appendix B TABULATED RESULTS . . . 151
B.1 Prompt Photofission Neutron Polarization Asymmetry Data . . . 151
B.2 Prompt Photofission Neutron Multiplicity Data . . . 153
B.3 Photofission and Photoneutron Cross Section Data . . . 154
LIST OF FIGURES
2.1 238U(n,f) reaction fragment mass distribution . . . . 6
2.2 Liquid drop model fission barrier . . . 8
2.3 Strutinsky hybrid model . . . 11
2.4 Macroscopic-microscopic calculation of the 232Th fission barrier . . . . 12
2.5 Self-consistent calculation of the 232Th fission barrier . . . 13
2.6 Effects of neutron number on the fission barrier . . . 14
3.1 Energy level diagram for an even-even nucleus . . . 17
3.2 Isomeric and transition excitations within the fission barrier . . . 18
3.3 Barrier penetration probability . . . 19
3.4 Photofission resonance schematic . . . 20
3.5 Bohr formalism . . . 21
3.6 238U(γ,f) reaction neutron Watt spectrum . . . . 27
3.7 Fission neutron boosted by fragment . . . 28
3.8 Fission neutron multiplicity distribution . . . 29
3.9 Fission neutron multiplicity vs. fragment mass . . . 30
4.1 232Th(γ,f) reaction cross section over the GDR . . . 32
4.2 232Th(γ,f) reaction cross section and fission barrier fit . . . . 34
4.3 Inferred fission barrier structure for 232Th . . . 35
4.4 238U(γ,f) reaction cross section over the GDR . . . . 36
4.5 238U(γ,f) reaction cross section and fission barrier fits . . . . 38
4.6 Inferred fission barrier structure for 238U . . . 39
4.7 Neutron detector arrangement for previous work . . . 40
4.8 232Th and 238U photofission neutron polarization asymmetries . . . . 41
4.9 Photofission neutron multiplicities for 232Th and 238U . . . . 43
5.1 Experimental geometry . . . 46
5.2 Schematic of the HIγS facility. . . 46
5.3 Paddle flux monitor . . . 48
5.4 Image of HPGe detector . . . 49
5.5 HPGe spectrum of the γ-ray beam . . . 50
5.6 HIγS beam imager . . . 51
5.7 Collimator alignment . . . 52
5.8 γ-ray beam alignment . . . 52
5.9 INVS detector . . . 53
5.10 Preamplifier array . . . 55
5.11 DAQ logic . . . 56
5.12 232Th and 238U targets. . . . 57
6.1 HPGe calibration . . . 60
6.2 Fit to γ-ray beam spectrum . . . 61
6.3 Digitized preamplifier waveforms . . . 62
6.4 PSD plot . . . 63
6.5 PSD comparison for γ and neutron detection events . . . 65
6.6 geant4 simulated neutron detection event . . . 67
6.7 Detector geometry for calibration of INVS detector . . . 68
6.8 γ-ray beam interaction weighting function . . . 69
6.9 Comparison of D(γ,n) reaction efficiency measurements and simulations . . . 70
6.10 Scaled simulation efficiency . . . 71
6.11 Residual plot of the D(γ,n) reaction efficiency measurements and simulations . . 71
6.12 εIN V S vs. 3He gas pressure . . . 72
6.13 Simulated 3He PC pulse height spectrum . . . . 73
6.14 Measured 3He PC pulse height spectrum . . . . 73
6.16 εIN V S vs. axial source position . . . 76
6.17 Calibrated εIN V S simulation results . . . 77
6.18 Relative PC tube efficiencies . . . 78
6.19 Simulated response of INVS detector to a 5mm source offset . . . 78
6.20 INVS response to neutron asymmetries as a function of moderator density . . . 80
6.21 INVS response to D(γ,n) reaction neutrons from linearly-polarized γ-rays . . . . 81
6.22 Simulated scintillating paddle spectra . . . 82
6.23 Paddle efficiency as a function of threshold setting . . . 83
6.24 Calibrated paddle efficiency simulation . . . 83
7.1 Fission fragment mass distributions . . . 86
7.2 Simulated ν compared with data . . . 90
7.3 Simulated 238U(γ,f) reaction neutron spectrum . . . . 93
7.4 Simulated 232U(γ,f) reaction neutron spectrum . . . . 94
7.5 Simulated 238U(γ,f) reaction correlations between neutron energy and angle . . . 95
7.6 FREYA photofission neutron angular distributions . . . 96
7.7 Simulated 238U(γ,f) reaction neutron angular distribution . . . . 97
7.8 Photofission neutron asymmetries for several neutron energy thresholds . . . 97
8.1 Simulated neutron detection times . . . 98
8.2 Multiplicity gating logic diagram . . . 100
8.3 Monte Carlo and experimentally observed neutron detection times . . . 101
8.4 Compton scattering-induced background diagram . . . 103
8.5 Bremsstrahlung production diagram . . . 104
8.6 Simulated bremsstrahlung spectrum . . . 105
8.7 The 238U(γ,xn) reaction cross section . . . 106
8.8 Multiplicity logic schematic . . . 107
8.9 Multiplicity distributions for various backgrounds . . . 109
8.11 Bremsstrahlung-induced neutron multiplicities for 232Th and 238U . . . 111
8.12 Measured HIγS beam-induced backgrounds . . . 112
8.13 Ratio of bremsstrahlung-induced background and single bunch estimate . . . 113
8.14 Measured INVS ring ratios . . . 114
8.15 Cosmic-ray induced neutron rates . . . 115
8.16 238U(γ,f) reaction neutron asymmetry fit . . . 117
8.17 Simulated neutron detection asymmetry vs. fission fragment asymmetry . . . . 118
8.18 Detected D(γ,n) reaction neutron multiplicity distribution . . . 119
8.19 Rossi-alpha distribution . . . 120
8.20 Detected neutron time distribution . . . 121
8.21 Effective digitizer deadtime . . . 122
8.22 Rossi-alpha multiplicity gating logic . . . 123
8.23 Measured Rossi-alpha multiplicity distribution for the D(γ,n) reaction . . . 124
8.24 Measured Rossi-alpha multiplicity distributions for 238U and 232Th . . . 125
8.25 Monte Carlo multiplicity simulation logic . . . 126
8.26 χ2 fit for 238U(γ,f) reaction neutron multiplicities . . . 128
9.1 bd photofission neutron asymmetries . . . 131
9.2 An photofission neutron asymmetries . . . 132
9.3 Σn(90◦) polarization asymmetries . . . 133
9.4 Comparison of Σn(90◦) with previous data . . . 134
9.5 ν results compared with previous data . . . 135
9.6 σ results compared with previous data . . . 136
9.7 232Th(γ,xn) reaction cross section . . . 138
9.8 232Th(γ,f) cross section . . . 139
9.9 232Th(γ,f) reaction cross section, linear scale . . . 140
9.10 232Th fission barrier results . . . 140
9.12 238U(γ,f) reaction cross section compared with previous measurements . . . 142
9.13 238U(γ,f) reaction cross section, linear scale . . . 143
9.14 Effect of background on 238U(γ,f) reaction cross section measurements . . . 144
LIST OF TABLES
3.1 Fission fragment angular distributions in the Bohr formalism . . . 24
4.1 Previous measurements of the 232Th(γ,f) reaction cross section . . . . 33
4.2 Previous measurements of the 238U(γ,f) reaction cross section . . . 37
5.1 238U target disks . . . . 57
6.1 HPGe calibration γ-ray sources . . . 59
8.1 Measured Rossi-alpha multiplicities for 238U(γ,f) . . . 123
B.1 Tabulated 232Th(γ,f) reaction polarization asymmetries . . . 151
B.2 Tabulated 238U(γ,f) reaction polarization asymmetries . . . 152
B.3 Tabulated 232Th photofission prompt neutron multiplicity data . . . 153
B.4 Tabulated 238U photofission prompt neutron multiplicity data . . . 153
B.5 Tabulated 232Th photofission cross section data . . . 154
LIST OF ABBREVIATIONS
CEBAF Continuous Electron Beam Accelerator Facility CFD Constant fraction discriminator
CODA CEBAF Online Data Acquisition system DAQ Data acquisition system
FEL Free electron laser
FREYA Fission Reaction Event Yield Algorithm GDR Giant dipole resonance
HIγS High Intensity γ-ray Source
HPGe High Purity Germanium
MCA Multichannel analyzer
MS Megasamples
PC Proportional counter
PMT Photomultiplier tube
PSD Pulse shape discrimination SNM Special nuclear material TFA Timing filter amplifier
TKE Total kinetic energy
TXE Total excitation energy
TUNL Triangle Universities Nuclear Laboratory
CHAPTER 1: INTRODUCTION
1.1 Nuclear Fission
Since its discovery in 1939[1][2] nuclear fission has been a profoundly consequential re-action. The first application of fission was to create a devastating weapon which ended one war, nearly began others, and permanently changed the ramifications of warfare. Fission was next harnessed with powerful reactors to generate electricity which now provide 11% of the world’s electricity[3]. Given the importance of fission it is reasonable to assume that the process is well understood.
While there has certainly been much progress in understanding the fission process over the past 77 years, a complete model of the fission mechanism has yet to be established. Fission is a “cataclysmic rearrangement of a single nucleus into two nuclei”[4]; a process which is affected by collective and single particle degrees of freedom. Currently there is no model which can quantitatively predict all observable features of the fission process. The lifetimes with respect to spontaneous fission are not well predicted by any theory[5][6].
Calculations of r-process nucleosynthesis would also benefit from improved nuclear mod-eling, particularly because calculations of the lifetimes of neutron-rich nuclei far from β -stability are similar to the calculations of the lifetimes of spontaneously fissioning nuclei[10]. An improved understanding of fission would also impact the detection and identification of special nuclear materials (SNM) through active and passive interrogation techniques[11], as these methods rely on detectingγ-rays and neutrons emitted by fissioning nuclei. This appli-cation is further motivated by the recent demonstration of a novel laser-wakefield accelerator-basedγ-ray source[12], which raises the prospect of a portable, linearly-polarizedγ-ray source for active interrogation.
The physical observables of fission such as the fission cross section, prompt neutron multiplicity and fragment angular distribution are determined by the structure of the fission barrier, the potential energy surface that an excited nucleus must overcome to split apart. In order for any calculation to be able to predict the fission observables accurately, it must be able to reproduce the fission barrier. Since the barrier can not be directly measured it must instead be inferred through measurements of fission observables.
It is the aim of the present work to provide data which may help to better constrain the shape of the fission barrier through measurements of the photofission process with232Th and 238U targets. Photofission was investigated with linearly polarized γ-ray beams with energies between 4.3 and 6.3 MeV, and prompt fission neutrons were detected to measure the photofission cross sections, photofission neutron polarization asymmetries and prompt fission neutron multiplicities. The fission barriers of 232Th and 238U are inferred from the results of the photofission measurements, with the present work consistent with a triple-humped fission barrier for 232Th and a double-humped fission barrier for 238U. The results suggest that previous experimental evidence[13] of a third minimum in the238U fission barrier is an unaccounted-for accelerator-induced background, which is measured for the first time in the present work.
In the course of this work novel techniques for data acquisition and fission process sim-ulations have been established and tested. The experiments described in this work are part of the photofission program at HIγS. Other work in this program includes measurements of photofission neutron polarization asymmetries[14], polarized photofission fragment angular distributions[15] and photofission fragment yields[16].
1.2 Overview of Contents
CHAPTER 2: FISSION THEORY
2.1 General Aspects of Fission
Fission is a process in which the nucleus of an atom splits into two smaller nuclei, or fission fragments. The reaction can occur spontaneously in some heavier nuclei like 252Cf, or can occur as the result of a nuclear excitation such as capture of a neutron forming an excited state. For the purposes of this work only fission induced by photoabsorption will be considered. During fission the excited nucleus becomes deformed to the point that it ultimately splits into two fragments in an event known as scission[17]. It is also possible for the nucleus to split into three or more fragments but those reactions are rare compared to binary fission, typically constituting less than 0.2% of all fission events[18], and will be neglected for the rest of this work. At low excitation energy the mass of the parent nucleus is typically divided between two fission fragments in a highly asymmetric manner, with one light fragment and one heavy fragment as shown in Fig. 2.1.
The scission of the nucleus is accompanied by the release of a large amount of energy, typically ∼ 200 MeV, primarily due to the release of the Coulomb energy of the positively charged nuclear fragments. For binary fission with no pre-scission neutrons emitted, the released energy is split between the kinetic energy of the fragments and their excitation energies, resulting in highly excited fragments traveling in opposite directions from one another. Because the ratio of neutrons to protons in a nucleus which is stable decreases with decreasing nuclear mass, the fragments will be relatively neutron rich. Consequently the most favorable method of fragment de-excitation is the emission of neutrons, followed by the emission of γ-rays and then β-decay.
Figure 2.1: Fission fragment mass distribution for the 238U(n,f) reaction[19].
degrees of success. This chapter will describe several historical models of fission which are useful for conceptually understanding the process, followed by a discussion of the more complex, modern macroscopic-microscopic approaches.
2.2 Liquid Drop Model
The liquid drop model developed by Bohr and Wheeler[20] represents the most funda-mental explanation of the fission process, providing a useful qualitative understanding of the relevant nuclear forces. The nucleus is treated as a uniformly charged liquid drop with a total energy E of
E =Ev+Es+EC +Esy+Ep, (2.2.1)
deformation of the drop. The deformation can be given by the multipole expansion
R(θ) = Ro
λ "
1 +X n=1
αnPn(cosθ)
#
, (2.2.2)
whereRois the radius of the undeformed drop,αnis a coefficient which gives the contribution caused by deformation of order n, Pn is a Legendre polynomial, and λ is a scaling factor necessary to keep the volume of the drop constant with deformation. A nuclear deformation energy may then be defined as
Edef =E(R)−E(Ro), (2.2.3)
where E(R) is the energy of the deformed nucleus and E(Ro) is the energy of the ground state undeformed nucleus. From calculations[21] of Edef there is no stable configuration of the ground state nucleus with contributions from terms of oddn, which correspond to asym-metric distributions[4]. The liquid drop model then cannot explain the observed asymasym-metric mass distribution.
Despite its shortcomings the liquid drop model still may provide insight into the origin of the fission barrier. By plottingEdef as a function of quadrupole deformationβ as in Fig. 2.2, one can create a potential energy surface which qualitatively captures some of the aspects of fission. In this simple model the ground state minimum occurs at no deformation, another limitation of the model since ground state of many fissionable nuclei are known to have significant quadrupole deformation. As the nuclear deformation increases the deformation energy reaches a maximum, beyond which there is scission.
Figure 2.2: Generalized fission barrier from the liquid drop model. The ground state nucleus has no deformation, and several excited states with no deformation are shown.
by[22]
THW =
1 + exp
2πVo−E ~ω
−1
. (2.2.4)
Because of the unrealistic spherical ground state, the shape of the fission barrier ob-tained with the liquid drop model is likely too broad at the base, so the calculated barrier penetrabilities do a poor job of reproducing experimental measurements. The calculated fission barrier shape may then be improved upon by considering the role of shell effects.
2.3 Strutinsky Hybrid Model
The nuclear shell model treats nucleons as moving independently in an averaged potential produced by the mutual interaction of all the nucleons, consisting of a spherical central potential and a spin-orbit interaction. The nucleons are then characterized by wavefunctions which occupy individual energy levels. By calculating single particle states for deformed nuclear potentials, the total nuclear energy for an even-even nucleus can be written as[23]
E =X
µ
where nµ are the occupation numbers and εµ are the energy levels of the single particle states described by the Nilsson Hamiltonian[24]. Since the shell model potential is only an approximation and residual particle interactions are neglected, errors will accumulate and the resulting energy E will be less accurate than the liquid drop model energy.
The Strutinsky hybrid model attempts to reconcile this issue by taking the liquid drop model as a starting point and adding in the deviations due to the shell effects[25]. The total energy of the nucleus is expressed as[4]
E =ELDM +
X
p,n
(δU +δP), (2.3.2)
whereELDM is the liquid drop model energy, δU is the shell correction energy andδP is the pairing correction energy; with both corrections dependent on the proton number, neutron number and nuclear deformation. The pairing correction arrises from the tendency of two nucleons of the same type to form a spin-0 pair which lowers the energy of the system. The shell correction is defined as the difference between the nuclear energy calculated for a realistic shell model potential, U, and an unrealistic uniform distribution which washes out the shell effects, ˜U.
δU =U −U .˜ (2.3.3)
U is the sum of the single particle state energies as in
U =X
µ
2nµεµ. (2.3.4)
˜
U results from an integration over a uniform distribution of states, ˜g(ε), as in
˜
U = 2
Z λ
−∞
whereλ is the chemical potential of the nucleus defined by the total number of nucleons,N,
N = 2
Z λ
−∞ ˜
g(ε)dε. (2.3.6)
The uniform distribution of states is achieved by taking the shell distribution from the Nilsson model[24] and averaging it over a large enough energy range to smooth out the finer shell effects. The distribution in this “Strutinsky smoothing method” is defined as
˜
g(ε) = √1
πγ X ν exp " ε−εν
γ
2#
, (2.3.7)
where ν is summed over the number of energy levels in the energy interval √πγ, which is centered atε. The range of the spreading functionγis of the order of the shell spacing in order to sufficiently smooth out the effects of single particle excitations. The resulting distribution suffers from the same build-up of error due to lack of residual particle interactions and has the same, incorrect magnitude as the initial shell model calculations. However, because the calculations were performed over a spread of states the fine structure due to single particle excitations is not present, and the difference between the two calculations is purely due to shell effects.
Figure 2.3: Illustration of Strutinsky method with generalized fission barrier structure, de-rived from Ref. [22].
2.4 Modern Fission Models
Advances in computing power have allowed for macroscopic-microscopic calculations to be performed with an increasing number of degrees of freedom in the deformation of the nucleus with more sophisticated and more realistic nuclear potentials. A recently developed macroscopic-microscopic model[26] calculated the fission barrier for 232Th in 8-dimensional deformation parameter space. The microscopic energy was calculated with a deformed Woods-Saxon potential while the macroscopic energy was calculated using the Yukawa plus exponential model[27]. The potential energy surface as a function of quadrupole and hex-adecapole deformations is shown in Fig. 2.4. The 8-dimensional surface is projected into two dimensions by minimizing the energy of the other 6 deformation parameters.
Figure 2.4: 232Th fission barrier calculated with 8-dimensional macroscopic-microscopic model[26]. The axis labels β20 and β40 are the quadrupole and hexadecupole deformations, respectively.
is good agreement between modern macroscopic-microscopic and self-consistent models and inferred barrier structure from measurements. However, there is one aspect of the fission barrier for which there still considerable debate, both amongst theory and experimental data: the existence of a third minimum in the fission barrier.
For most nuclei theoretical calculations generally predict a double-humped fission barrier or at most a shallow third minimum, with a depth of less than 500 keV. Deep third minima arise only in calculations of some lighter mass isotopes of actinides with low neutron numbers. The depth of the third minimum has been associated with the neutron shell correction energy[28]. The influence of neutron number on the depth of the third minima is highlighted in Fig. 2.6, where the shallow third minimum vanishes with increasing isotopic mass. It is then expected that more neutron rich isotopes of an element like 232Th and 238U should not have deep third minima in their fission barriers.
Figure 2.5: 232Th fission barrier calculated with a self-consistent model, as a function of the quadrupole momentQ20. Results with three different Skyrme energy density functionals are compared with experimentally measured barrier heights[28].
CHAPTER 3: PHOTOFISSION THEORY
3.1 Photoabsorption
The motivation for studying fission through photofission measurements may be under-stood by considering the interaction between the nucleus and the electromagnetic field. Un-like neutron induced fission which brings a large range of angular momenta into the excited compound nucleus, the potential momentum states for photoabsorption are limited by a combination of selection rules and vanishing contributions from higher order multipolarities. To connect an initial state with momentum Ji to a final state with momentum Jf with an electromagnetic interaction with multipolarity l, the following sum rule must be obeyed[32]:
|Ji−l| ≤Jf ≤ |Ji+l|. (3.1.1)
Additionally for an initial state parityπi and final state parity πf, πiπf = (−1)l for electric transitions whileπiπf = (−1)l+1 for magnetic transitions. The transition rate between those two states is given by[32]
Tf i(l;R) =
8π(l+ 1)
l[(2l+ 1)!!]2
k2l+1
~
|hf|Ωˆlµ(R)|ii|2, (3.1.2)
couple only to J = 1 andJ = 2 excited states. A further limitation in the number of states which contribute to photoexcitations may be found by considering the relative strengths of the electric and magnetic interactions. All electric or magnetic interaction information is contained within the nuclear matrix element, so estimating their respective strengths would require specifying the currents in the nucleus.
A simpler estimate of relative strengths can be made using Weisskopf estimates which are based on electromagnetic, single-nucleon transitions based on a simplistic constant radial wave function confined to the nucleus and an angular momentum part given by a spherical harmonic and a spinor[33]. The ratio of the resulting transition rates is
T(l, M)
T(l, E) ≈0.3A
−2/3 (3.1.3)
which gives an M1 contribution of about 0.8% that of the E1 strength for A = 230. Thus in low energy photofission measurements the E1 excitation will be dominant and the most probable mode of excitation will be Jπ = 0+ → Jπ = 1−, allowing for much more selective measurements than neutron or heavy ion induced fission. Additionally the k2l+1 energy dependence of the transition rate means that the photofission cross section will vary smoothly with γ-ray energy, with the major exception of resonances which will be discussed in the next section.
3.2 Fission Barrier Interpretation
Figure 3.1: Schematic energy level diagram for an even-even nucleus, based on Ref. [34].
permanent deformation of the nucleus. Vibrational modes may also be excited, the simplest of which is aβ vibration or “breathing mode” which is inherently unstable due to vibrations in the direction of the fission axis. There is a mass asymmetry mode referred to as “sloshing” corresponding to an inverting pear shaped mass distribution in which the mass asymmetry oscillates back and forth. A class of vibrational states called γ-vibrations are an excitation in which an ellipsoidal oscillation breaks axial symmetry. Finally there is also a “bending mode” in which the two ends of the highly deformed nucleus flex relative to the nuclear center. This collective state has not been identified in the excitation spectrum of nuclei in their ground state, but is expected to be present in the saddle point deformation where the energy of the state would be lower.
Figure 3.2: Schematic of class I-III isomeric excitation states and transition states within the fission barrier, based on Ref. [22].
internal barriers and the structure of the states involved. In situations where the energy of a class I state is close to that of a class II or III state, a higher degree of mixing can be expected, resulting in an increased probability of the nucleus in a class I excitation state penetrating the full barrier and undergoing scission.
The effect of intermediate states in the potential well of the fission barrier may be il-lustrated with the relatively simple case of a class I excitation coupling to a class II β
vibrational state in a double-humped fission barrier. The calculation is performed for an undamped transition resonance in which the strength of the β-vibrational state is not dis-tributed over neighboring states in the second minimum. The probability of the class I state’s undergoing fission can be written as[35]
Pf I =
DI 2π
ΓAΓB/ΓγI (E−Eβ)2+W2/4
Figure 3.3: Barrier penetration probability for class I states close to the energy of a class II
β-vibrational state, with level densityDI and resonance width W.
where the width of the resonance is given by
W =
s
(ΓA+ ΓB+ ΓγII)2+ 2
πΓAΓB DI ΓγI
(3.2.2)
and DI is the level distance between class I states. E and Eβ are the energies of the class I and β-vibrational states, EA and EB are the inner and outer fission barrier heights, ΓA and ΓB are the widths for tunneling through the inner and outer fission barriers, and ΓγI and ΓγII are theγ-decay widths for states in the first and second minima. The widths ΓA,B can be calculated using the Hill-Wheeler transmission coefficient PA,B[22] as[35]
ΓA,B =PA,B~
ωII 2π =
1 +e
2π(EA,B−E)
~ωA,B ,
−1 ~ωII
2π (3.2.3)
barrier minima. The fission cross section is then given by
σ =σcIPf i, (3.2.4)
where σcI is the cross section for the formation of the compound class I state in the first minimum.
Figure 3.4: Schematic diagram of photofission resonances due to transition states in the fission barrier, based on Ref. [22].
section resonances will be broadened by damping of the vibrational state, and additionally will be limited by the resolution of the probing γ-ray beam.
3.3 Fission Fragment Angular Distributions
Figure 3.5: J, K and M quantum numbers for the transition nuclear states in Bohr formal-ism.
The first theoretical model of fission to describe the angular distribution of the fission fragments was developed by A. Bohr[17], using the fission channels described in section 3.2. The deformed nucleus (see Fig. 3.5) is described using the quantum numbers J, K and M
whereJ is the total angular momentum,K is the projection ofJ onto the nuclear symmetry axis, and M is the projection of J onto a space-fixed axis which for the remainder of this work will be taken to be the beam axis.
that point the two nascent fragments will be repelled by mutual Coulomb repulsion and fly apart along the nuclear symmetry axis. The angular distribution of the fission fragments is then given as the angular distribution of the nuclear symmetry axis. The saddle point configuration of the nucleus may be treated as a spinning symmetric top with the well known angular distribution
WM KJ (θ) = 2J+ 1 2 |d
J M,K(θ)|
2, (3.3.1)
where dJ
M,K(θ) are the Wigner rotation functionals given by[36]:
dJM,K(θ) = X n
(−1)n−K+M
p
(J+K)!(J −K)!(J +M)!(J−M)! (J+K−n)!n!(J −n−M)!(n−K+M)! ×
cosθ 2
2J−2n+K−M
sinθ 2
2n−K+M .
(3.3.2)
However, ±K are indistinguishable from one another given that either results in the same fission axis, so they are given equal weight and summed. Consequently K may be taken to be |K|. In the special case of photofission of an even-even nucleus, M can only have the values ±1, so the two cases may be summed over with equal weight as
WKJ(θ) = 2J+ 1 2 1 2
|dJ+1,K(θ)|2+|dJ
−1,K(θ)|2
. (3.3.3)
Equation 3.3.3 describes the angular distribution of fission fragments from an unpolar-ized beam. When the incident γ-ray beam polarization is accounted for, the distribution becomes[37]
WKJ(θ, φ) = 2J+ 1 2
1 2
|dJ+1,K(θ)|2+|dJ−1,K(θ)|2
+PγωLcos2φdJ+1,K(θ)d J −1,K(θ)
, (3.3.4)
to the polarization axis and Pγ is the degree of polarization of the beam given by
Pγ =
N||−N⊥
N||+N⊥
. (3.3.5)
Here N|| is the number of photons polarized parallel to the choice of polarization axis and
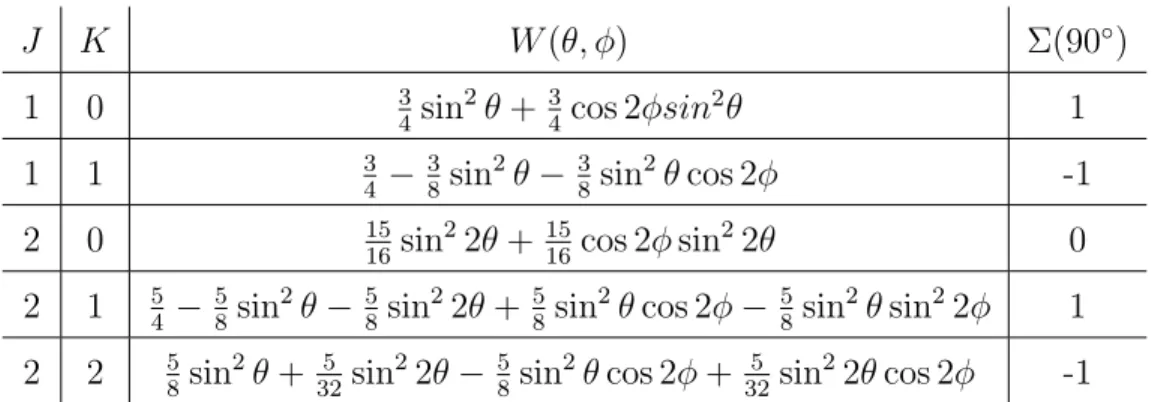
N⊥ is the number with the opposite polarization state. To express the angular distributions from contributing fission channels, recall from section 3.1 that both magnetic and higher multipolarity transitions will be suppressed and can be neglected. Considering only electric dipole and quadrupole transitions the angular distributions of the fission fragments are shown in Table. 3.1, where a 100% polarized beam has been assumed. A polarization asymmetry Σ(θ) is defined as
Σ(θ) = W(θ,0)−W(θ, π/2)
W(θ,0) +W(θ, π/2) (3.3.6)
which is equal to the difference in the yield in the plane of polarization and out of the plane of polarization divided by the total. In Table. 3.1 the polarization asymmetry has been evaluated at θ = 90◦, or perpendicular to the beam axis. The observed fission fragment angular distribution will be a linear combination of the WJ
K(θ, φ) distributions weighted by the relative contribution of each fission channel (J, K). If the angular distributions for the electric dipole and quadrupole excitations are summed with relative weighting coefficients, the resulting angular distribution will have the form
W(θ, φ) = a+bsin2(θ) +csin2(2θ) + cos(2φ)[bsin2(θ) +csin2(2θ)], (3.3.7)
wherecis an energy dependent coefficient that corresponds to quadrupole excitations and b
contains both quadrupole and dipole terms.
J K W(θ, φ) Σ(90◦)
1 0 34sin2θ+34cos 2φsin2θ 1
1 1 34 −3
8 sin 2θ− 3
8sin
2θcos 2φ -1
2 0 1516sin22θ+ 1516cos 2φsin22θ 0 2 1 54 − 5
8sin 2θ−5
8sin
22θ+5 8sin
2θcos 2φ− 5 8sin
2θsin22φ 1 2 2 58sin2θ+325 sin22θ−5
8sin
2θcos 2φ+ 5 32sin
22θcos 2φ -1
Table 3.1: Angular distributions of E1 and E2 transition states of even-even nuclei for polarized beam in the Bohr formalism.
electric dipole transitions. This assumption simplifies the angular distribution to
W(θ, φ) = a+bsin2(θ) +bcos(2φ) sin2(θ), (3.3.8)
where a and b are normalized so that a+b = 1. The polarization asymmetry then reduces to
Σ(θ) = bsin 2(θ)
a+bsin2(θ) (3.3.9)
and Σ(90◦) = b. The relative contributions of the fission channels may then be probed by measurements of the polarization asymmetry.
A potential flaw in Bohr’s formalism was pointed out by Kadmensky[38] in the assump-tion that the fission fragments are emitted exactly along the nuclear deformaassump-tion axis. From the uncertainty relation between the nuclear deformation axis and the orbital angular mo-mentum l of the fragments, if the deformation axis is perfectly known then the angular momentum is completely undefined. This leads to contributions from 0≤l ≤ ∞, where the high l contributions are completely unphysical.
Bohr predictions but it deviates for finitelm values. Iflmis estimated to be∼25 by summing the final spins of the fission fragments and the spins carried by prompt γ-rays and neutrons emitted during fission[39], the fission fragment angular distributions predicted by Kadmen-sky differ from Bohr’s predictions by only a few percent. Given the good agreement between Bohr and Kadmensky approaches, for the purposes of the present work the Bohr formalism is sufficient for adequately describing the angular distribution of the fission fragments.
The fission channel formalism has been remarkably successful at describing the angular distributions of fission fragments, with a wealth of of experimental measurements in agree-ment with the predicted features of the distributions[15][41][42][43]. As will be described in the next section, information about the angular distribution of the fission fragments is also carried by the neutrons emitted during fission.
3.4 Fission Neutrons
A majority of the energy released by fission goes towards accelerating the fission frag-ments, and is expressed as their kinetic energy. The remaining fission energy exists in the fragments either as internal excitation energy or stored as deformation which is then converted to excitation energy when the fragments relax to their equilibrium shape. The fragments can then de-excite by emitting neutrons andγ-rays. The rest of this section (and the present work) will focus on the neutrons emitted by fission fragments. Since the energy to liberate neutrons depends on the mass division, compound nuclear excitation energy, and kinetic energy release of fission, fission neutrons provide an avenue for gaining insight into the fission process.
As the nucleus moves from saddle to scission, the connection between the two binary com-ponents which will ultimately separate can be characterized as a thin neck with shrinking diameter. At scission the neck ruptures and the remaining stubs are absorbed into the nascent fragments. In that moment the neutrons can still be described by their pre-scission wave functions, but now find themselves in a new potential created by the separated fragments. The neutron wave functions can couple to the continuum and neutrons can be emitted. Scission neutrons are characterized by their angular distribution as they are emitted from a stationary nucleus or fragment. The resulting distribution is thought to be mostly isotropic, with small anisotropies caused by the scattering and absorption of the neck neutrons by the fission fragments[45]. Scission neutrons are estimated to contribute on the order of at most 10% of the total fission neutrons[4].
Prompt fission neutrons constitute the vast majority of neutrons emitted during fission, with 2-4 typically emitted in a fission event. These neutrons are assumed to be emitted by the fully accelerated fission fragments and therefore have an angular distribution which is correlated with that of the fragments. This assumption can be shown to be reasonable by considering the timescales for fragment acceleration and neutron emission. The fission fragments will be fully accelerated from mutual Coulomb repulsion with a timescale of 10−20 s[4]. The neutron emission timescale of the excited fragment has been calculated with a statistical model as[46]
τ = 2A 1/3
U −Bn
eBn/T ×10−21s, (3.4.1)
where τ is the lifetime of the excited fragment state prior to neutron emission, A is the fragment mass (∼100),U is the excitation energy of the fragment (taken to be on the order of 10 MeV), Bn is the neutron binding energy (∼ 5 MeV) and T is the temperature of the nucleus, given by
T =
r
10(U −Bn)
A . (3.4.2)
orders of magnitude longer than the fragment acceleration timescale. Thus the neutrons can be treated as being emitted by fully accelerated fission fragments.
Figure 3.6: Calculated neutron spectrum for 238U(γ,f) at E
γ = 10 MeV, using Watt param-eters from Ref. [47].
It is usually assumed that the prompt fission neutrons are emitted isotropically in the fragment rest frame, “boiling” off the hot nucleus with no preferred direction. This simpli-fication ignores anisotropies in neutron emission caused by fragment deformation, in which neutrons will be preferentially emitted at the narrow ends of a deformed nucleus where the nuclear binding force is reduced. For the purposes of the present work these effects are con-sidered to be negligible compared with the anisotropies introduced by the boost the emitted neutrons receive from the fission fragment. Using an evaporative model the spectrum of the neutrons in the fragment rest frame is given by[4]
P(En)∝EneEn/T, (3.4.3)
Following conversion from the fragment rest frame to the laboratory frame, the prompt fission neutrons receive a significant boost as the fragment is traveling at approximately 1 MeV/nucleon. The neutron spectrum in the laboratory frame is given by the Watt spectrum[4]
P(En)∝e−En/T
s
sinh
4EnEf
T2
, (3.4.4)
where Ef is the fragment energy per nucleon. A calculated Watt spectrum is shown in Fig. 3.6 for the photofission of 238U with Eγ = 10 MeV.
Figure 3.7: Diagram showing the effect of the boost from the fission fragment on the prompt fission neutrons. The arrow lengths correspond to the relative velocities of the fragments and neutrons.
section 7.4.
After fully de-exciting and coming to a stop the fission fragments are still capable of emitting delayed neutrons, which follow aβ-decay of the fragment in the rare situation where the β-decay energy of the parent nucleus is greater than the neutron binding energy of the daughter nucleus. Delayed neutrons are emitted on timescales of milliseconds to minutes after fission, and consequently do not contain any information about the energetics of the fission process or the angular distribution of the fragments. The contribution of delayed neutrons to the total fission neutrons is on the order of ∼ 1%[4] and can be neglected for the purposes of this work.
Figure 3.8: Schematic prompt fission neutron multiplicity distribution, relative to the mean multiplicity ν. The multiplicity distribution is modeled as a Gaussian function with a mean
ν and a spreadσ = 1.08.
multiplicity ν. In general the mean of the multiplicity distribution increases with increasing excitation energy of the fissioning nucleus in a linear fashion. The potential modifications to this general rule at excitation energies well below the fission barrier as will be discussed in section 4.4.
The fission neutron multiplicity is sensitive to the prompt neutron emission mechanism as well as the properties of the fission fragments: kinetic energies, excitation energies and masses. The relationship between the mass of a fission fragment and the number of emitted neutrons is shown in Fig. 3.9 for239Pu(nth,f). Rapid changes in the multiplicity distribution would therefore be indicative of a change in the contributing fission modes such as the availability of a new fission channel. In summary, prompt photofission neutrons contain a wealth of information about the energetics of the fission process, and represent a valuable tool for photofission measurements.
Figure 3.9: The number of neutrons emitted by a fission fragment as a function of the fission fragment mass for239Pu(n
CHAPTER 4: PREVIOUS PHOTOFISSION MEASUREMENTS
4.1 Introduction
There have been many photofission measurements performed in the study of the fission process. This chapter will focus on describing the measurements which probe the proper-ties of photofission at sub-barrier energies. There has been much debate and disagreement between theoretical predictions and experimental measurements over the existence of a well formed third minimum in the fission barrier of many nuclei. Theoretical calculations gener-ally predict a shallow or nonexistent third minimum. The number of experimental results supporting the existence of deep third minima in a number of actinides has been growing in recent years, with data collected through a variety of experimental techniques including transfer reactions[49][50][51], neutron induced fission and photofission[13]. Fission barrier parameters are crucial inputs for cross section calculations on the Th-U fuel cycle of next generation nuclear reactors. The selectivity of photofission measurements allows for the investigation of fission resonances in the first and second potential energy minima.
4.2 Photofission Cross Sections
4.2.1 Photofission of 232Th
There are about a dozen measurements of the 232Th(γ,f) reaction cross section below Eγ = 6 MeV available in the literature, and 10 have been listed in table 4.1. To put the re-gion of the photofission cross section spanned by this collection of data into perspective, Fig. 4.1 shows the experimentally measured 232Th(γ,f) reaction cross section over the full giant dipole resonance (GDR), between 10 MeV and 20 MeV, where the cross section reaches its maximum. By far the measurement with the highest precision at low energies is the one per-formed by Smirenkin and Soldatov[52]. Bremsstrahlungγ-ray beams produced by microtron driven electron beams were directed onto a 0.1mm thick 232Th foil, which was monitored by mica plates on either side. Fission fragments were detected by the tracks they left in the mica plates. Because of the broad nature of the bremsstrahlung spectrum, the fission cross section is integrated over the overlap of theγ-ray beam spectrum. The underlying photofis-sion cross section is then determined using an iterative unfolding technique. Measurements were taken with electron beam energy steps of 25 keV to allow for high resolution studies of the cross section.
First Author Year Eγ Range (MeV) Beam Spread σsys σstat
Rabotnov[53] 1970 5.17-7.6 Brem. Brem. n/a 19%
Mafra[54] 1972 5.43-9 (n,γ) mono “appreciable” 80%
Yester[55] 1973 5-8 (n,γ) n/a 30% 67%
Compton
Dickey[56] 1975 5.1-7.9 Tagged-γ 2% 15% 126%
Bowman[57] 1978 3.5-5.5 Brem. Brem. “perhaps a 48%
factor of 2”
Caldwell[58] 1980 5.3-18 e++e− 6% 7% 15%
Knowles[59] 1982 4.96-6.76 Tagged-γ 0.2% 20% 28%
Zhang[60] 1986 5.8-11.9 (p,γ) 10% 10% 6%
Findlay[61] 1986 5.32-7.11 Brem. Brem. 10% 8%
Smirenkin[52] 1995 4.78-8.88 Brem. Brem. “disregard 7% errors”
Figure 4.2: Measured232Th(γ,f) reaction cross section[52] with cross section calculated from barrier fit[62]. The dotted curve is the calculated photofission cross section without including damping, which would allow for the vibrational transition states to interact with other states within the fission barrier. The solid curve is the calculated photofission cross section with damping. The dashed curve is a characterization of the exponential part of the photofission cross section and may be disregarded for the present work.
The data were then re-analyzed[62] to determine the structure of the232Th fission barrier. The authors attempted to reproduce the measured photofission cross sections by assuming some barrier structure and calculating the resulting penetrability and cross section, and then tuning the parameters of the barrier to improve the fit. A comparison between the measured and calculated cross sections is shown in Fig. 4.2. There are some deviations, particularly in the region of 5.3−5.6 MeV, but overall the fit is in agreement with the measured cross section.
Figure 4.3: Inferred fission barrier structure for 232Th[62].
theoretical predictions and the experimentally determined third minimum warrants further investigation. Currently there is only a single set of 232Th(γ,f) cross section measurements which covers the excitation energy range where resonances associated with the third mini-mum are expected[52]. The lack of systematic error analysis for the measurement justifies a new validation measurement. The γ-ray beams used in the present work had a broader energy resolution (∼ 300 keV) than what was achieved in the previous work by unfolding bremsstrahlung data taken in 25 keV steps, but the present work will be able to measure the magnitude of the232Th photofission cross section with significantly improved systematic errors.
4.2.2 Photofission of 238U
Figure 4.4: 238U(γ,f) reaction cross section over the GDR[58]. The present work will measure the region below 6 MeV.
thin enough that the electrons were likely to only interact once at most, producing a single bremsstrahlungγ-ray. The scattered electron was detected with an electron spectrometer to determine the energy of theγ-ray, given by the difference between the energy of the electron beam and the scattered electron energy.
Photofission neutrons were detected with NE213 liquid scintillator neutron detectors. Pulse shape discrimination was used to suppressγ-ray backgrounds. Additionally the time-of-flight between the pulsed γ-ray beam being incident on the target and the neutron being detected was used to reject uncorrelated neutrons and separate the lower energy neutrons from the 238U(γ,n) reaction. The 238U(γ,f) cross section was determined by only including neutrons with energy greater than 300 keV, as they could only be produced by fission.
First Author Year Eγ Range (MeV) Beam Spread σsys σstat
Manfredini[63] 1965 5.4-7.7 (n,γ) Mono. 10% 16%
Rabotnov[53] 1967 4.8-8 Brem. Brem. n/a 79%
Mafra[54] 1972 5.4-9 (n,γ) Mono. “Appreciable” 20%
Kahn[64] 1972 5-8.4 (n,γ) 5% 22% 60%
Anderle[65] 1973 5-8 (n,γ) 5% 30% 56%
Dickey[56] 1975 5.1-7.8 tagged-γ mono 15% 50%
Caldwell[58] 1980 5.3-18 e++e− 5% 7% 16%
Csige[13] 2013 4.8-6.1 HIγS 3% n/a 5%
Table 4.2: Previous measurements of the238U(γ,f) reaction cross section at energies below 6 MeV. Quoted statistical uncertainties are given for the closest data point to Eγ = 5.5 MeV.
Photofission neutrons were detected with a neutron detector consisting of 48 BF3 propor-tional counter tubes, each 2.54 cm in diameter and 51 cm in length, embedded in 4 coaxial rings within a 61 cm cube of paraffin moderator. Each ring of 12 proportional counters was read out separately since the ratio of counts from one ring to another can be used to determine the average neutron energy. Additionally, the delay between γ-ray beam pulses was sufficiently long that neutrons from one fission event would be fully detected or escape the detector before the next beam pulse, allowing for the prompt neutron multiplicities to be measured.
The most recent measurement of the238U cross section was performed by Csigeet al.[13], who measured the fission fragments directly instead of the neutrons they emit. An array of 23 238UO2 parallel plate avalanche counters was exposed to an inverse Compton scattered
(HPGe).
Figure 4.5: Measured238U(γ,f) reaction cross section compared with calculated cross sections for double- and triple-humped fission barriers[13].
4.3 Photofission Neutron Polarization Asymmetries
There has only been one experimental measurement of the prompt neutron polarization asymmetries in the photofission of 232Th and 238U, performed by Mueller et al.[14][69][70]. The experiment used linearly-polarizedγ-ray beams provided by HIγS to induce photofission in 232Th and 238U as well as other actinides and detected the photofission neutrons with an array of 18 BC-501A liquid scintillator neutron detectors (see Fig. 4.7). Pulse shape discrimination and time-of-flight cuts were used to suppressγ-ray backgrounds.
Figure 4.7: Neutron detector arrangement for Mueller et al.[14].
The measured polarization asymmetries for 232Th and 238U are shown in Fig. 4.8. The neutron polarization asymmetry is defined as
Σn(θ) =
W(θ, φ= 0) +W(θ, φ= 180)−W(θ, φ= 90)−W(θ, φ= 270)
W(θ, φ= 0) +W(θ, φ= 180) +W(θ, φ= 90) +W(θ, φ= 270) (4.3.1)
Figure 4.8: Neutron polarization asymmetries measured by Mueller et al.[14]. Error bars correspond to statistical uncertainties.
The large asymmetry at low Eγ is due to fission primarily proceeding through the (Jπ,K) channel (1−,0) which, as discussed in section 3.3, has a large polarization asymmetry. At higher Eγ there are contributions from the (1−,±1) channels which have a negative asym-metry, so the combined angular distribution from all contributing channels is overall less asymmetric.
The asymmetries are shown for all detected neutrons with energies above a 1.5 MeV threshold since the pulse shape discrimination technique does not effectively separate the
γ-ray background for smaller pulse heights. A majority of the fission neutron energy spec-trum falls below this threshold (see Fig. 3.6), so only a fraction of the fission neutrons are measured. Given the correlation between the neutron emission angle relative to the fission fragment and its energy (see Fig. 3.7), it is expected that the neutron polarization asymme-try for all energies will be smaller as the angular distribution of the lower energy neutrons won’t follow the fragment angular distribution as directly and will be more spread out.
4.4 Photofission Neutron Multiplicities
There are two measurements[61][71] of the prompt photofission neutron multiplicities for 232Th in the E
γ region of interest for the present work (Eγ ≤ 6 MeV), and the one measurement[71] for238U which partially overlaps the E
γ region of interest (Eγ ≤6.3 MeV). Findlay et al.[61] measured the 232Th prompt photofission neutron multiplicities induced by bremsstrahlung γ-ray beams. Photofission neutrons were detected by an array of 56 BF3 proportional counters suspended in oil moderator. Measurements were taken in end point energy steps of 50 keV below 6.5 MeV and 100 keV above 6.5 MeV, and an unfolding technique was employed to determine the underlying multiplicity distribution as a function of excitation energy. The 232Th and 238U neutron multiplicity data from Caldwellet al.[71] were generated from the same set of measurements performed by Caldwell and Dowdy[58] which is described in section 4.2.2.
(a) 232Th(γ,f) ν[61][71]. (b)238U(γ,f) ν[71].
Figure 4.9: Prompt photofission neutron multiplicities for 232Th and 238U.
an improved measurement of ν for232Th is necessary for constraining the photofission cross sections.
(a)232Th(γ,f)σ[71]. (b)238U(γ,f)σ[71].
Figure 4.10: Prompt photofission neutron spreads for 232Th and 238U.
The prompt neutron multiplicity distribution is also defined by a spread σ with the assumption that the distribution can be modeled with a Gaussian function. The data of Caldwell et al.[71] represents the only measurement of σ for the sub-barrier photofission of 232Th and 238U. In the case of both isotopes the existing data do not overlap with the E
γ
CHAPTER 5: THE EXPERIMENT
5.1 Introduction
Measurements were performed at the High Intensity γ-ray Source (HIγS) facility[72], which produced the high-flux, quasi-monoenergetic polarizedγ-ray beams necessary for this work. The γ-ray beams were incident on either a 232Th or 238U target, inducing photofis-sion and emitting neutrons. Additionally a natPb and D
2O target were used for measuring backgrounds and characterizing the detector. The fission neutrons were detected by a high-efficiency neutron detector with multiple 3He proportional counters. Signals were recorded from each proportional counter individually to preserve asymmetries about the polarization axis of the γ-ray beam. Production of the γ-ray beams will be discussed in more detail in sections 5.3 and 5.4. Sections 5.5 and 5.6 will cover the description of the neutron detector and the data acquisition system, section 5.7 will describe the targets, and a more detailed account of the experiment follows in section 5.2.
5.2 Experiment
of the beam axis. A polycarbonate vacuum pipe under rough vacuum extended from the collimator hut to past the INVS detector to prevent backgrounds due to theγ-ray scattering in the air. The targets for the photofission experiment or for γ-ray beam diagnostics were mounted in the vacuum pipe in the longitudinal and axial center of the INVS detector. The full experimental configuration is shown in Fig. 5.1.
Figure 5.1: Experiment arrangement (not to scale) of detector, target and flux monitor.
5.3 HIγS γ-ray Beams
The HIγS facility produced γ-ray beams by a Compton scattering process in which low energy photons generated with a free electron laser (FEL) collide with counter propagating high energy electrons, boosting the photon energy into theγ-ray regime. A schematic of the free electron laser facility is shown in Fig. 5.2. Electrons were accelerated by a linac and injected into bunches in the booster ring, where the electrons were accelerated to match the energy of the storage ring, between 240 MeV and 1.2 GeV. The electrons were then injected into the storage ring in 2 bunches which traveled around the ring 180◦ out of phase. A series of wiggler magnets along one side of the storage ring caused the electrons to oscillate and emit photons as they traveled through. A pair of mirrors on either end of the beam line formed an optical cavity which trapped the FEL photons. After the FEL photon bunch was reflected by a mirror and traveling in the opposite direction, it encountered the second electron bunch at the collision point and inverse Compton scattering would occur. A head-on collision between a photon and electron raised the photon’s energy from 1.17−6.53 eV to 1−100 MeV, depending on the energy of the FEL photons and the energy of the electrons in the storage ring. The scattered energetic photons, which were boosted to γ-ray energies, traveled through the mirror and on to the collimator and target area, 60 m from the collision point.
light. Most of the present work was performed with linearly polarizedγ-ray beams, but some data were taken with circularly polarized beams to calibrate the detectors and account for any geometry induced asymmetries.
5.4 γ-ray Beam Diagnostics
Figure 5.3: Scintillating paddle used as the γ-ray beam flux monitor
of the BC501A scintillator is not as well known for such low neutron energies, and as a result different parameterizations of the light yield produced different pulse height spectra and therefore different neutron detection efficiencies. Among several light yield curves tested, the efficiency of the flux monitor changed by over a factor of 2. Additionally the dependence of the flux monitor efficiency on γ-ray beam energy depended strongly on the choice of light yield data. Ultimately the flux monitor based on deuteron photodisintegration was rejected in favor of instead using the scintillating paddle as the absolute flux monitor for the HIγS
γ-ray beam. The calibration method is described in detail in section 6.5.
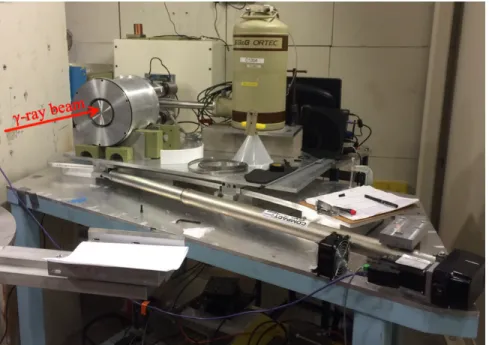
Figure 5.4: HPGe detector and moveable table platform, in the 0◦ position.
the γ-ray beam in copper changes slowly and smoothly with energy, so the energy spectrum of the γ-ray beam was unaffected by the attenuation. Once the copper attenuators were in place the HPGe detector was moved into the 0◦ position to measure the spectrum of the
γ-ray beam.
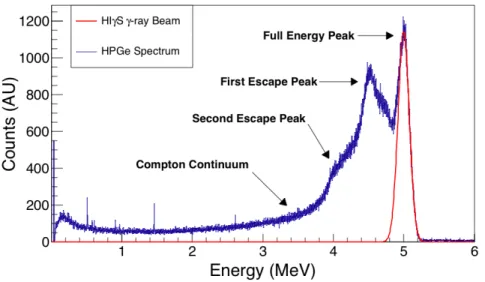
Figure 5.5: 5.0 MeV γ-ray beam spectrum obtained with the HPGe detector at 0◦.
The HPGe detector signal was shaped and amplified by a spectroscopy amplifier, and the resulting signal was sent into a Canberra Multiport II multichannel analyzer (MCA). Spectra were acquired from the MCA with the GENIE 2000 software package. A typical
γ-ray beam spectrum obtained with the HPGe detector is shown in Fig. 5.5. The full energy peak is populated by events where a γ-ray deposits all of its energy into the detector. The first and second escape peaks correspond to events where one or two 511 keVγ-rays leave the detector without depositing energy. The 511 keV γ-rays are produced by the annihilation of a positron generated through pair production in the detector. Consequently the first and second escape peak are located at 511 keV and 1022 keV below the full energy peak, respectively. The Compton continuum consists of events where the incident γ-ray Compton scatters off an electron within the detector and exits the detector, with only the electron depositing energy. The analysis of the HPGe spectra is detailed in section 6.2.
Figure 5.6: HIγS γ-ray beam imaging system[73].
collimator and targets. Theγ-ray beam imager consists of a scintillating plate, a mirror and a CCD camera, arranged as in Fig. 5.6 to capture an image of the fluorescent light emitted by interactions between the γ-ray beam and the plate. Dense materials in the path of the
Figure 5.7: Example images taken with the γ-ray beam imager of a misaligned and aligned collimator[73].
(a) Alignment target. (b) Image of alignment target taken bybeam imager. γ-ray
5.5 Neutron Detector
The model-IV Inventory Sample neutron detector[74] (INVS) consisted of 18 3He pro-portional counters embedded in a cylindrical shell of polyethylene moderator (Fig. 5.9). The proportional counters had a diameter of 2.54 cm, an active length of 39 cm and a 3He gas pressure of 6 atm. The tubes were arranged in 2 concentric rings with radii 7.24 cm and 10.60 cm, with each ring containing 9 equally spaced proportional counters. The polyethy-lene detector body was 46.2 cm long and 30.5 cm in diameter with an 8.9 cm diameter axial cavity for placing a neutron generating target.
Figure 5.9: INVS detector.
with charges collected on the central anode wire. A charge sensitive preamplifier amplified the charge avalanche signal producing a large voltage pulse.
As designed at Los Alamos National Laboratory the INVS initially had preamplifier and discriminator circuits built into the detector. The proportional counters were grouped into 3 preamplifier channels by electrically connecting the anodes of the counters: 4 and 5 tubes from the inner ring, and 9 from the outer ring. The logic signal outputs of the 2 channels that made up the inner ring were then combined so that the detector would output counts in the inner ring, the outer ring, and the total counts as TTL signals. This detector configuration had no sensitivity to the angular distribution of neutrons, in particular any asymmetries induced by a linearly-polarizedγ-ray beam. Further the signal analysis electronics functioned as a black box making it impossible to determine ifγ-ray interactions in the 3He tubes were not registered as neutron pulses. Finally the existing signal analysis electronics were not designed to generate timestamps for each neutron detection event. Since one of the goals of this work is to measure the prompt fission neutron multiplicities, the DAQ needed to record neutron detection times so that neutrons from the same fission event could be correlated in the subsequent analysis.
The INVS was modified for the present experiment to allow for single tube readout by re-moving the original preamplifier and discriminator circuits and installing 18 SHV connections with direct access to each of the proportional counter anodes. An array of Cremat CR-110 charge sensitive preamplifiers[75] was mounted in a single enclosure (Fig. 5.10) with each preamplifier connected to a single proportional counter. The outputs of the preamplifiers were then sent to the data acquisition system.
5.6 Data Acquisition
Figure 5.10: Cremat preamplifier array for the INVS detector.
In the real-time DAQ system, signals from the preamplifiers were sent through a fast timing-filter amplifier (TFA), a constant fraction discriminator (CFD) and finally to a scaler which was read out by the proprietary software CODA[76]. The CODA software name comes from CEBAF Online Data Acquisition system, where CEBAF stands for Continuous Electron Beam Accelerator Facility. The CODA scalers could be read in real time and were used as diagnostic tools during the run. The 16-channel fast amplifier used in this work, a CAEN N568B, output signals with the same polarity as the input unlike most TFAs which invert the polarity. Since the CFDs required negative amplitude signals, an inverter and fan-out module was used to flip the TFA signals.
Figure 5.11: DAQ logic diagram.
time. The Wavedump software only supported triggering on a user-set threshold, which led to problems when the baseline shifted in the preamplifier output because of the long pulse decay times. To remedy this problem the digitizer was triggered by an an external trigger. The external trigger was generated by taking the outputs of the TFA in the CODA DAQ for the 15 preamplifier channels and sending them through another CFD with a lower threshold intentionally set to include both real neutron-capture events and backgroundγ-ray Compton scatter events (see section 6.3.1 for more details).
5.7 Targets
The present experiment used two isotopes for the investigation of the fission process. The238U target was composed of 8 disks with thicknesses ranging from 0.55 mm to 0.81 mm (detailed in Table 5.1) with a total thickness of 5.06 mm and mass of 53.67 g.
![Figure 2.6: Calculated fission barriers for isotopes of uranium calculated with a self-consistent model[28].](https://thumb-us.123doks.com/thumbv2/123dok_us/8312781.2201852/29.918.247.675.390.725/figure-calculated-fission-barriers-isotopes-uranium-calculated-consistent.webp)

![Figure 3.9: The number of neutrons emitted by a fission fragment as a function of the fission fragment mass for 239 Pu(n th ,f)[48]](https://thumb-us.123doks.com/thumbv2/123dok_us/8312781.2201852/45.918.221.697.539.915/figure-neutrons-emitted-fission-fragment-function-fission-fragment.webp)
![Figure 4.1: 232 Th(γ,f) reaction cross section over the GDR[58]. The present work measures the region below 6 MeV.](https://thumb-us.123doks.com/thumbv2/123dok_us/8312781.2201852/47.918.223.686.713.1012/figure-reaction-cross-section-gdr-present-measures-region.webp)
![Figure 4.4: 238 U(γ,f) reaction cross section over the GDR[58]. The present work will measure the region below 6 MeV.](https://thumb-us.123doks.com/thumbv2/123dok_us/8312781.2201852/51.918.224.690.116.407/figure-reaction-cross-section-gdr-present-measure-region.webp)
![Figure 4.8: Neutron polarization asymmetries measured by Mueller et al.[14]. Error bars correspond to statistical uncertainties.](https://thumb-us.123doks.com/thumbv2/123dok_us/8312781.2201852/56.918.228.701.128.410/neutron-polarization-asymmetries-measured-mueller-correspond-statistical-uncertainties.webp)