Effects of Transparency Marketing on Firms’ Ability to Create and Capture Value
Sidarth Iyer
An honors thesis submitted to the faculty of the Kenan-Flagler Business School at the University of North Carolina at Chapel Hill
Chapel Hill 2018
Approved by________________________
Approved by________________________
ABSTRACT Sidarth Iyer
Effects of Transparency Marketing on Firms’ Ability to Create and Capture Value
(Under the direction of Dr. Kristin Wilson)
Transparency marketing is the act of including intentionally shared information in the value proposition of a good or service. Business research is incomplete in demonstrating how transparency marketing strengthens firms’ ability to create and capture value. Despite the success of companies like Patagonia and Everlane, transparency marketing is a relatively new phenomenon. Supported by previous academic literature, this research hypothesizes that when firms use transparency marketing strategically, they can indirectly create and capture additional value by influencing consumer cognitive processes. These cognitive mechanisms are trust perceptions of a firm and its products and psychological closeness between consumers and a firm. To validate this hypothesis, this research utilizes a mixed methodology including a quantitative consumer survey experiment and qualitative firm manager interviews. Thus, this research finds evidence from both the receiving and sending perspectives of transparency marketing of an
ACKNOWLEDGEMENTS
This research would not have been possible without several key individuals. Thank you.
Dr. Kristin Wilson – Thank you for your endless guidance, knowledge, and support. I am forever grateful for your belief in me throughout this project.
Dr. Shimul Melwani – Thank you for engaging with my research and providing
invaluable expertise during my first foray into the world of consumer behavior. Dr. Robin Cunningham – From your statistics lectures to serving on my committee,
thank you for your investment in me as a student these past few years. Dr. Patricia Harms – Thank you for teaching a short-spoken Midwesterner with a
tendency for passive voice how to write a capstone research paper.
Frances Cayton, Andrew Clark, and Annie Simpson – Thank you for serving as my conscripted editors and graphic designer respectively. See y’all on Sunday. My Parents – Thank you for providing me the opportunity to attend the University of
TABLE OF CONTENTS
ABSTRACT ... ii
LIST OF TABLES ... vii
LIST OF FIGURES ... viii
I. INTRODUCTION ...1
II. LITERATURE REVIEW ...5
A. The Strategy of Transparency Marketing ...5
B. Asymmetric Information, Signaling, and Transparency Marketing ...8
C. Potential Value Creation Mechanisms Resulting from Transparency ...9
1. Trust Perceptions ...9
2. Psychological Closeness ...13
D. Summary of Existing Research ...16
E. Statement of Hypotheses...17
III. THE RISE OF THE SPECIALTY COFFEE INDUSTRY...18
A. Historical Narrative ...19
B. Single-Origin Coffees compared to Blends ...21
C. Transparency Marketing on Specialty Coffee Bags ...22
D. Summary ...24
1. Objective ...25
2. Hypotheses ...26
3. Participants ...26
4. Procedure ...27
B. Study 2: Manager Interviews at Counter Culture Coffee ...27
1. Objective ...27
2. Firm Overview ...28
3. Interviews ...28
4. Questions...28
V. RESEARCH FINDINGS ...30
A. Study 1: Transparency Marketing Coffee Bag Experiment ...30
1. Hypotheses ...30
2. Measures ...30
3. Findings...30
B. Study 2: Manager Interviews at Counter Culture Coffee ...37
1. Overview ...37
2. Summarized Findings ...37
VI. CONCLUSION ...40
A. Limitations of Methodology ...40
B. Discussion of Findings ...42
C. Opportunities for Future Research ...44
VII. APPENDIX
A. High Transparency Marketing Condition ...48
B. Medium-High Transparency Marketing Condition ...49
C. Low-Medium Transparency Marketing Condition ...50
D. Low Transparency Marketing Condition ...51
E. Counter Culture Coffee Roasting Facilities, Durham, NC ...52
F. Coffee Cupping Demonstration ...53
G. Coffee Flavor Wheel ...54
H. Daily Coffee Production Plan ...55
I. Coffee Roasting Machines ...56
J. Quality Check Station ...57
LIST OF TABLES
Table 1: Correlations between the Independent, Mediator, and Dependent Variables Respectively ...32 Table 2: ANOVA Test between Four Transparency Marketing Conditions ...32 Table 3: Contrast Tests: High Transparency Marketing vs. Low, Low-Medium, and
Medium-High ...33 Table 4: Regression Models: Relationship between Transparency Marketing and
LIST OF FIGURES
INTRODUCTION
Money is on the table for firms willing to provide additional information on strategic and operational decisions to consumers. Some firms have adopted a new positioning strategy utilizing transparent information disclosure in marketing to capture increased value from consumers. However, it is not clear why consumers are willing to pay more for additional information. Perhaps iPhone wielding, Whole Foods shopping millennials just have an affinity for the branding of transparency. This simplistic explanation fails to consider the significant economic hurdles transparency marketing appears to overcome.
All businesses face a trade-off between the costs of operations and prices to consumers. Transparency marketing necessitates that firms have information worth being transparent about. For firm operations to be “clean” and “responsible” enough to
communicate to consumers, firms have to charge higher prices to recuperate the higher costs of operations. Therefore, for transparency marketing to be successful, some
From another perspective, the transparency marketing capabilities question has already been answered by the prolonged existence of companies such as Patagonia and Everlane. Both in the apparel industry, Patagonia and Everlane readily share with consumers the exact factories where items of clothing are made and supporting information on ethicality. Each has their own take on what transparent information is relevant in marketing materials. Everlane provides costs of production neatly separated into categories such as labor, materials, and transportation. An outdoor company with an environmental mission, Patagonia communicates the environmental footprint of pieces of
clothing down to the level of each input’s effects on nature. Despite the success of these
companies, transparency marketing is still a relatively new and not fully understood practice.
For the purposes of this paper, I use the definition of transparency as “the
perceived quality of intentionally shared information from a sender to a receiver”
(Schnackenberg & Tomlinson, 2014). In business, these “senders” are firms, while the
“receivers” are consumers. With this understanding, transparency can include providing additional communication and accountability, above the norm of what is necessary for a consumer to receive for a business interaction to occur. Within the context of business, transparency can be imbued into any stage of the value creation process, also known as the value chain.
Academics and business practitioners alike demonstrate interest in understanding and implementing the benefits of transparency within stages of the value chain. This is exemplified in firms that leverage shared point of sales data in their inbound logistics to reduce the effects of demand volatility on supply, thus creating value by securing the stability of operations. A recent interest to both academics and business practitioners is the potential to create and ultimately capture value through transparency at the end of the value chain, during the selling of a final good or service to consumers. In this paper, the act of including transparency as part of the value proposition of a good or service is referred to as “transparency marketing.”
Rather than waiting on legal action from regulatory bodies, other companies soon joined the trend of choosing to divulge information. Since then, some firms have integrated transparency into their core strategy. Noting public support, these firms have repurposed transparency to consumers from an accountability measure to a marketing tool.
Existing business research does not fully explain how transparency marketing
strengthens firms’ ability to create and capture value. Some studies have concluded that this marketing tactic enhances willingness to pay and willingness to buy (Mohan, Buell, & John, 2017; Morwitz, Greenleaf, & Johnson, 1997). However, the question of why consumers even respond to transparency marketing, much less with willingness to pay and willingness to buy, is less understood.
I posit that transparency marketing indirectly strengthens firms’ ability to create and capture value by heightening trust perceptions of firms and their products and increasing psychological closeness between firms and consumers. Trust perceptions and psychological closeness are identified in previous research and highlighted in my
literature review as potential value creation mechanisms resulting from transparency. To test the significance of my assertion, I study the usage and effects of transparency marketing in the specialty coffee industry. I specifically chose the specialty coffee industry because of its emphasis on transparency marketing as a means of differentiation from the commodity market, as this demonstrates a strategic use of transparency. The results of my research assess value created from consumer perspective metrics,
LITERATURE REVIEW
The Strategy of Transparency Marketing
Transparency marketing has a strong theoretical justification as a strategic
decision in business. By using transparency marketing, firms can differentiate their value propositions by communicating specific strategic and operational choices. Michael Porter and Milton Friedman, two prominent academics from Harvard University and the
University of Chicago respectively, provide different rationales on the usage of transparency marketing as part of firms’ strategy.
A respected scholar of competitive strategy, Porter theorized that a link exists between competitive advantage and core strategy-related uses of social responsibility. Porter (2013) argued that the creation of value may occur when businesses solve social problems. Holding that business participation encourages solutions to grow through
competition for profits, Porter’s argument allows for businesses to seek socially-driven value. By incorporating a social dimension, firms can create a competitive advantage that provides value chain benefits such as lower costs or access to niche consumer markets. In
turn, these strategic changes can contribute to a firm’s increased ability to create value.
historically engaged in social responsibility for four reasons: general sustainability, moral obligation, goodwill, and reputation. As all four of these reasons place business at odds with society, firms view and conduct social responsibility responsively instead of strategically. In treating social responsibility strategically, firms would focus on the issues that matter most to their core strategy and provide the highest likelihood of impact on their consumers.
Porter would say that if transparency marketing allows firms to create economic opportunities by responsibly solving firm-relevant social problems in exchange for profits, then it is a good strategic decision. Creative managers can reflect on their core strategy to differentiate their value chain in a way that benefits both society and shareholders. Throughout his work, Porter holds that competitive advantage, and therefore value, can be created by aligning social responsibility initiatives such as transparency marketing with the core strategy of the firm.
Many economists doubt the effectiveness of corporate social responsibility strategies for profit creation. Friedman, A Nobel prize winning economist, believed that the sole responsibility of businesses to society was to pursue profits for shareholders. In his landmark work Capitalism and Freedom, Friedman (1962) wrote that “in a free economy there is one and only one social responsibility of a business – to use its
resources to engage in activities designed to increase its profits so long as it stays within
These same economists think business strategy is not an effective means to solve social problems. Friedman argued that the framework of law was more effective than public persuasion at managing externalities and social responsibilities. Friedman wrote
“it is the responsibility of the rest of us to establish a framework of law such that an
individual in pursuing his own interest is, to quote Adam Smith again, ‘led by an
invisible hand to promote an end which has no part of his intention’” (p. 133). In
response to calls for businesses to include social responsibility in their value propositions, Friedman wrote that “if businessmen do have a social responsibility other than making maximum profits for stockholders, how are they to know what it is? Can self-selected private individuals decide what the social interest is?” (p. 113). This quote suggests that
businesses are not a qualified forum to determine the public’s social interest. In
examining Friedman’s discussion of social responsibility, the economist maintains that it is inefficient and unproductive for firms to arbitrarily take on social responsibilities as part of their value proposition.
Despite Friedman’s strong opposition of general corporate social responsibility, he would still see value in transparency marketing. As demonstrated by his foremost principle that a firm’s only responsibility is profitability for its shareholders, Friedman likely would not care how firms go about being profitable. While he might view
transparency marketing as “window dressing” and perpetuating expectations of social responsibility on managers, Friedman would not condemn transparency marketing if it allowed firms to profit.
Both Porter and Friedman would support transparency marketing if it
by marketing strategic and operational choices to certain consumer segments in exchange for profits. Additional economic theory suggests that transparency of information is the bridge between marketing firm choices and consumer willingness to pay.
Asymmetric Information, Signaling, and Transparency Marketing
There is a strong theoretical relationship between transparency and willingness to pay. Even if consumers interested in corporate social responsibility have preferences about firm choices, they are not able to actually verify these choices themselves, creating an information gap. In his Nobel prize winning paper, The Market for Lemons, George Akerlof (1970) stated that high quality goods can never be produced when consumers lack information. High quality goods require a costly investment beyond what is expected in the market. When there is an information asymmetry between firms and consumers, consumers distrust the validity of the investment and are unwilling to pay higher prices for high quality goods.
Firms can fill this information gap through either costly signaling or cheap talk. In economics and specifically game theory, costly signaling refers to when actors are
willing to pay to convey information. In a sense, costly signaling is akin to “putting your
money where your mouth is”. Likewise, cheap talk refers to communication that is
investing in higher quality products is a worthwhile decision. Therefore, to discern how transparency marketing can affect value creation abilities, it is important to understand how consumers cognitively process transparency marketing.
Potential Value Creation Mechanisms Resulting from Transparency
Despite pessimism from some economists about consumers’ belief of
transparency marketing, a significant body of research from other social sciences suggests a connection between transparency and cognitive processes such as trust perceptions and psychological closeness. Particularly within behavioral psychology, communications, and related fields, research focuses on self-disclosure in relationships between two parties. Given that business is a relationship between firms and consumers, relevant findings are applicable when evaluating uses of transparency, a form of self-disclosure, in business. Furthermore, studies specific to business investigating consumer behavior have found linkages to changes in cognitive processes and measures of value creation and capture such willingness to pay and willingness to buy.
Trust Perceptions
The most studied cognitive process related to self-disclosure is trust due to
positive perceptions, or trust perceptions. In business, trust perceptions can be of products or the firm itself.
Product Perceptions
pricing. For example, a business could choose to tell a consumer independently or in some combination how it created a product, how much it cost to produce a product, and how the price of a product was specifically determined. Research demonstrates that transparent communication on various facets of products affects how consumers trust and
perceive the product’s value. Ryan Buell and Michael Norton (2011), professors at
Harvard Business School, found in a study involving reactions to online travel sites that operational transparency increases consumer trust in quality. Similarly, Buell and other researchers at Harvard found that cost transparency boosts purchase interest, perceptions of effort required for production, and trust in the product (Mohan, Buell, & John, 2017). Across these studies, it is evident that businesses are able to influence consumer trust perceptions of a product by disclosing additional information relevant to the product. Other studies connect influences in product trust perception to value creation. Hikaru Peterson and Kentaru Yoshida (2004), agricultural economists at Kansas State University and the University of Tsukuba respectively, found that higher trust perceptions in the quality of domestic rice lead to higher willingness to pay compared to foreign rice. Justin Beneke, Ryan Flynn, Tamsin Greig, and Melissa Mukaiwa (2013), management researchers from the University of Cape Town in South Africa, determined that
Firm Perceptions
Businesses innately require a relationship of trust between firms and consumers. Trust would refer to the reduction of consumer uncertainty surrounding an exchange for goods and services from a firm. Since the 1970s, there has been consensus among
communications and psychology academics that there is a link between self-disclosure in relationships and trust perceptions (Cozby, 1973; Pearce & Sharp, 1973). A landmark study by Lawrence Wheeless and Janis Grotz (1977), professors of communications at West Virginia University, suggested that this relationship is linear in nature.
Subsequent research has focused on assessing what factors affect the degree by which trust perceptions and self-disclosure influence one another in relationships. Persistent, long-term self-disclosure between partners increased mutual feelings of trust in a study of intimate relationships (Sprecher & Hendrick, 2004). This increase in trust was especially significant during the disclosure of sensitive information. Bob Fennis and Wolfgang Stroebe (2014), professors of consumer behavior and social psychology in the Netherlands, determined that firms which voluntarily self-disclose negative information about their practices are still regarded as more trustworthy by consumers than if outside sources reported this information. Across these studies, it is noticeable that
self-disclosure impacts perceptions of trust in relationships. In considering the relationship between businesses and consumers, it is important to consider how heightened consumer trust perceptions could benefit firms.
Researchers corroborated that there is a causal relationship between trust
agricultural economists from universities in the United Kingdom, examined the unveiling of higher farm animal welfare standards in five European Union countries. Nocella, Hubbard, and Scarpa noted that consumer willingness to pay mirrored the rise in
consumer perceived trust in the standards. In an analysis of Spanish manufacturing firms and their buyers, economists determined that trust and long-term commitment are related to consumer perceptions of value creation in a business relationship (Sánchez, Vijande, & Gutiérrez, 2010). While each of these studies focuses on unique and specific cases, it is clear that consumer trust perceptions can have long-term impacts on relationships with firms. Consumers who trust a firm are more likely to engage with the firm in longevity and support the firm with willingness to purchase and pay.
Trust Perceptions as a Singular Mechanism
Psychological Closeness
In the setting of business, psychological closeness refers to perceived heightened connectedness between consumers and a firm. This perceived closeness can occur either spatially or emotionally.
Spatial Closeness
Spatial closeness refers to limited perceived distance between a person and something beyond their understood reality, defined as spatial distance (Trope &
Liberman, 2003). In layman’s terms, spatial distance is the distance we perceive between ourselves and specific events, entities, and thoughts outside of our time, geography, and lived experiences. We perceive this distance by constructing abstract imaginary objects, partially or wholly unfamiliar to us, in our minds. A widely-regarded breakthrough in the psychology community, Construal Level Theory suggests that the more context and information an individual has about an abstract object, the less spatially distant it is (Trope & Liberman, 2010). In the setting of business, this spatial distance could refer to a
consumer’s perceived distance to a firm and its activities. In examining the role of spatial closeness in consumer perception, we can better understand the role that transparency marketing can play in decreasing spatial distance.
Limited research has investigated how the concept of spatial distance applies to business, demonstrating that reducing spatial distance can create value. In an
investigation focused on the service industry, management, sociology, and economics researchers found that deconstructing barriers that separate customers from restaurant servers, particularly spatially and socially, increased customers’ perceived value of the
customers to feel more linked to the actual service rendered (Holmqvist, Guest, & Grönroos, 2015). Overall, there is evidence that feelings of spatial closeness to firms and their activities positively affect the value consumers derive from exchanges with firms. Emotional Closeness
Emotional closeness is a form of psychological closeness in which consumers perceive shared principles or beliefs with the firms they support. Emotional closeness necessitates that firms communicate, or transparently disclose, their mission and values to consumers. A study found that, when compared to no communication, conveying values through social responsibility initiatives has a strong effect on perceived emotional closeness, reduction of negative responses, and increase of positive responses to a firm (Joireman, Smith, Liu, & Arthurs, 2015). Emotional closeness is often documented with
firms that are involved in corporate social responsibility, such as Ben and Jerry’s and
Patagonia. Research confirms that a sizable population of socially conscious consumers consider their personal values and beliefs when making purchasing decisions (Pepper, Jackson, & Uzzell, 2009). These consumers are particularly notable in the environmental arena, though also present elsewhere. Sankar Sen and C.B. Bhattacharya (2003), business professors at Baruch College and the European School of Management and Technology respectively, theorized that consumers who identify with a firm emotionally are more likely to be loyal to the firm, promote the firm to others, and ignore negative information surrounding the firm. Overall, research demonstrates that emotional closeness created by transparency can be a powerful tool for lengthening and strengthening consumer
Additional studies support a relationship between emotional closeness and value creation. Lois Mohr and Deborah Webb (2005), professors at Georgia State University and the University of West Georgia, directly tested Sen and Bhattacharya’s theory on a
fictional shoe company and found that emotionally close respondents displayed
additional willingness to buy. Matthew Thomson, Deborah MacInnis and C. Whan Park
(2005), business professors at Queen’s University and the University of Southern
California, showed that emotional closeness contributes to consumer loyalty and
willingness to pay premium prices. Thomson, MacInnis, and Park conducted their study by gauging the prices participants were willing to pay for self-selected brands they felt emotionally close to against the average price of the industry. Yatish Joshi and Zillur Rahman (2015), management professors at the Indian Institute of Technology Roorkee, extensively reviewed existing articles on green purchasing behavior, indicative of emotional closeness concerning the environment, to test if studies arrived at similar conclusions. In their research, Joshi and Rahman found that existing concern for the environment is a significant and commonly-identified determinant as to whether consumers are willing to buy environmentally conscious products. With this, it is reasonable that when presented the opportunity, socially conscious consumers are more likely to purchase from firms that are engaged in emotionally close social responsibility initiatives.
Psychological Closeness as a Singular Mechanism
social decision making, indicators of emotional closeness. R.G. Adams (1986), a gerontologist at the University of North Carolina at Greensboro, found in a study of retirement homes that elderly people perceive less spatial distance between one another when emotionally close. These studies exemplify how spatial closeness and emotional closeness are psychologically related and influence each other. Therefore, both are captured in the single mechanism of psychological closeness.
Summary of Existing Research
Given the relative newness of the practice of transparency marketing, focused literature on the subject is quite limited. Theoretical perspectives from strategists and economists justify marketing strategic and operational choices to consumers in exchange for profits. In this situation, transparency resolves an asymmetric information problem by allowing consumers to verify their preferences on firm choices. While pessimistic
Statement of Hypotheses
Through my research, I aim to determine how transparency marketing creates value in the eyes of consumers by studying the presence of both mechanisms
simultaneously. This thesis will examine the effects of transparency marketing on consumer perceptions in the specialty coffee industry through the following hypotheses:
H1: Transparency marketing is positively associated with consumers’ willingness
to buy.
H2: Trust perceptions mediate the positive association between transparency
marketing and willingness to buy.
H3: Psychological closeness mediates the positive association between
transparency marketing and willingness to buy.
Overall, I posit that transparency marketing heightens trust perceptions of firms and their products and increases psychological closeness between firms and consumers, which in turn indirectly strengthens firms’ ability to create and capture value. This assertion is purely based on postulating after reading existing academic literature. By testing these three specific hypotheses, I aim to verify if my proposed relationship between
THE RISE OF THE SPECIALTY COFFEE INDUSTRY
Since the dawn of the third wave of coffee in the early 2000s, specialty coffee has grown into a booming global industry. In just the United States, the retail value of
specialty coffee is approximately $26 billion dollars per year (SCAA, 2015). A niche industry within a commodity market, specialty coffee differentiates itself by using direct-to-farm beans sourced from individual farmers, producers, and cooperatives. By
emphasizing quality and experience, specialty coffee roasters are able to command exceptional prices for their products while paying above commodity market rates to their farmers (SCAA, 2015).
Along with increased quality, the value proposition of individual beans includes
Historical Narrative
Deciphering the historical narrative surrounding specialty coffee provides
insightful background on how transparency marketing became a strategic decision within the industry. In general, coffee connoisseurs' historical sketch of coffee can be divided into three waves, of which specialty coffee comprises the third, and latest, trend in coffee. While the three waves of coffee occurred chronologically, firms emblematic of each wave and their characteristics still exist today.
Jonathan Gold (2008), a reporter for the LA Weekly, described the first wave of
American coffee culture as “the 19th-century surge that put Folgers on every table.” This first period commodified coffee into an available and affordable beverage for all
Americans. As a commodity, consumers were not aware of the origins or additional details surrounding the coffees they drank. The key form of differentiating between types of coffee was determined by comparing the differences between brands of coffee, rather than assessing differences in the origins of beans.
The second wave of coffee began when more coffee drinkers emerged, and coffee became more commonplace. This second wave was composed of businesses that focused on the coffee shop experience, improving beverage preparation techniques, and
second wave of coffee is notable for making coffee culture more pervasive and experiential for the general consumer.
The third wave of coffee, specialty coffee, created a segment of the market that values authenticity of coffee beans and derives quality from the nature of the coffee itself. Authenticity, in third wave coffee, refers to communicating the origin and the farmer of each bean. According to Gold, the third wave of coffee is “where beans are sourced from farms instead of countries, roasting is about bringing out rather than incinerating the unique characteristics of each bean, and the flavor is clean and hard and pure” (Gold, 2008). In third wave coffee, the relationship between roaster and farmer plays a more significant role (Samper, Giovannuci, & Vieira, 2017).
By focusing on the roaster-farmer relationship, conditions for continued cooperation are created. Roasters are incentivized to maintain and invest in individual farmers who consistently yield high quality crops. By including farmers in the marketing materials of coffees and paying them above commodity market prices, farmers are incentivized to continue to grow coffee for specialty coffee roasters. Additionally, more direct contact between roasters and farmers leads to increased opportunities for product innovation when formulating a new coffee. Generally, specialty coffees are sold at higher prices to consumers than other coffees. This third wave of coffee is the first in which origins of a coffee and the farmers behind a coffee are used as methods of differentiation.
In short, Gold’s three waves of coffee outline a transition in the coffee industry’s
flexibility when sourcing. By choosing to invest in the roaster-farmer relationship, third wave, specialty coffee roasters are able to leverage transparency marketing in a manner consistent with their core strategy.
Single-Origin Coffees compared to Blends
Specialty coffee beans are sold either on their own as single-origin coffees or are combined in ratios to create a blend. Single-origin beans typically have higher cupping scores and stronger individual flavor profiles in the eyes of roasters (“Coffee Basics:
Single-Origin Coffee,” 2017). Cupping scores are a method used by roasters to gauge the quality of coffees. Additionally, roasters claim to generally pay more for single-origin beans. Because of this, roasters price single-origin coffees higher than blends (SCAA, 2015). For beans sourced in 2015, Counter Culture Coffee, a Durham-based third wave specialty coffee roaster, noted paying $3.52 per pound for single-origin coffees on average, compared to $3.16 per pound for all coffees. At the time, the commodity market price for coffee was $1.66 per pound.
In comparison, blends allow a roaster to find a combination that accentuates the strengths of each comprising bean. Due to seasonality limitations when sourcing from an individual farmer, blends are available year-round while single-origins appear
periodically (“Coffee Basics: Seasonality,” 2017). Both single-origin coffees and blends are available through wholesale and retail channels. However, wholesale consumers who prefer consistency, such as restaurants and cafes, tend to purchase blends while
a coffee’s quality is broadcasted across specialty coffee offerings, the emphasis on the farmer and origin in marketing materials is mostly limited to single-origin coffees.
Transparency Marketing on Specialty Coffee Bags
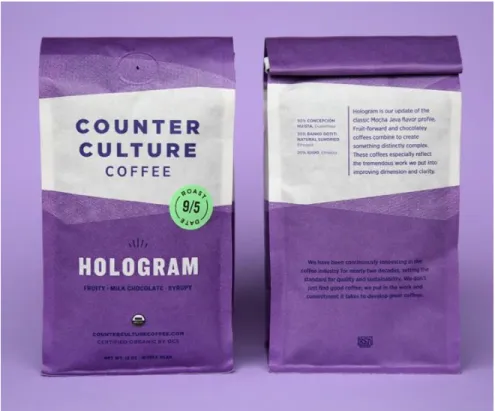
Figure 1 is representative of the level of transparency marketing involved with single-origin coffees. Highlighted prominently in green on the front of the bag are the farm and the origin of the coffee, along with taste descriptors and other quality indicators. On the
back of the bag, the top paragraph describes the roaster’s commitment to quality and
ethicality. The bottom paragraph describes the story of the farmer, located in Guatemala.
Figure 2: Example coffee blend bag, featuring limited transparency marketing
Figure 2 is an example of the level of transparency marketing involved with blend
coffees. On the front of the bag are the name of the blend along with taste descriptors. On the back of the bag, the top left side corner lists the producing farms. The top paragraph
describes the blend in further detail. The bottom paragraph describes the roaster’s
It is interesting that, despite having information on the origins and farmers of beans that go into blends, roasters choose not to disclose this information prominently in the transparency marketing of blends. Though outside of the scope of this paper, I suspect that the transparency marketing used for single-origin coffees strengthens consumer valuations of the overall brand, thus bolstering perceptions of blends by association. Given that blends are particularly attractive in the wholesale channel, perhaps these consumers care less about origin and farmer than they do brand. Furthermore, by not communicating the specific beans that go into blends to consumers in an eye-catching manner, roasters demonstrate that they are able to afford themselves some flexibility when sourcing. This sourcing strategy would be similar to that utilized by first and second wave coffee businesses. Though reasons for varying levels of transparency marketing are unclear, both single-origin and blend coffees utilize some amount of transparency marketing.
Summary
The specialty coffee industry is worthy of research to more broadly understand
how transparency marketing can strengthen firms’ ability to create and capture value.
RESEARCH METHODOLOGY
To investigate my research question on how transparency marketing strengthens
firms’ ability to create and capture value, I utilized a mixed methodology comprising of a quantitative consumer survey experiment and qualitative firm manager interviews. I selected this method as I wanted to find insights from both the receiving and sending perspectives of transparency marketing. The purpose of the quantitative experiment was to investigate the occurrence and effects of trust perceptions and psychological closeness on willingness to buy by manipulating levels of transparency marketing. As discussed in my literature review, these two cognitive processes are identified by previous research as resulting from transparency and mechanisms for value creation. The purpose of my firm manager interviews was to better understand the strategic motivations as to why specialty coffee roasters choose to engage in transparency marketing. While some academic circles frown on mixed methodologies over concerns of feasibility, other researchers have found a holistic approach to research insightful (Mingers & Brocklesby, 1997).
Study 1: Transparency Marketing Coffee Bag Experiment
Objective
Hypotheses
H1: Transparency marketing is positively associated with consumers’ willingness
to buy.
H2: Trust perceptions mediate the positive association between transparency
marketing and willingness to buy.
H3: Psychological closeness mediates the positive association between
transparency marketing and willingness to buy. Participants
Participants were 158 Amazon Mechanical Turk (MTurk) users who completed a survey in exchange for $0.20. These participants self-identified as coffee drinkers. I excluded 10 participants from the analysis for either failing a quality check, pressing the same response option for all questions, or stating that they did not drink coffee. This left a final sample of 148 participants. 52% identified as male and the other 48% identified as female. The mean age of participants was 37, with a standard deviation of 12.
Procedure
Apart from three demographic questions and three quality check questions, I asked participants a total of eight questions for analysis. Participants used a 7-point scale (1 = strongly disagree, 7 = strongly agree) to answer each question. Each participant was displayed an image of a coffee bag corresponding to the condition they had been
assigned. I then asked the eight analysis questions to gauge trust perceptions, psychological closeness, and willingness to buy. The questions relevant to trust
perceptions were “I trust this coffee”,“This coffee will have good taste”, “This coffee is expensive to produce”, and “This coffee is of high quality.” The questions relevant to psychological closeness were “I feel connected tothe grower of this coffee”, “I feel close
to the grower of this coffee”, and “I feel like I am supporting the grower of this coffee.” I reviewed observations from previous related research to frame these seven questions in a way that they capture trust perceptions and psychological closeness (Mohan, Buell, & John, 2017; Holmqvist, Guest, & Grönroos, 2015). Lastly, I asked one question measuring the dependent variable willingness to buy, “I would be willing to buy this
particular coffee.”
Study 2: Manager Interviews at Counter Culture Coffee
Objective
Firm Overview
Counter Culture Coffee is a specialty coffee roaster located in Durham, North Carolina. One of the big four specialty coffee roasters, Counter Culture was a logical choice for conducting interviews given their proximity to the University of North Carolina and leadership in transparency marketing. Counter Culture was the first specialty coffee roaster to publish transparency reports to consumers. Additionally, transparency marketing appears to some degree in almost all of Counter Culture’s product offerings.
Interviews
I conducted interviews with Penelope Hearne, Meredith Taylor, and Jesse Gordon. Penelope, Meredith, and Jesse are respectively the eCommerce Manager, Sustainability Manager, and Customer Service Leader at Counter Culture.
Questions
I asked the following questions to get a better understanding of Counter Culture Coffee’s
business and the role of transparency marketing in their firm strategy. General Business
1. What consumer segments buy Counter Culture? Why?
2. How does Counter Culture differentiate itself from other roasters? 3. How does Counter Culture select the specific farmers, exporters, and
importers it works with?
4. What qualities are Counter Culture looking for in a relationship with a farmer?
Transparency Marketing
1. How is Counter Culture transparent?
2. Why does Counter Culture emphasize transparency so much? 3. What is the role of transparency in marketing to consumers? 4. What are the benefits of being transparent?
5. How do consumers react in behavior to transparency marketing? Social Mission and Integrity
1. How does Counter Culture ensure participants along the supply chain
are upholding Counter Culture’s integrity and values?
2. How would you describe Counter Culture’s social mission?
RESEARCH FINDINGS
Study 1: Transparency Marketing Coffee Bag Experiment
To examine the effects of the priming conditions (low transparency marketing vs. low-medium transparency marketing vs. low-medium-high transparency marketing, vs. high transparency marketing) on willingness to buy, I conducted a one-way ANOVA test, pairwise contrast tests, linear regression modeling, and an indirect effects test.
Hypotheses
H1: Transparency marketing is positively associated with consumers’ willingness to buy.
H2: Trust perceptions mediate the positive association between transparency
marketing and willingness to buy.
H3: Psychological closeness mediates the positive association between
transparency marketing and willingness to buy. Measures
Independent Variable: Assigned Transparency Marketing Condition Mediator Variables: Trust Perceptions, Psychological Closeness Dependent Variable: Willingness to Buy
Findings
survey question variables using Cronbach’s alphas. Cronbach’s alphas are coefficients of internal consistency and reliability within a survey. Likert-type scales refer to quantitative scales of subjective questions, such as asking someone how much they like something between one and seven. The higher the Cronbach’s alpha, the more the original survey variables share covariances and likely measure the same underlying concept. The formula
for calculating Cronbach’s alpha is:
𝛼 =
𝑣̅ + (𝑁 − 1) × 𝑐̅
𝑁 × 𝑐̅
Where: N is the number of variables
𝑐̅ refers to the average of all covariances between variables
𝑣̅ refers to the average variance of each variable
Given that Cronbach’s alphas can be distorted by variables with similar lengths and
variances, their composition needs to be justified theoretically and conceptually. As mentioned in the methodology section, seven of the original survey questions were written intentionally to combine into the mediator variables by considering concepts from previous related research. Trust perceptions was formed by combining the original trust, perceived costs of production, perceived taste, and perceived quality variables.
For a simple preliminary look at the nature of possible relationships including the newly formed variables of interest, correlations were calculated and assessed.
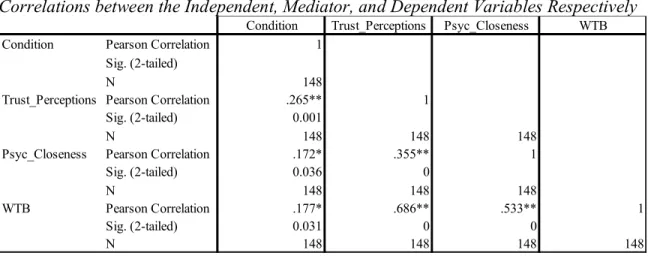
Correlations between the Independent, Mediator, and Dependent Variables Respectively
Table 1: * indicates significance at the 0.05 level (2-tailed). ** indicates significance at the 0.01 level (2-tailed).
Displayed in Table 1, these correlations were positive and significant as expected. Next, an ANOVA analysis between the four transparency marketing conditions tested differences in group means for willingness to buy, psychological closeness, and trust perceptions.
ANOVA Test between Four Transparency Marketing Conditions
Condition Trust_Perceptions Psyc_Closeness WTB
Condition Pearson Correlation 1
Sig. (2-tailed)
N 148
Trust_Perceptions Pearson Correlation .265** 1
Sig. (2-tailed) 0.001
N 148 148 148
Psyc_Closeness Pearson Correlation .172* .355** 1
Sig. (2-tailed) 0.036 0
N 148 148 148
WTB Pearson Correlation .177* .686** .533** 1
Sig. (2-tailed) 0.031 0 0
N 148 148 148 148
Sum of Squares df Mean Square F p
WTB Between Groups 11.88 3.00 3.96 1.76 0.16
Within Groups 324.68 144.00 2.26
Total 336.56 147.00
Psyc_Closeness Between Groups 13.12 3.00 4.37 1.80 0.15
Within Groups 351.00 144.00 2.44
Total 364.12 147.00
Trust_Perceptions Between Groups 17.04 3.00 5.68 4.02 0.01**
From Table 2, only trust perceptions (p = 0.01) was found to have significantly different means between all four transparency marketing conditions. To further
investigate potential significantly different means between individual transparency marketing conditions, pairwise contrast tests were conducted.
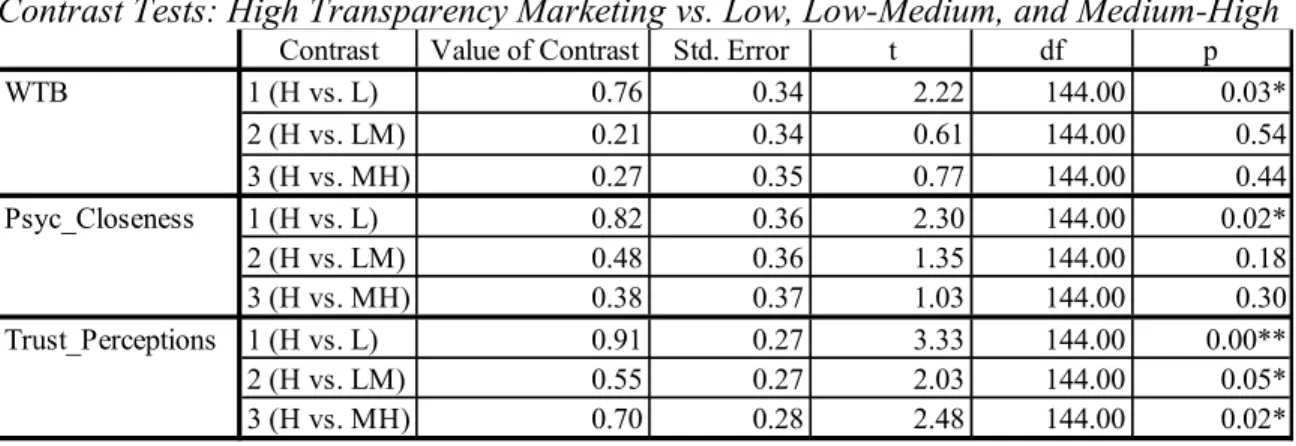
Contrast Tests: High Transparency Marketing vs. Low, Low-Medium, and Medium-High
Table 3: * indicates significance at the 0.05 level (2-tailed). ** indicates significance at the 0.01 level (2-tailed).
From Table 3, only the contrast tests between high transparency marketing and low transparency marketing had significant p values for difference in means for all three variables in the analysis. The contrast between high and low transparency marketing is evaluating the presence or absence of transparency marketing in full. It makes intuitive sense that this contrast would lead to the most significant observable differences. Thus, responses to the high and low assigned transparency marketing conditions were filtered into a new data set of 76 points. Trans_Marketing became a new binary variable, taking on a value of 1 when transparency marketing was high and 0 when transparency marketing was low. Therefore, the Trans_Marketing variable essentially indicates if transparency marketing is present or not.
Contrast Value of Contrast Std. Error t df p
WTB 1 (H vs. L) 0.76 0.34 2.22 144.00 0.03*
2 (H vs. LM) 0.21 0.34 0.61 144.00 0.54
3 (H vs. MH) 0.27 0.35 0.77 144.00 0.44
Psyc_Closeness 1 (H vs. L) 0.82 0.36 2.30 144.00 0.02*
2 (H vs. LM) 0.48 0.36 1.35 144.00 0.18
3 (H vs. MH) 0.38 0.37 1.03 144.00 0.30
Trust_Perceptions 1 (H vs. L) 0.91 0.27 3.33 144.00 0.00**
2 (H vs. LM) 0.55 0.27 2.03 144.00 0.05*
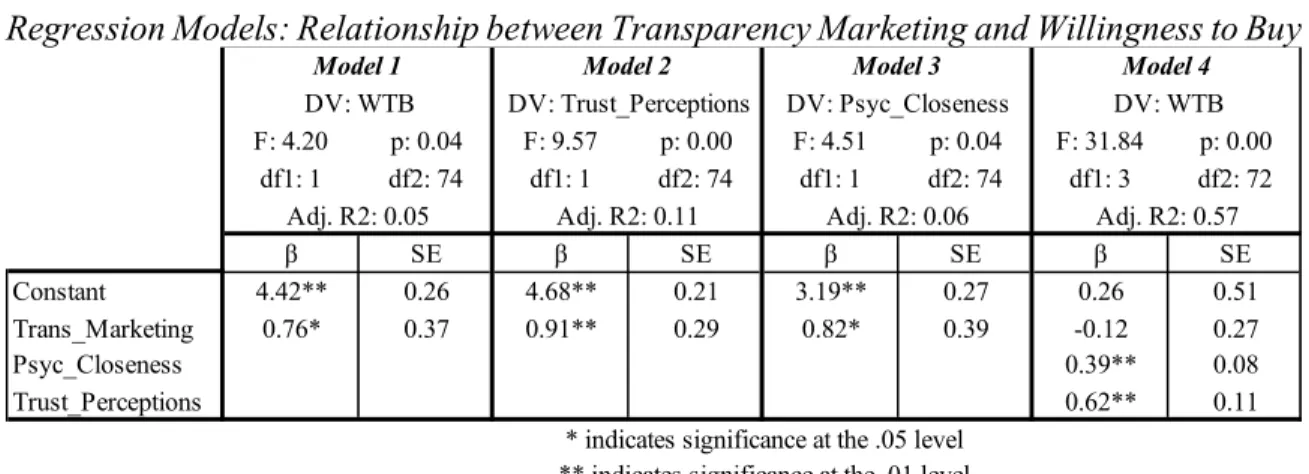
Regression Models: Relationship between Transparency Marketing and Willingness to Buy
Table 4: * indicates significance at the 0.05 level. ** indicates significance at the 0.01 level.
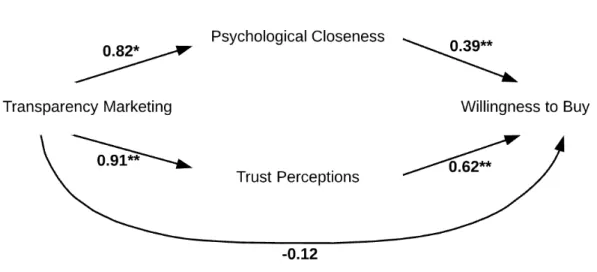
Table 4 displays the results of linear regression models conducted to better understand the specific nature of the relationship between transparency marketing and willingness to buy. Model 1 found a significant, positive association between transparency marketing and willingness to buy (β = 0.76, SE = 0.37, p = 0.04), supporting Hypothesis 1. Since evidence existed for Hypothesis 1, it was possible to then test if trust perceptions and psychological closeness mediated the positive association described in Hypothesis 1 between transparency marketing and willingness to buy. Hypothesis 2 and 3 propose that these mediations are by trust perceptions and psychological closeness respectively.
Models 2 and 3 were constructed to test the significance of the relationships between transparency marketing and the mediator variables. Model 2 found a significant, positive association between transparency marketing and trust perceptions (β = 0.91, SE = 0.29, p = 0.00). Similarly, Model 3 found a significant, positive association between transparency marketing and psychological closeness (β = 0.82, SE = 0.39, p = 0.04).
When simultaneously examining the mediator variables in a multiple regression,
F: 4.20 p: 0.04 F: 9.57 p: 0.00 F: 4.51 p: 0.04 F: 31.84 p: 0.00
df1: 1 df2: 74 df1: 1 df2: 74 df1: 1 df2: 74 df1: 3 df2: 72
β SE β SE β SE β SE
Constant 4.42** 0.26 4.68** 0.21 3.19** 0.27 0.26 0.51
Trans_Marketing 0.76* 0.37 0.91** 0.29 0.82* 0.39 -0.12 0.27
Psyc_Closeness 0.39** 0.08
Trust_Perceptions 0.62** 0.11
* indicates significance at the .05 level ** indicates significance at the .01 level
DV: WTB
Model 4
Adj. R2: 0.05 Adj. R2: 0.11 Adj. R2: 0.06 Adj. R2: 0.57
DV: WTB
Model 1 Model 2
DV: Trust_Perceptions DV: Psyc_Closeness
0.00). The direct association between transparency marketing and willingness to buy in this mediated model was found to be insignificant (β = -0.12, SE = 0.27, p = 0.65).
To verify evidence from Models 2, 3, and 4 of significant mediation between transparency marketing and willingness to buy, an indirect effects test was conducted on the mediator variables in the multiple linear regression (Model 4).
Indirect Effects between Transparency Marketing and Willingness to Buy
Table 5: Conducted on 2000 bootstrap samples
From Table 5, the indirect effects tests provided additional evidence of mediation by psychological closeness (indirect effect = 0.32, SE = 0.19, LLCI = 0.01, ULCI = 0.77) and trust perceptions (indirect effect = 0.56, SE = 0.19, LLCI = 0.23, ULCI = 0.98) in the relationship between transparency marketing and willingness to buy. Since the confidence intervals for both psychological closeness and trust perceptions are entirely positive, the indirect mediation effects of both are significant.
By drawing conclusions from the results of the linear regression models in Table 4 and indirect effects test in Table 5, both Hypothesis 2 and Hypothesis 3 are supported. There is substantial evidence of an indirect, mediated relationship between transparency marketing and willingness to buy. Psychological closeness and trust perceptions mediate this relationship. Additionally, existing academic research on transparency, psychological closeness, trust perceptions, and value creation provide a theoretical basis for causality satisfied by the significant findings of this study.
Effect Boot_SE Boot_LLCI Boot_ULCI
Total 0.89 0.27 0.40 1.45
Psyc_Closeness 0.32 0.19 0.01 0.77
Figure 3: Path model between transparency marketing and willingness to buy
Study 2: Manager Interviews at Counter Culture Coffee
Overview
I conducted interviews with Penelope Hearne, Meredith Taylor, and Jesse Gordon. Penelope, Meredith, and Jesse are respectively the eCommerce Manager, Sustainability Manager, and Customer Service Leader at Counter Culture. Interviews with Counter Culture personnel suggest that the company leverages transparency marketing to create additional willingness to pay and willingness to buy, which allows the company to pursue strategic social responsibility.
Summarized Findings
General Business Overview
Counter Culture Coffee was founded in 1995 in Durham, North Carolina. It is one of the four largest roasters in the specialty coffee industry, alongside Intelligentsia, Stumptown, and Blue Bottle. Of the four, Counter Culture remains the only one not owned by a private equity firm. Primarily focused on selling to cafes, wholesale makes
up 75% of Counter Culture’s sales. Additionally, 9% of sales come from direct-to-consumer retail and 16% come from grocery stores.
Counter Culture differentiates itself by the way it buys coffee. Unlike some
competitors who cherry pick from each year’s harvests, Counter Culture prefers to work
through long-term partnerships with farmers. Most commonly, current export and import partners refer Counter Culture to new talented farmers. When choosing to start a
Relationships with Farmers: Socially Minded Strategy
Counter Culture views its relationships with farmers as its core competitive advantage. Working directly with farmers ensures the consistency and quality of coffee beans. Unlike other specialty coffee roasters, Counter Culture prides itself on being able to offer the same high-quality coffees from specific farms regularly. A special globe-trotting team exists just to keep regular physical contact with farmers on the ground.
To promote the longevity of relationships with farmers, Counter Culture invests in its farmer partners above the norms of the industry. A basic goal is to pay above market
rates to ensure farmers’ costs of production are covered. This has historically been a problem in the larger coffee industry, as intermediary supply chain partners can easily withhold payment from small farmers. As one of the largest specialty coffee roasters in the world, Counter Culture uses its buying power with exporters to try and ensure farmers get a fair cut.
Furthermore, Counter Culture maintains a grant program called Seeds. Seeds is used to provide grants to farmers and their communities for social and environmental sustainability projects. Counter Culture believes that investments do not have to necessarily be coffee related, and that enriching farmer communities will ultimately enrich their business. For example, Counter Culture bought macadamia trees for a producer in Kenya so that they could have a crop to sell in the coffee off-season.
is to hope that farmers will value their relationship with Counter Culture over short term gains from other roasters.
Usage of Transparency Marketing
Counter Culture fully acknowledges that transparency marketing is part of its firm strategy. An industry leader in transparency, Counter Culture was the first to publish detailed transparency reports to consumers. In addition to transparency marketing targeted at retail consumers, Counter Culture provides resources for its wholesale buyers to leverage transparency marketing in their individual operations. For example, Counter Culture has a complimentary service that trains cafes’ baristas on how to convey the story
and origin of coffees. Ultimately, Counter Culture believes utilizing transparency
marketing to engage end consumers is paramount to the success of both its wholesale and retail channels.
According to managers, Counter Culture’s consumers belong to three categories:
ethicality, quality, and lifestyle. Ethicality consumers purchase Counter Culture because they feel they are supporting coffee farmers by paying more. Quality consumers purchase Counter Culture because they perceive higher quality when drinking direct-sourced coffees. Lifestyle consumers purchase Counter Culture because they enjoy the image and status of the brand. All three of these consumer segments depend on transparency
CONCLUSION
Limitations of Methodology
As a student researcher, I made do with the tools and methods available at my disposal. While I made a concerted effort to keep my methodology as general and applicable to business-at-large as possible, I faced multiple limitations that should be addressed.
Study 1: Transparency Marketing Coffee Bag Experiment
A secondary limitation is the nature of surveys themselves. Surveys are
susceptible to inattention and bias. I tried to alleviate the effects of inattention and bias to the best of my ability by implementing measures such as quality check questions and separating questions to prevent anchoring. That being said, this risk of inattention and
bias must still be acknowledged.
Study 2: Manager Interviews at Counter Culture Coffee
The interviews that I conducted are also subject to bias. As an interviewer, I may have intentionally or unintentionally solicited certain responses to questions.
Additionally, my interview subjects may have presented responses that were socially desirable or inoffensive instead of honest. This may especially be the case, as my
interview subjects were discussing their own company’s work and may want to portray
their company in a positive light. Furthermore, my limited training as an interviewer hindered my ability to perfectly transcribe all responses. Nevertheless, despite limitations, I conducted these interviews objectively to the best of my abilities.
I choose to investigate Counter Culture Coffee because of proximity and
demonstrated usage of transparency marketing. Aggregating interviews with other firms could provide a more comprehensive case study of the specialty coffee industry.
Discussion of Findings
By surveying consumers and interviewing firm managers, my mixed methodology sought to find insights from both the receiving and sending perspectives of transparency marketing. Through interviewing managers from Counter Culture Coffee, I learned about the stated aim and techniques of transparency marketing in the specialty coffee industry. In my experiment, I surveyed the opinions and responses of consumers to those exact techniques of transparency marketing. By comparing the findings of both methods, I am able to judge if transparency marketing is an effective strategy in an industry noted for this practice.
In my quantitative experiment, I manipulated levels of transparency marketing on specialty coffee bags to gauge consumer responses to cognitive process and value
creation measures. The cognitive processes studied were trust perceptions and psychological closeness. The measure of value creation and capture observed was willingness to buy.
I found quantitative evidence supporting that consumers significantly respond to transparency marketing from firms with heightened trust perceptions and increased psychological closeness, which in turn lead to additional value created and captured as observed in willingness to buy.
In my qualitative interviews with managers from Counter Culture Coffee, I asked
questions regarding business in general, the firm’s social mission, and the usage of
transparency marketing. My objective in doing so was to investigate if the firm’s purported
social mission was actually part of its core strategy and determine the role of transparency marketing in this relationship. I learned that Counter Culture’s social mission and
competitive advantage intertwine through its relationships with farmers. Counter Culture uses the longevity of its relationships with farmers to ensure coffee quality and consistency.
Unlike other specialty coffee roasters, Counter Culture’s strategy involves providing
consumers with the same high-quality coffees from specific farms year in and year out. Counter Culture described transparency marketing as the vehicle by which value created from relationships with farmers is ultimately captured from consumers.
Interestingly, this language directly mirrors economic theory in my literature review on the use of transparency to bridge the marketing of firm choices and latent consumer willingness to pay. Managers depict Counter Culture’s consumers as belonging to three categories: ethicality, quality, and lifestyle. If Counter Culture’s evaluation of the
preferences of these consumers is valid, then its relationships with farmers is the common operational choice preferred by all three consumer segments. Counter Culture uses
transparency marketing as costly signaling to verify the details of its competitive
to validate the purported effects of its relationships with farmers to consumers, Counter Culture is able to capture higher willingness to pay for its high quality good, its coffee. In turn, Counter Culture claims that part of the additional value captured due to transparency marketing is what allows them to continually invest in their farmers, suggesting some degree of sustainable strategy.
Comparison of the quantitative experiment and qualitative interviews suggests that observed responses of consumers in the experiment validate Counter Culture
managers’ perceptions of their consumers. For example, quality consumers can be characterized as being influenced by trust perceptions in their purchasing habits. Similarly, ethicality and image consumer can be described as being influenced by psychological closeness. Furthermore, the additional value managers believe they are capturing by using transparency marketing to uniquely create value for each consumer category reflects in a positive association to willingness to buy observed in the
quantitative experiment. Hence, due to aligned insights from both the sender and receiver perspectives, I conclude that transparency marketing is a functional strategy in the
specialty coffee industry that effects firms’ ability to create and capture value by
influencing consumer trust perceptions and psychological closeness.
Opportunities for Future Research
could be comprised by intercepting consumers at noted specialty coffee cafes.
Additionally, when creating a case study of the specialty coffee industry, aggregating interviews of multiple firms could provide a more comprehensive investigation of the specialty coffee industry. Furthermore, interviewing other participants in the specialty coffee industry beyond managers, such as farmers and consumers, could provide a more holistic picture. Alternatively, an expanded mixed methodology could be used to study other industries that engage in transparency marketing beyond specialty coffee.
As noted in a prior section, future academic research on the effects of
transparency marketing, with a focus in the specialty coffee industry, could examine the importance of consumer valuations of the overall brand in relation to coffee blends. Coffee blends largely lack the emphasis on transparency marketing and narrative of single-origin coffees. This research can examine the ways in which blends potentially benefit from the increase of brand’s overall valuation as caused by transparency marketing from the same brand’s single-origin coffees. Insights from this study could extrapolate potential brand-wide effects of transparency marketing to business-at-large.
Overall, given that transparency marketing is a relatively new practice, there are plenty of opportunities for future research on the phenomenon. An abundance of unexplored industries and untapped methodologies could keep interested researchers busy for years.
Implications on Practice
In my study, I expanded on previous research to address a gap in knowledge in
business academic literature surrounding the effects of transparency marketing on firms’
ability to create and capture value. Using consumer responses to transparency marketing, I found statistical evidence suggesting that when firms use transparency marketing strategically, they can actually indirectly create and capture additional value by
influencing consumer trust perceptions of firms and psychological closeness with firms. I supported these findings by interviewing managers at a firm whose strategy relies on transparency to generate willingness to pay for the marketing of specific operational choice. By evaluating both the receiver and sender ends of transparency marketing, I found a legitimate example of transparency marketing as a strategic decision with value creation and capture abilities in line with economic theory I reviewed.
trust perceptions and psychological closeness related to each specific firm’s strategic and operational choices. Moreover, my research provides an indirect, mediated causal
Appendix
REFERENCES
Adams, R.G. (1986). Physical distance and emotional closeness between friends. International Journal of Aging and Human Development, 22(1), 55-76.
Akerlof, G. (1970). The market for "lemons": Quality uncertainty and the market mechanism. The Quarterly Journal of Economics, 72(2), 388-400.
Bhattacharya, C.B., & Sen, S. (2003). Consumer-company identification: A framework for understanding consumers' relationships with companies. Journal of
Marketing, 67(2), 76-88.
Beneke, J., Flynn, R., Greig, T., & Mukaiwa, M. (2013). The influence of perceived product quality, relative price and risk on customer value and willingness to buy: A study of private label merchandise. Journal of Product & Brand Management, 22(3), 218-228.
Buell, R., & Norton, M. (2011). The labor illusion: How operational transparency increases perceived value. Management Science, 57(9), 1564-1579.
Buhrmester, M., Kwang, T., & Gosling, S. (2011). A new source of inexpensive, yet high-quality, data? Perspectives on Psychological Science, 6(1), 3-5.
Coffee basics: What is single-origin coffee? [Web log post]. Retrieved February 13, 2018, from https://counterculturecoffee.com.
Coffee basics: Seasonality [Web log post]. Retrieved February 13, 2018, from https://counterculturecoffee.com.
Doorey, D. (2011). The transparent supply chain: From resistance to implementation at Nike and Levi-Strauss. Journal of Business Ethics, 103(4), 587-603.
Fennis, B., & Stroebe, W. (2014). Softening the blow: Company self-disclosure of negative information lessens damaging effects on consumer judgment and decision making. Journal of Business Ethics, 120(2), 109-120.
Friedman, M. (1962). Capitalism and Freedom. Chicago, IL: University of Chicago Press.
Giacomantonio, M. (2010). Psychological distance boosts value-behavior correspondence in social decision making. Journal of Experimental Social Psychology, 46(5), 824. Gold, J., (2008, March 12). LA mill: The latest buzz. LA Weekly. Retrieved from
https://www.laweekly.com
Holmqvist, J., Guest, D., & Grönroos, C. (2015). The role of psychological distance in value creation. Management Decision, 53(7) 1430-1451.
Mingers, J., & Brocklesby, J. (1997). Multimethodology: Towards a framework of mixed methodologies. International Journal of Management Sciences, 25(5), 489-509. Mohan, B., Buell, R., & John, L. (2017). Lifting the veil: The benefits of cost
transparency. Harvard Business School Working Paper, No. 15-017.
Mohr, L., & Webb, D. (2005). The effects of corporate social responsibility and price on consumer responses. The Journal of Consumer Affairs, 39(1), 121-147.
Morwitz, V., Greenleaf, E., & Johnson, E. (1997). Divide and prosper: Consumers’
reactions to partitioned prices. American Marketing Association, 35(4), 453-463. Nocella, G., Hubbard, L., & Scarpa, R. (2010). Farm animal welfare, consumer
Economic Perspectives and Policy, 32(2), 275-297.
Joireman, J., Smith, D., Liu, R., & Arthurs, J. (2015). It's all good: Corporate social responsibility reduces negative and promotes positive responses to service failures among value-aligned customers. Journal of Public Policy & Marketing, 34(1), 32-49.
Pearce, W.B., & Sharp, S. (1973). Self-disclosing communication. Journal of Communication, 23(4), 409-425.
Pepper, M., Jackson, T., & Uzzell, D. (2009). An examination of the values that motivate socially conscious and frugal consumer behaviours. International Journal of Consumer Studies, 33(2), 126-136.
Peterson, H., & Yoshida, K. (2004). Quality perceptions and willingness-to-pay for imported rice in Japan. Journal of Agricultural and Applied Economics, 36(1), 123-141.
Porter, M. (2013, October 7). Michael Porter: Why business can be good at solving social problems [Video File]. Retrieved from
https://www.youtube.com/watch?v=0iIh5YYDR2o
Porter, M., & Kramer, M. (2006). Strategy and society: The link between competitive advantage and corporate social responsibility. Harvard Business Review, 84(12), 78-92.
Roosen, J., Bieberstein, A., Blanchemanche, S., Goddard, E., Marette, S., &
Samper, L., Giovanucci, D., & Vieira, L. (2017). The powerful role of intangibles in the coffee value chain. Economic Research Working Paper, 39(1).
Sánchez, J., Vijande, M., & Gutiérrez, J. (2010). The impact of relational variables on value creation in buyer-seller business relationships. Journal of Business-to-Business Marketing, 17(1), 62-94.
SCAA. (2015). 2015 Roaster financial ratio report. Santa Ana, California: SCAA. Schnackenberg, A., & Tomlinson, E. (2014). Organizational transparency: A new
perspective on managing trust in organization-stakeholder relationships. Journal of Management, 42(7), 1784-1810.
Sprecher, S., & Hendrick, S. (2004). Self-disclosure in intimate relationships:
associations with individual and relationship characteristics over time. Journal of Social and Clinical Psychology, 23(6), 857-877.
Thomson, M., MacInnis, D., & Park, C. (2005). The ties that bind: Measuring the
strengths of consumers’ emotional attachment to brands. Journal of Consumer Psychology, 15(1), 77-91.
Trope, Y., & Liberman, N. (2003). Temporal construal. Psychological Review, 110(3), 403-421.
Trope, Y., & Liberman, N. (2010). Construal-level theory of psychological distance. Psychological Review, 117(2), 440-463.
Wheeless, L., & Grotz, J. (1977). The measurement of trust and its relationship to self-disclosure. Human Communication Research, 3(3), 250-257.