PAPER • OPEN ACCESS
Modeling Urban Ecological Security in Yangtze River Delta based on
Machine Learning
To cite this article: H Sun et al 2020 IOP Conf. Ser.: Earth Environ. Sci. 502 012021
Content from this work may be used under the terms of theCreative Commons Attribution 3.0 licence. Any further distribution of this work must maintain attribution to the author(s) and the title of the work, journal citation and DOI.
Published under licence by IOP Publishing Ltd 1
Modeling Urban Ecological Security in Yangtze River Delta
based on Machine Learning
H Sun1, W Li1, 2, *, J Zhang1 and J Gao1
1. School of Environmental and Geographical Sciences, Shanghai Normal University, Shanghai 200234, China 2. Northwest Institute of Eco-Environment and Resources,
Chinese Academy of Sciences, Lanzhou 730000, China
E-mail Address [email protected] (W Li)
Abstract. Gradually deteriorating eco-systems have been threatening the sustainable development of cities. With time, more negative impacts will emerge and affect national security. Cities face significant challenges in ecological forward with sustainable development. Yangtze River Delta is recognized as one of the sixth largest urban agglomeration in the world, its economic development plays a significant role in the country and its ecological security cannot be ignored. In order to model and evaluate the urban ecological security of the Yangtze River Delta, Machine Learning method was integrated with the Pressure-State-Response (PSR) model. On comparison with the traditional methods, the process for modeling urban ecological security is more efficient, reliable, comprehensive and objective. The results show that (1) The ecological security of the Yangtze River Delta has been generally improved from the past 10 years; (2) Industrial smoke (powder) dust emissions, per capita park green area, and science technology expenditures in fiscal expenditure are the three most influencing indicators with aspect to nature, society, and economy. This research could provide guidance to the construction and maintenance of urban ecological security.
Keywords: Urban Ecological Security, Yangtze River Delta, Machine Learning, Indicator System, Comprehensive Evaluation
1. Introduction
With rapid increase in world population and tremendous advancements in science and technology, numerous cross-border environmental hazards have emerged [1]. Since the 1990s, multiple environmental problems (e.g. air pollution, water pollution, greenhouse effect, and sandstorms) have endangered many countries. Therefore, changes in the environment have been a common topic of global security [2]. In China, problems caused by the gradual deterioration of eco-systems have been threatening the sustainable development of cities. With time, further negative impacts will emerge and affect national security [3]. At the National Ecological Environmental Protection Conference held on May 18, 2018, General Secretary Jinping Xi pointed out that an excellent ecological environment is always the most popular welfare for the people, and vigorously promoting the construction of ecological civilization is of great significance to contemporary China [4]. More energy needs to be invested to detect, evaluate, and forecast ecological environments, so that there are ample references for its management by the government.
The term ‘ecological security’ firstly appeared during the evaluation of land health function in the 1940s, based on environmental security [5, 6]. The concept of ecological security was firstly proposed by the International Application System Analysis research institute in 1989[7]. Generally, a safe ecological environment is an non-vulnerable environmental state that human inhabit, which provides health, essential resources, basic rights, and social order and gives them have the ability to adapt to environmental changes, including natural security, social security and economy security [8, 9]. In a narrow sense, ecological security reflects the overall level of ecosystem integrity, which is a healthy, complete and sustainable condition [10]. Human, who are a part of nature, are protected by the safe ecological environment from unfavorable factors. The study of ecological security is the analysis and evaluation of natural and semi-natural eco-systems from the perspective of natural resources exploitation and identification of human living environment [7].
There are various methods of ecological security evaluation study. For traditional, there have been five common methods [11]: (1) Field investigation, experimental analysis, and other ecological methods; (2) Modeling with predictive, explanatory and inferential functions; (3) Landscape analysis for environment by spatio-temporal changes; (4) 3S technology for the dynamic monitoring, spatial analysis, evaluation, and management of the ecological environment; (5) Indicator system construction. For the fifth method, some international organizations and institutions have designed evaluation indicator systems. For example, the Pressure-State-Response (PSR) framework, proposed by the Organization for Economic Co-operation and Development, and is the most popular ecological evaluation model around the globe [12- 15], and includes pressure indicator, state indicator and response indicator [16]. Similarly, The United Nations Conference on Sustainable Development proposed the Driving force-State-Response framework [17]. The European Economic Area recommended the Driving force-Pressure-State-Influence-Response framework [18].
Traditional methods always focus on the current ecological situation but Machine Learning does not. Machine learning achieves the evaluation and simulation of ecological security but simulation. Many research methods, such as Ant Colony Algorithm [19], Cellular Automata [20, 21], Support Vector Machines [22, 23] and Error Back Propagation Neural Network (BP Neural Network) [24, 25] have been applied to the study of ecological security and related problems. These methods also serve
3
as important references for ongoing research.
In recent years, the economic development of Yangtze River Delta has played a significant role in the country, being the most densely populated and the most urbanized region in China. Furthermore, the ecological security of Yangtze River Delta has a major impact on China’s ecological security. Modern cities with many factors and complex relationships are highly artificial natural-economic-society complex ecosystems. The PSR framework is systematic and reasonable. Moreover, it can fully reflect the relationship among natural factors, social factors and economic factors in the system [26-28]. We use the PSR framework and BP Neural Network to evaluate and simulate the ecological security for Yangtze River Delta (2-3 years), respectively. In this paper, there are mainly three sections. Section 1 introduces the process of data preparation and processing. Section 2 briefly describes the methods and processes of the modeling. Section 3 shows the result and summarizes the conclusion.
2. Data and Methods
2.1. Data Preparation and Processing
The Yangtze River Delta is located in east China near the Pacific. It is the largest economic zone in China and is one of the six urban agglomerations in the world. The research area selected for this paper is the core area of the Yangtze River Delta. It includes 16 cities, covering approximately 110,800 km2, namely Shanghai, Nanjing, Wuxi, Changzhou, Suzhou, Nantong, Yangzhou, Zhenjiang, Taizhou (Jiangsu province), Hangzhou, Ningbo, Jiaxing, Huzhou, Shaoxing, Zhoushan, Taizhou (Zhejiang province) (Figure 1).
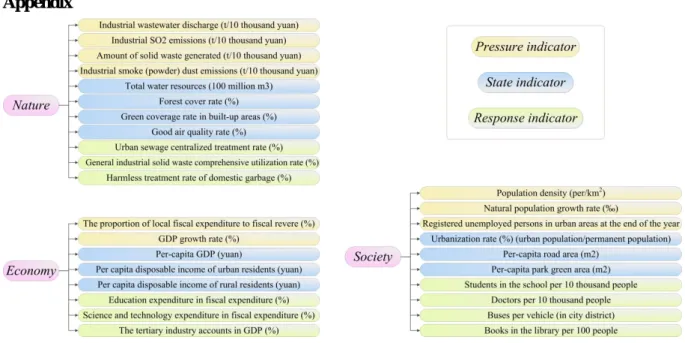
Indicators that influence ecological security are diverse. For example, population density, urbanization rate, forest cover rate, air quality index value, and harmless treatment rate of domestic garbage were selected to evaluate urban ecological security [29]. In addition, various indicator systems are used for different regions, with diverse focuses of evaluation. We made an indicator system by the PSR framework to analyze the indicators among the environmental pressure, the environmental state and the environmental response. The Pressure (P) indicator refers to the factor that exerts pressure on the environment which is due to the nature or human. The State (S) indicator refers to the current state of the environment, and characterizes the health of the environment. The Response (R) indicator refers to the countermeasure and the action taken when the system is facing risk pressure [30]. P, S, and R indicators are closely related and interact, which reflects the interaction between humans and the environment [31].
At the same time, factors of ecological security involve aspects of natural environment, economy, and society. Thus, the study of ecological security includes nature ecological security, economic ecological security, and social ecological security. For example, the natural indicator includes green coverage of built up area, construction land proportion and air quality equal; The economy indicator includes natural population growth rate, per capita gross domestic product (GDP) and the proportion of science education funding in GDP; The society indicator includes per capita total investment in fixed assets, announced unemployment rate, number of beds in health care institutions, number of higher education students. [32-34]
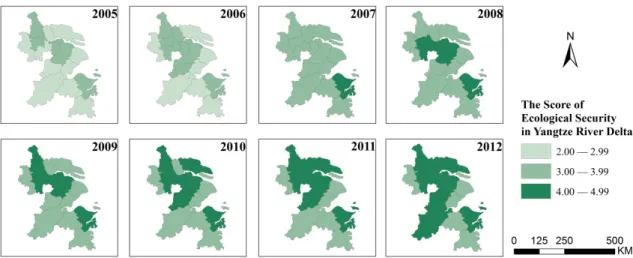
The period range of this study is from 2005 to 2015. Data from 2005 to 2012 are applied for the training part of the model, whereas data from 2013 to 2015 are used in the application part of the model. Based on the PSR Model, we chose 29 indicators with respect to nature, society, and economy as sustainable indicators for the Yangtze River Delta ecological security evaluation and simulation. The indicators are shown in the Appendix. Moreover, some referential data were used for identifying the classification of urban ecological security and to train the model. All of data has been normalized. We use the ecological security scores of the Yangtze River Delta from 2005 to 2012, which is calculated based on the comprehensive fuzzy evaluation method [35]. These values are listed by classifying in Figure 2.
Figure 1.The spatial distribution of study area.
5 2.2. Modeling by BP Neural Network
Generally, BP Neural Network refers to a multi-layer feed-forward neural network trained by error back propagation algorithm. BP Neural Network is an outstanding representative of the multi-layered perception network and is the most widely used neural network. In addition, the speed of convergence of BP algorithm is much faster than others algorithm [36, 37]. It consists of an input layer, one or more hidden layers, and an output layer; it is trained according to the error back propagation algorithm (BP). The application of BP Neural Network in pattern recognition, function approximation, simulation, and data compression are generally better than any other machine learning method. Moreover, most of machine learning methods were applied individually combined with statistical methods, but they were rarely associated with methods for evaluating indicator systems [19-25]. In this study, we propose a framework which combines PSR indicator system and BP Neural Network algorithm to model the ecological security.
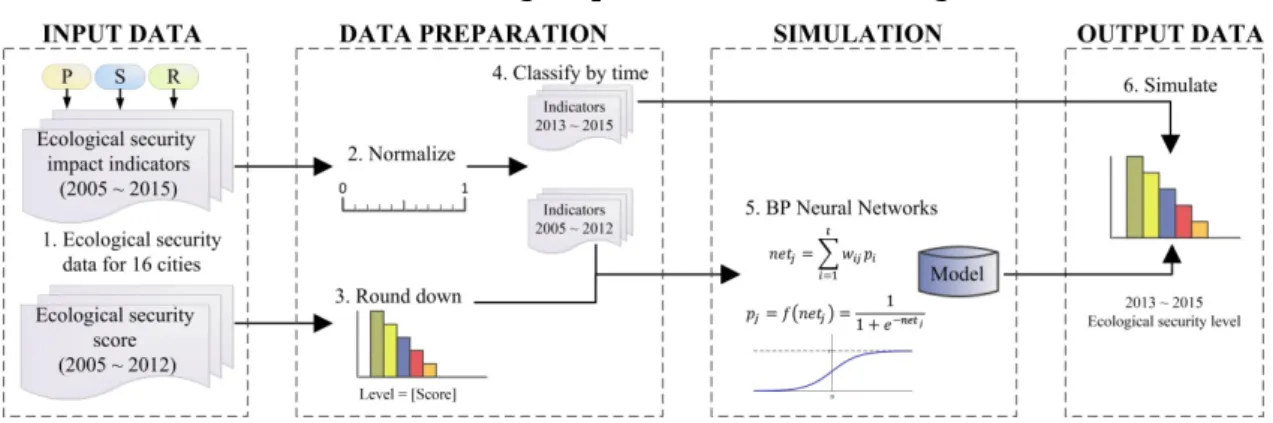
We choose BP Neural Network to model the ecological security of Yangtze River Delta, and attempt to demonstrate the varying trend of ecological security in Yangtze River Delta, and the most influencing indicators. The technical route for modeling the process is shown in the Figure 3.
Figure 3. Modeling workflow
3. Modeling Results
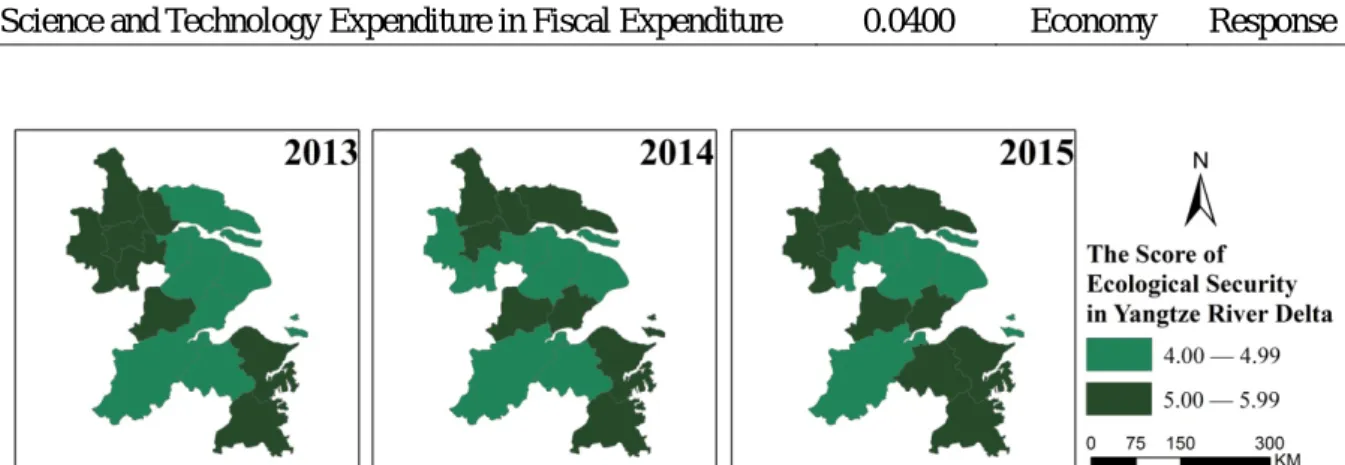
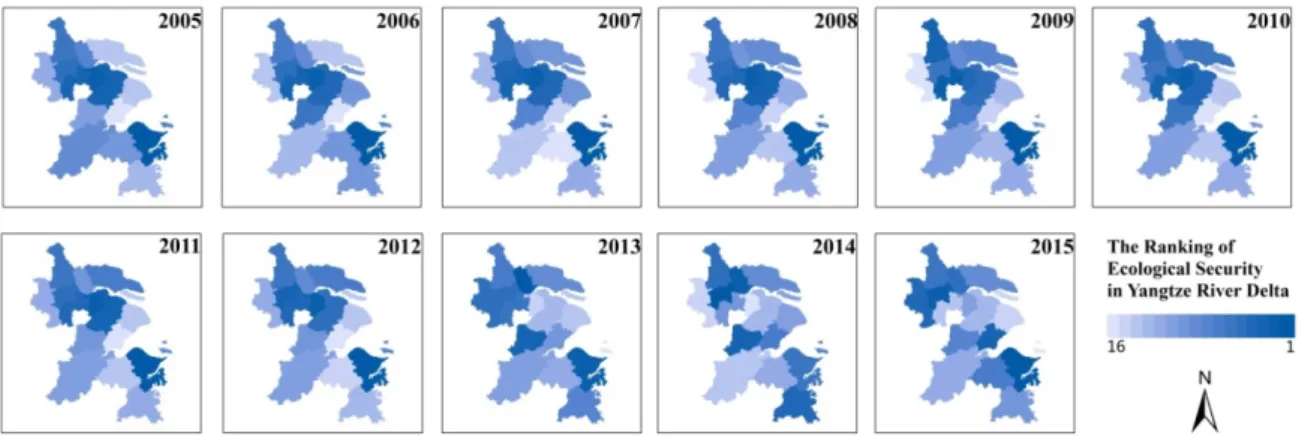
According to the theories about BP Neural Network in section 2, the ecological security scores in the Yangtze River Delta from 2013 to 2015 were obtained. The score is classified to 2 levels, and is shown in the Figure 4. The ranking of each city’s scores of ecological security is shown in Figure 5, which is ranked by the ecological security scores from the lowest to the highest.
And the most influencing indicators were acquired (Table 1). Based on our model, from 2005 to 2015, 16 varying trend of ecological security among the 16 cities is getting better (In order to make the ranking more obvious, results of modeling were normalized (Figure 6)). Overall the situation of the ecological security in Yangtze River Delta has been improved.
Before 2013, the ecological security situation of cities around Suzhou and Wuxi, which are in the northern part of the Yangtze River Delta, and those around Ningbo (which is in the southeastern part of the Yangtze River Delta) are getting better at a faster rate than others. That is mainly because the per capita GDP indicator and the industrial smoke (powder) dust emissions indicator are much better than other cities. Furthermore, Suzhou, Wuxi, Changzhou, Yangzhou and Nantong establish a sustainable
and effective development model with low impact on natural environment.
According to the modeling results, from 2013 to 2015, the ranking of some cities improved remarkably, such as Zhoushan, Jiaxing and Shaoxing. At the same time, the average ranking of these three cities’ ecological security situation is better than that of other cities in the last three years. We analyzed that the natural population growth rate indicator and the green coverage rate in built-up areas indicator were the most influencing indicators.
Combined with the ranking of ecological security, we demonstrate that the situation of ecological security in Shanghai is always not satisfactory. Shanghai is a centrally-located city of the Yangtze River Delta. Its economy radiation force to other cities in Yangtze River Delta is the strongest. Unsatisfactory ecological security situation is a threat to its radiation status in the Yangtze River Delta and is a result of poor attention to the protection of natural environment.
We also found that the Ambient Air Quality Standard (GB3095-2012) was formulated in early 2012. 74 cities implemented this standard in 2013, including the 16 cities chosen in this paper. Most cities’ air quality level dropped significantly; only two cities reached the secondary standard under this standard, leading to our simulation result becomes unstable.
For all cities, there are five important influencing indicators with respect to their ecological security. The indicators and their weights are shown in Table 1.
The change of ecological security is a multi-indicator and dynamic process. To analyze and model the urban ecological security accurately, dynamic data should be used in the future to model.
Table 1. Top five influencing indicators
Indicator Weight Class
N/S/E P/S/R Industrial Smoke (Powder) Dust Emissions 0.0877 Nature Pressure
Total Water Resources 0.0545 Nature State
Per Capita Park Green Area 0.0464 Society State Doctors Per Ten Thousand People 0.0415 Society Response Science and Technology Expenditure in Fiscal Expenditure 0.0400 Economy Response
7
Figure 5 Ranking of ecological security in the Yangtze River Delta from 2005 to 2015
Figure 6. Ranking of ecological security in the Yangtze River Delta from 2005 to 2015 (be normalized)
4. Conclusions
This study introduces ecological security, and integrates the PSR Model and Machine Learning method to model the ecological security of 16 cities in the Yangtze River Delta from 2012 to 2015, and shows the varying trends from 2005 to 2015.
In terms of modeling urban ecological security, Machine Learning is a feasible method. Artificial Neural Network is an algorithmic mathematical model for distributed parallel information processing, whereas BP Neural Network is the most successful neural network learning algorithm so far. Furthermore, reference data (ecological security level from 2005 to 2012) in our model-training process are widely recognized. Meanwhile, as using the Machine Learning method, we not only need to set the weight for each indicator, but can obtain the influencing ranking of each indicator. We select 29 indicators based on PSR model covering nature, society and economy 3 aspects. This indicators system relatively comprehensively reflects the reality of the ecological security situation in Yangtze River Delta. Thus we believe that the result of this study based on Machine Learning and these 29 indicators is relatively efficient, reliable, comprehensive, and objective.
River Delta including industrial smoke (powder) dust emissions (nature), per capita park green area (society), science and technology expenditure in fiscal expenditure (economy). This paper aims to provide guidance for the construction and maintenance of urban ecological security.
By using Machine Learning, the trend of ecological security in the Yangtze River Delta in the past three years is modeled. The reference data in our training data is widely recognized; the BP Neural Network method is better suited to evaluate and the experimental process is rigorous. Hence, the result of this process is efficient and reliable.
Acknowledgements
This work was supported by the National Natural Science Foundation of China (Grant No. 41501458 and 41730642), the Natural Science Foundation of Shanghai (Grant No. 19ZR1437500), National Key Research and Development Program of China (No. 2016YFC0502706), Open fund of Shandong Provincial Key Laboratory of Water and Soil Conservation and Environmental Protection (STKF201902) and the Shanghai Gaofeng & Gaoyuan Project for University Academic Program Development.
Appendix
Figure 7. Indicator system based on PSR model.
References
[1] Held D, McGrew A, Goldblatt D and Perraton J 2000 Global transformations: Politics, economics and culture (Politics at the Edge vol 2000) (London: Palgrave Macmillan) chapter 2 pp 14–28
[2] Dator J 2005 From Resource Scarcity to Ecological Security: Exploring New Limits to Growth (Cambridge Massachusetts: MIT Press)
9
[3]
Schreurs M A 2009
Environmental security in northeast Asia In Facing Global Environmental Change (Hexagon Series on Human and Environmental Security and Peace vol 4) (Berlin, Heidelberg: Springer) chapter 63 pp 829–41[4] Xi J 2019 Resources and Human environment 2 6–9 (in Chinese)
[5] Callieott J B 1992 New Goals for Environment Management (
Washington D C: Island Press)
[6]Whitford W G, Rapport D J and DeSoyza A G 1999 J. Environ. Manage. 57 21
–9
[7]Xiao D and Chen W 2002 J. Appl. Ecol. 13 354
–8
[8] Dobson A P, Bradshaw A D and Baker A J M Science 277 515–22
[9]
Norton S B, Rodier D J, Gentile J H, Van Der Schalie W H, Wood W P and Slimak M
W 1992 Environ. Toxicol. Chem. 11 1663
–72
[10] Geneletti D, Beinat E, Chung C F, Fabbri A G and Scholten H J 2003 Environ. Impact. Asses. 23 471–87
[11] Chen X and Zhou C 2005 Progress in Geography 24 8–20 (in Chinese) [12] Zhang J, Su W and Zhang F 2011 China Environmental Science 31 1039–44 [13] Li P, Li G, Zhang J, Xu F and Chen L 2009 Geogr. Res. 28 293–302
[14] Bai X and Tang J 2010 Procedia Environ. Sci. 2 881–7
[15] Liang P, Li D and Gui Y 2010 Procedia Environ. Sci. 2 832–41
[16] Hammond A 1995 Environmental Indicators: A Systematic Approach to Measuring and Reporting on Environmental Policy Performance in the Context of Sustainable Development (Washington, DC: World Resources Institute)
[17] Qian J, Zhou Y 2004 Geography and Geo-Information Science 6 57–60 (in Chinese)
[18] Svarstad H, Petersen L K, Rothman D, Siepel H and Wätzold F 2008 Land Use Policy 25 116– 25
[19] Peng J, Zhao S, Dong J, Liu Y, Meersmans J, Li H and Wu J 2019 Environ. Modell. Softw. 117 214–22
[20] Gong J, Liu Y, Xia B and Zhao G 2009 Ecol. Model. 220 3612–20 [21] Xu T, Gao J and Li Y 2019 Land Use Policy 87 104030
[22] Zhang W 2016 Nat. Environ. Pollut. Technol. 15 337 [23] Liu L and Lei Y 2018 Ecol. Inform. 44 33–42
[24] Wu M, Wei Y, Lam P T I, Liu F and Li Y 2019 J. Clean. Prod. 237 117795
[25] Liu C, Li W, Wu H, Lu P, Sang K, Sun W, Chen W, Hong Y and Li R 2013 Nat. Hazards (Dordr.) 69 1477–95
[26] Wang J, Song P, Zhang B, Liu W and Zhang J 2016 J. Ecol. 36 6628–35 (in Chinese) [27] Chen L, Li A and Liu M 2008 Urban Stud 15 33–6 (in Chinese)
[28] Li F and Wang R 2003 China Population Resources and Environment 13 72–5 (in Chinese) [29] Ye H, Ma Y and Dong L 2011 Energy Procedia 5 2172–7
[30] Organisation for Economic Co-operation and Development Staff 2001 OECD Environmental Indicators: Towards Sustainable Development 2001 (Paris: OECD)
[31] Niemeijer D and de Groot R S 2008 Environ. Dev. Sustain. 10 89–106 [32] Han B, Liu H and Wang R 2015 Ecol. Modell. 318 217–25
[34] Bai X, and Tang J 2010 Procedia Environmental Sciences 2 881–7
[35] Lv W 2014 The urban ecolojical security assessment of Yangtze River Delta Urban Agglomerations (Shanghai: East China Normal University) (in Chinese)
[36] Kitano H 1990AAAI Machine Learning ( U.S.A: AAAI) p 789–95
[37] Jin W, Li Z, Wei L and Zhen H 2000 5th Int. Conf. on Signal Processing vol 3 (Beijing: PHIE ) p 1647–9