i
BIG DATA ANALYTICS: A PREDICTIVE ANALYSIS
APPLIED TO CYBERSECURITY IN A FINANCIAL
ORGANIZATION
Pedro Filipe Martins Tourais Pereira
Project Work presented as partial requirement for obtaining
the Master’s degree
in Information Management, with
specialization in Knowledge Management and Business
Intelligence
i
MEGI
20
19 BIG DATA ANALYTICS: A PREDICTIVE ANALYSIS APPLIED TO
ii
NOVA Information Management School
Instituto Superior de Estatística e Gestão de Informação
Universidade Nova de Lisboa
BIG DATA ANALYTICS: A PREDICTIVE ANALYSIS APPLIED TO
CYBERSECURITY IN A FINANCIAL ORGANIZATION
by
Pedro Filipe Martins Tourais Pereira
Project Work presented as partial requirement for obtaining the Master’s degree in Information
Management, with a specialization in Knowledge Management and Business Intelligence
Advisor:Roberto Henriques, PhD
iii To Diogo and Sílvia to whom I owe everything
iv
ACKNOWLEDGEMENTS
I would like to thank all the support, patience and care given by my son Diogo, my wife Sílvia, my parents, my brother and the rest of my family and friends, during the development of this work, which whom without it wouldn’t have been possible.
To my son Diogo, who has always seen his father working late night after work for this thesis, and my wife Sílvia who has endured it and helped me unconditionally in our daily lives and by reviewing each development of this work.
To my brother who helped providing the grounds for this work, the inspiration, the technical knowledge and limitless patience and support.
To my parents whom I haven’t dedicate as much time as I should, for making them worry too many times, and for helping me in every way they could to overcome this step of my life.
To my friend Jorge Lopes for the countless hours of technical discussions, work reviews and for being supportive at all times.
To my advisor PhD Roberto Henriques for the guidance, support and constructive technical discussions to overcome the challenges of this work, and for all the knowledge shared not only during the development of this project but also during the classes and to whom I owe a lot in my technical growth.
v
ABSTRACT
With the generalization of the internet access, cyber attacks have registered an alarming growth in frequency and severity of damages, along with the awareness of organizations with heavy investments in cybersecurity, such as in the financial sector. This work is focused on an organization’s financial service that
operates on the international markets in the payment systems industry. The objective was to develop a predictive framework solution responsible for threat detection to support the security team to open investigations on intrusive server requests, over the exponentially growing log events collected by the SIEM from the Apache Web Servers for the financial service.
A Big Data framework, using Hadoop and Spark, was developed to perform classification tasks over the financial service requests, using Neural Networks, Logistic Regression, SVM, and Random Forests algorithms, while handling the training of the imbalance dataset through BEV. The main conclusions over the analysis conducted, registered the best scoring performances for the Random Forests classifier using all the preprocessed features available. Using the all the available worker nodes with a balanced configuration of the Spark executors, the most performant elapsed times for loading and preprocessing of the data were achieved using the column-oriented ORC with native format, while the row-oriented CSV format performed the best for the training of the classifiers.
KEYWORDS
vi
RESUMO
Com a generalização do acesso à internet, os ciberataques registaram um crescimento alarmante em frequência e severidade de danos causados, a par da consciencialização das organizações, com elevados investimentos em cibersegurança, como no setor financeiro. Este trabalho focou-se no serviço financeiro de uma organização que opera nos mercados internacionais da indústria de sistemas de pagamento. O objetivo consistiu no desenvolvimento uma solução preditiva responsável pela detecção de ameaças, por forma a dar suporte à equipa de segurança na abertura de investigações sobre pedidos intrusivos no servidor, relativamente aos exponencialmente crescentes eventos de log coletados pelo SIEM, referentes aos Apache Web Servers, para o serviço financeiro.
Uma solução de Big Data, usando Hadoop e Spark, foi desenvolvida com o objectivo de executar tarefas de classificação sobre os pedidos do serviço financeiros, usando os algoritmos Neural Networks, Logistic Regression, SVM e Random Forests, solucionando os problemas associados ao treino de um dataset desequilibrado através de BEV. As principais conclusões sobre as análises realizadas registaram os melhores resultados de classificação usando o algoritmo Random Forests com todas as variáveis pré-processadas disponíveis. Usando todos os nós do cluster e uma configuração balanceada dos executores do Spark, os melhores tempos para carregar e pré-processar os dados foram obtidos usando o formato colunar ORC nativo, enquanto o formato CSV, orientado a linhas, apresentou os melhores tempos para o treino dos classificadores.
PALAVRAS-CHAVE
vii
INDEX
1. Introduction ... 1
2. Background ... 4
2.1. Cybercrime and Cybersecurity Definition ... 4
2.2. Types of Cyber Attacks ... 5
2.3. Consequences of Cybercrime ... 7
2.4. Cybercrime Awareness ... 9
3. Literature Review ... 11
3.1. Big Data Analytics ... 11
3.2. Cybersecurity Analytics ... 13
3.2.1. Intrusion Detection Systems (IDS) ... 13
3.2.2. Security Information and Event Management System (SIEM) ... 18
4. Methodology ... 23
4.1. Distributed Systems / Parallel Processing ... 23
4.1.1. Apache Hadoop Framework ... 23
4.1.2. Apache Spark Framework... 25
4.1.3. Experimental Setup ... 27
4.2. Data Mining Methodology ... 27
4.3. Business Understanding ... 28
4.4. Data Understanding ... 29
4.4.1. Data Collection ... 29
4.4.2. Data Description – Original Dataset ... 33
4.4.3. Data Exploration – Original Dataset ... 35
4.4.4. Data Quality and Consistency Validation – Original Dataset ... 37
4.5. Data Preparation ... 39
4.5.1. Data Cleaning ... 39
4.5.2. Data Transformation ... 40
4.5.3. Data Exploration of the Transformed Data ... 41
4.5.1. Feature Selection ... 44 4.6. Modelling ... 47 4.6.1. Binary Classification ... 47 4.6.2. Data Partition ... 47 4.6.3. Spark ML Modelling ... 52 4.6.4. Classification Algorithms ... 54 4.7. Evaluation ... 62 4.7.1. Performance Metrics... 62
viii
4.7.2. Performance Analysis ... 65
5. Results and Discussion ... 67
5.1. Performance by Classification Algorithm ... 68
5.2. Performance by Feature Selection ... 70
5.3. Performance by Processing Time and Storage Format ... 72
6. Conclusions ... 77
7. Limitations and Recommendations for Future Works ... 81
8. Bibliography ... 82
9. Appendix ... 90
9.1. Data Mining Tasks... 90
9.2. HDFS Technology and Architecture Overview... 91
9.3. YARN Technology and Architecture Overview ... 92
9.4. MapReduce Process Overview ... 93
9.5. Experimental Setup ... 94
9.6. Plot Representation of the Interval Feature “bytes” – Original Dataset ... 95
9.7. Summary Statistics Nominal Features – Transformed Dataset ... 96
9.8. Imbalanced Dataset Handling – External or Data Level Approaches ... 97
9.9. Artificial Neural Networks ... 99
9.10. Training / Hyperparameter Tuning – Artificial Neural Networks ... 101
9.11. Logistic Regression – Regularization Parameters ... 103
9.12. Training / Hyperparameter Tuning – Logistic Regression ... 103
9.13. SVM - Binary Linear and Non-Linear Approaches ... 105
9.14. Training / Hyperparameter Tuning – Support Vector Machines ... 106
9.15. Random Forests – Pseudo-code ... 107
ix
LIST OF FIGURES
Figure 3.1 - SIEM Architecture (Suh-Lee et al., 2016) ... 19
Figure 4.1 - Financial Organization Data Flow ... 30
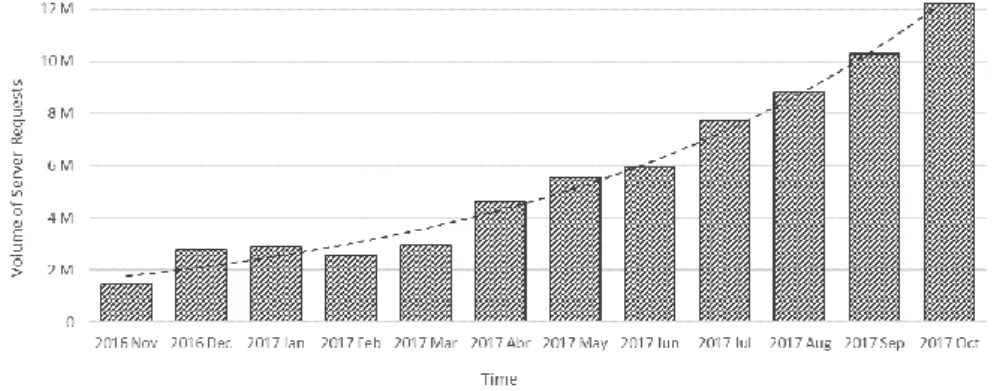
Figure 4.2 - Data Collection Growth Over Time... 31
Figure 4.3 - Data Collection Flow from SIEM Logs to CSV to HDFS ... 31
Figure 4.4 - Data Collection Flow from CSV to ORC and Parquet ... 32
Figure 4.5 - Original Dataset Sample... 33
Figure 4.6 - Transformed Dataset Sample... 41
Figure 4.7 - Data Partition Architecture ... 48
Figure 4.8 - The BEV System for Classifying Imbalanced (Li, 2007)... 50
Figure 4.9 - Spark ML Modelling Architecture ... 52
Figure 4.10 - Artificial Neural Network Architecture Example (Bre, Gimenez, & Fachinotti, 2017) ... 55
Figure 4.11 - Linear SVM Representation for a Binary Problem (Dey, 2018) ... 59
Figure 4.12 - General Architect of Random Forest (Nguyen, Wang, & Nguyen, 2013) ... 60
Figure 4.13 - The Difference Between Algorithms Using ROC and PR Space (Davis & Goadrich, 2006)... 65
Figure 5.1 - Features Importance Performance Analysis for the Test Set using Random Forests... 71
Figure 5.2 - File Format Storage Gains vs CSV (a), and Elapsed Times for Loading and Preprocessing (b) .. 73
Figure 5.3 - Elapsed Training Time for All the Classifiers and All the File Formats vs f1-measure (test set) 74 Figure 5.4 - Elapsed Training Time for CSV and RF for Different Node and Spark Configurations ... 75
Figure 9.1 - HDFS Architecture (Apache Software Foundation, 2018e)... 91
Figure 9.2 - YARN Architecture (Apache Software Foundation, 2018f) ... 92
Figure 9.3 - MapReduce Applied to the Word Count Example (Mathews; & Aasim, 2018) ... 93
Figure 9.4 - MapReduce Interaction With HDFS (Mathews; & Aasim, 2018) ... 93
Figure 9.5 - Experimental Cluster Setup Architecture ... 94
Figure 9.6 - Plot Representation of the Input Interval Feature “bytes” ... 95
Figure 9.7 - ANN Training/Tuning AUC-PR Comparison ... 102
Figure 9.8 - ANN Training/Tuning Elapsed Time Comparison ... 102
Figure 9.9 - LR Training/Tuning AUC-PR Comparison ... 104
Figure 9.10 - LR Training/Validation Comparison Between Regularization and Elastic Net Parameters ... 104
Figure 9.11 - SVM Training/Tuning AUC-PR Comparison ... 106
Figure 9.12 - SVM Training/Validation Comparison Between Regularization Parameters ... 107
Figure 9.13 - Random Forests Pseudo-code (Bernstein, 2019) ... 107
Figure 9.14 - Training/Validation Comparison Between Impurity Measures... 108
Figure 9.15 - Training/Validation Comparison Between Feature Subset Strategies ... 109
Figure 9.16 - Training/Validation Comparison Between Subsampling Rates ... 109
x
LIST OF TABLES
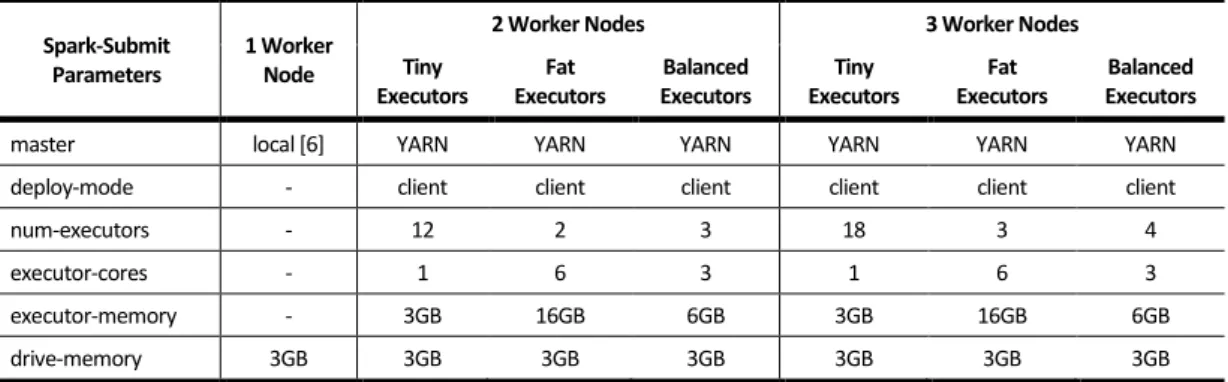
Table 4.1 - Experimental Cluster Architectures and Spark Parameter Configurations ... 27
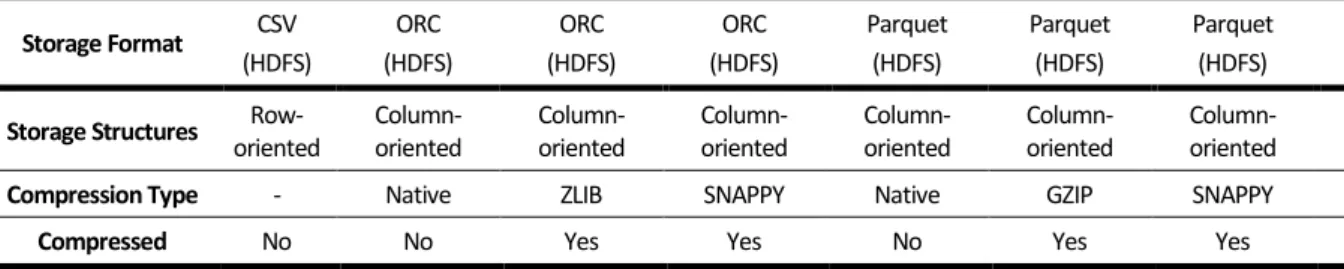
Table 4.2 - Experimental File Formats and Compressions Used ... 32
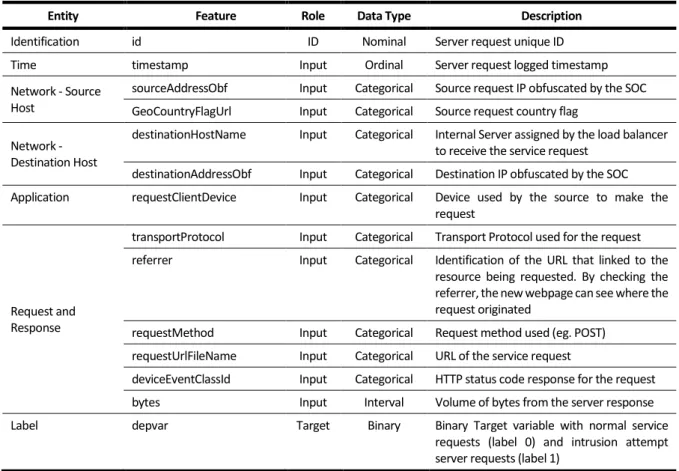
Table 4.3 - Original Features Names, Description, Role, and Data Type ... 34
Table 4.4 - Univariate Exploratory Analysis of the Input Nominal Features – Original Dataset ... 35
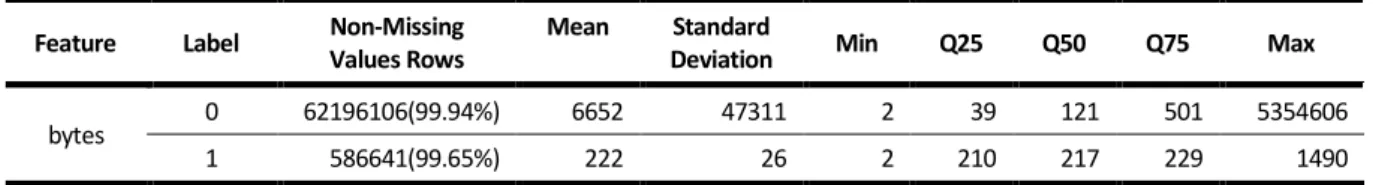
Table 4.5 - Univariate Exploratory Analysis of the Input Interval Feature – Original Dataset ... 36
Table 4.6 - Univariate Exploratory Analysis of the Target Variable ... 37
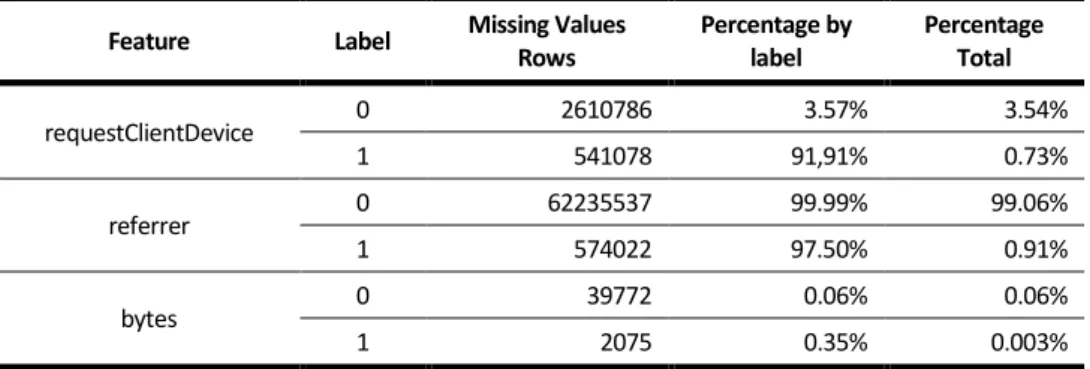
Table 4.7 – Data Quality Validation for Missing Values ... 37
Table 4.8 - Data Quality Validation for Inadequate Data ... 38
Table 4.9 - Univariate Exploratory Analysis of the Input Nominal Features – Transformed Dataset ... 42
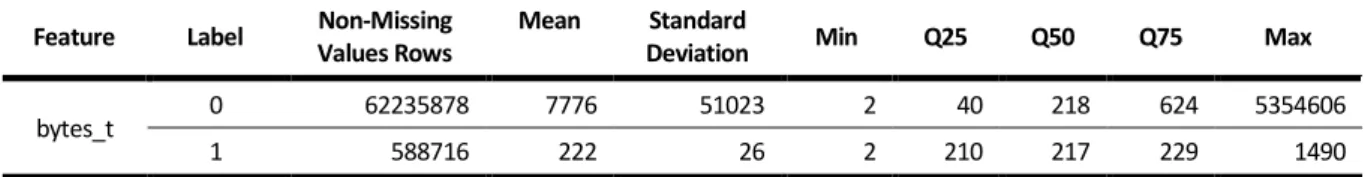
Table 4.10 - Univariate Exploratory Analysis of the Input Interval Feature – Transformed Dataset ... 43
Table 4.11 - Univariate Exploratory Analysis of the Input Target Variable – Transformed Dataset ... 43
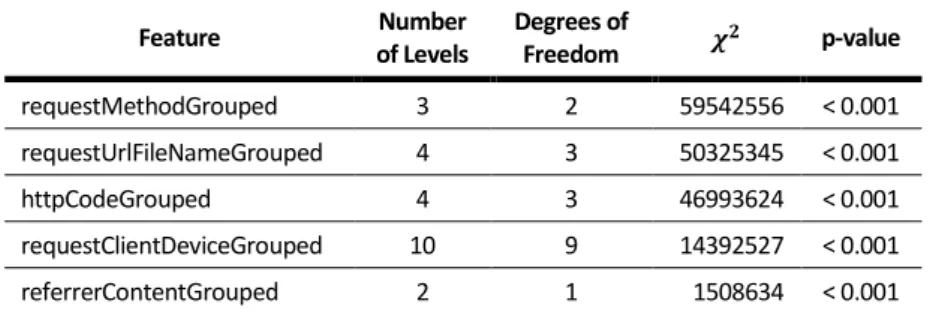
Table 4.12 - Feature Selection Using Chi-square as a Filter ... 46
Table 4.13 - Training and Test Set Data Partition ... 49
Table 4.14 - Training an Test Set After BEV Implementation ... 51
Table 4.15 - Neural Networks Hyper-parameters Tuned ... 56
Table 4.16 - Logistic Regression Hyper-parameters Tuned ... 58
Table 4.17 - Support Vector Machines Hyper-parameters Tuned ... 60
Table 4.18 - Random Forests Hyper-parameters Tuned ... 62
Table 5.1 - Best Set of Hyper-parameters Tuned for the Validation Set for Each Classifier ... 68
Table 5.2 - Scoring Performance Over the Test Set for the ANN, LR and RF ... 68
Table 5.3 - Scoring Performance Over the Test Set for the SVM ... 68
Table 9.1 - Experimental Cluster Setup Services ... 94
Table 9.2 - Summary Statistics for the Transformed ReferrerContentGrouped ... 96
Table 9.3 - Summary Statistics for the Transformed RequestClientDeviceGrouped ... 96
Table 9.4 - Summary Statistics for the Transformed RequestMethodGrouped ... 96
Table 9.5 - Summary Statistics for the Transformed httpCodeGrouped ... 97
Table 9.6 - Summary Statistics for the Transformed RequestUrlFileNameGrouped ... 97
Table 9.7 - Neural Networks Hyper-parameter Tuning ... 101
Table 9.8 - Logistic Regression Hyper-parameter Tuning ... 103
Table 9.9 - Support Vector Machines Hyper-parameter Tuning ... 106
xi
LIST OF ABBREVIATIONS AND ACRONYMS
AM Application Master ANN Artificial Neural Network
API Application Programming Interface ATM Automated Teller Machine
AUC Area Under the Curve
AUC-PR Area Under the Precision-Recall Curve AUC-ROC Area Under the ROC Curve
BEV Bagging Ensemble Variation COC Convention on Cybercrime CPU Central Processing Unit
CRISP-DM Cross Industry Standard Process for Data Mining CSV Comma-Separated Values
CV Cross-validation
DDoS Distributed Denial-of-Service DoS Denial-of-Service
FN False Negative FP False Positive FPR False Positive Rate
FW Firewall
GD Gradient Descent GDP Gross Domestic Product GI Gini Importance
HDD Hard Disk Drive
HDFS Hadoop Distributed File System HIDS Host Intrusion Detection Systems HTTP Hypertext Transfer Protocol
IARPA Intelligence Advanced Research Projects Activity IC3 Internet Crime Complaint Center
IDS Intrusion Detection System IG Information Gain
IP Internet Protocol ISP Internet Service Provider
xii
KDDCUP’99 Knowledge Discovery and Data Mining Tools Competition held in 1999
L-BFGS Limited-memory Broyden-Fletcher-Goldfarb-Shanno optimization algorithm LR Logistic Regression
MB Megabyte
MDI Mean Decrease in Impurity ML Machine Learning
MLP Multilayer Perceptron
NIDS Network Intrusion Detection Systems NSA National Security Agency
ORC Optimized Row Columnar format OS Operating System
OSI layer Open Systems Interconnection model layer PHP Hypertext Preprocessor
POS Point of Sale
PPV Positive Predicted Value or Precision metric PR curve Precision-Recall curve
R2L Remote to Local
RAM Random-Access Memory RDD Resilient Distributed Dataset
RF Random Forests
RM ResourceManager
ROC Receiver Operating Characteristic SGD Stochastic Gradient Descent
SIEM Security Information and Event Management System SMO Sequential minimal optimization algorithm
SMOTE Synthetic Minority Over-sampling Technique SOC Security Operations Center
SQL Structured Query Language SVM Support Vector Machines
TB Terabyte
TCP Transmission Control Protocol
TN True Negative
TNR True Negative Rate TP True Positive TPR True Positive Rate
xiii U2R User to Root
URL Uniform Resource Locator WAF Web Application Firewall
WEKA Waikato Environment for Knowledge Analysis YARN Yet Another Resource Negotiator
1
1.
INTRODUCTION
This project work was developed as a partial requirement for obtaining the Master’s degree in Information
Management with specialization in Knowledge Management and Business Intelligence from the NOVA Information Management School of the Universidade Nova de Lisboa.
Throughout the recent years, technological developments boosted by the generalization of the internet access have brought to our homes and societies new, promising and groundbreaking opportunities that are rapidly shaping the way people and organizations communicate, access and share information or even conduct commercial activities. However, with the steep growth in the usage of computer networks and personal smart devices in our everyday lives, spawned the threats and dangers of cyber attacks (Bendovschi & Al-Nemrat, 2016; Jenab & Moslehpour, 2016).
Cyber attacks are accountable for the intentional unauthorized and abusive usage of computer systems to damage and exploit data availability, integrity and confidentiality from single individuals to business organizations (Bendovschi, 2015; Jenab & Moslehpour, 2016; Rajan, Ravikumar, & Shaer, 2017). The high frequency and volume of reported damages and losses by people and organizations are estimated to be under-representative of the real impact of the attacks, either in numbers or in the intangible damages associated. In fact, one of the major concerns associated with this crimes is the inability for most companies to discover that they have been compromised or data breached internally (Center for Strategic and International Studies, 2014). By 2017, the World Economic Forum published their annual Global Risk Report, placing the technological dangers associated with large scale cyber attacks and massive incident of data fraud/theft, respectively, in 6th and 5th places in the list of risks most likely to occur in the next ten years (World Economic Forum, 2017). As a consequence, organizations and governmental entities awareness have risen significantly and a heavy investment in cybersecurity products and services have been increasing (Bendovschi, 2015; Center for Strategic and International Studies, 2014; Rajan et al., 2017). Among the most influential and sensitive business areas affected by this threat is the financial sector (Kumar, Yadav, Sharma, & Singh, 2016), where the financial organization of this dissertation work is framed. This dissertation work is focused on a specific financial service of an organization that operates on the international markets in the payment systems industry, which allows end users and merchants to access a payment service through mobile or Point of Sale (POS) devices. Following the previously mentioned security concerns and the sensitive nature of the information handled by the company, the organization is continuously reinforcing the security of their infrastructures, services and procedures using new techniques and technologies, capable of supporting the constant monitorization, investigation and analysis over all the potential attacks that they are exposed to.
2
All the client requests to the organization’s services are collected by Apache Web Servers, monitored through several layers of security and followed closely by Security Operations Center (SOC), a team composed of security experts. Among the technological stack of tools used, the Security Information and Event Management system (SIEM) is responsible for the collection and correlation of the system’s
applications and services generated log data, providing a hawk eye over the whole system ecosystem. Currently, the implemented security system, for that service, is based on a set of a manually defined ruled-based system developed by security experts. The SOC can only open investigations on intrusive server requests attempts with high expression over the volume of information transacted. Due to the limited available human resources of experts, it is impractical to open investigations overall intrusion attempt, ending in an impossible tracking scenario of the number of false positives or negatives involved, as the process of opening investigations is not managed efficiently.
Since the launch of the financial service, the Apache Web Servers have registered an exponential growth in the volume of information from the increasing usage of the financial service. Thus, a more versatile, efficient and automatic solution urges as the manually defined rule-based system ends up being efficient but not updated fast enough for the complex and changing nature of the intrusion attempts and not accurate enough for the number of false positives flags raised.
The objective of this dissertation work is to develop a predictive framework solution responsible for threat detection (classification) to support the SOC team, over the log events collected by the SIEM from the Apache Web Servers for a particular financial service.Given the exponential volume growth of data logs from the increasing usage of the financial product, it is mandatory to enable the framework to operate under a Big Data environment. The solution is expected to accommodate the complete Data Mining (DM) processing pipeline, from data collection of the log server requests from SIEM, including data preprocessing, to the modelling of a classification algorithm. The design of the solution should also be capable of handling the issues associated with poor performant learning algorithms when subjected to a biased training from a highly imbalanced training set, typically present in intrusion detection scenarios.
From the resulting framework solution, the following analysis is expected to be produced in order to extract conclusion related to its performance: i) Analysis, evaluation and comparison of the different results produced by the proposed framework over different classification algorithms; ii) Analysis and evaluation of the impact and significance of the chosen features over the quality of the results produced for the most performant classifier; and iii) Analysis, evaluation and comparison of the storage gains using different file formats, elapsed processing times of the different stages of the framework, including the training of the of the different classification algorithms used, and of the different cluster configurations and spark-submit parameters.
3
The development of this work was organized in the following seven chapters. After this introduction, the second chapter, the Background, provides a context of the main agents involved in the cybercrime activities and their impact over the economic, social and political environments in which belongs the financial organization of this work. The third chapter, the Literature Review, is focused on the knowledge gathering of previous studies and approaches related with cybersecurity and Machine Learning (ML)/DM with emphasis on the intrusion detection systems (IDS), Big Data predictive solutions and SIEM-based implementations. The fourth chapter, the Methodology, is focused on the proposed solution describing all the methodologies and techniques implemented, along with all the steps produced on every stage of the pipeline process prior to the final results. This chapter exposes the issues encountered during the development of the framework and provides the reasoning and justifications behind all the decisions and technical approaches implemented to overcome them. The fifth chapter, the Results and Discussions, presents a series of analysis over the final results produced by the proposed framework solutions in order to evaluate its performance form different perspectives. Finally, the conclusions, limitations and the future works are presented on the sixth and seventh chapters.
4
2.
BACKGROUND
In recent years the world has witnessed an increasing technological development merged with the generalization of internet access, creating, connecting and shaping the world into a new era of opportunities for everyone and anywhere. This scenario brought to our daily lives a connected reality where people and organizations interact and share data continuously. However, along with its potential uses, the same opportunities brought the threats and dangers of cyber attacks (Bendovschi & Al-Nemrat, 2016). The generalization of technology usage, such as computer networks or personal smart devices, is being targeted by cyber attacks every day (Jenab & Moslehpour, 2016). The influence of the increasing technological developments related with internet social and commercial activities has made cybercrime to grow and diversify their approaches with new tools and techniques day by day successfully overcoming increasing complex security measures (Bendovschi, 2015).
2.1.
C
YBERCRIME ANDC
YBERSECURITYD
EFINITIONCyber attacks are perceived as intentional unauthorized and abusive exploitations of computer systems, technology-dependent enterprises and networks (Jenab & Moslehpour, 2016; Rajan et al., 2017). This nefarious activity seeks to innovatively create new tools to illegally contour access to networks, programs and data in order to damage and exploit data availability, integrity and confidentiality from single individuals to business organizations (Bendovschi, 2015). According to Rajan et al. (2017) “any crime that is committed using a computer or network, or hardware device” is considered a cybercrime.
Cyber threats can be generally divided into three main categories: i) Cyber Terror - Composed by independent organizations focused on spreading terror through the web; ii) Cybercrime - Related with the illegal activities to obtain money, confidential data or unethical hacking; and iii) Cyber War - Associated with damaging computers or information networks by one country or international organization against another (Kumar et al., 2016).
The rise and expansion of the cybercrime activity and damages lead to the natural creation of cybersecurity
teams among organizations. “Cybersecurity refers to the techniques, processes and methodologies
concerned with thwarting illegal or dishonest cyber-attacks in order to protect one or more computers on
any type of network from any type of damage” (Mahmood & Afzal, 2014, p.130). The main objectives of cybersecurity are to safely acquire and exchange information, find vulnerabilities in applications, prevent and control information access, and protect confidential information (Mahmood & Afzal, 2014).
5
2.2.
T
YPES OFC
YBERA
TTACKSWith the steep growth of global internet usage, so did the variety, complexity and frequency of the cyber attack events (Mahmood & Afzal, 2014). Among the known and documented cyber attacks, seven overall groups of cyber attacks were identified as relevant for this work by the security team that supported it: i) Malware; ii) Denial-of-Service (DoS)/ Distributed Denial-of-Service (DDoS); iii) Application Layer Attacks; iv) User Attacks; v) Information Gathering; vi) Man-in-the-Middle; and vii) Phishing.
i. Malware - Is a software that is intentionally developed to perform malicious activities. The damage can be from stealing sensitive information from the victim to total destruction of the operating system (OS) including all the stored files. The most known types of malware are virus, trojan, worms and spyware (Mahmood & Afzal, 2014). As an example, a known worm called Stuxnet was a malicious software developed by the national-level intelligence agency of the United States department of defense, the National Agency Security (NSA), which destroyed 984 uranium enriching centrifuges in 15 different Iranian facilities.
ii. DoS/DDoS - A Denial of Service attack (DoS) and Distributed Denial of Service attack (DDoS) have the objective to prevent the usage of any type of service. There are many ways to perform a DoS attack. The most known are volumetric attacks (Viegas, Santin, & Oliveira, 2017), where the attacker floods the victim server with requests to be processed and starts to drop new requests in order to process the others. Likewise, the DDoS (Nikolskaya, Ivanov, Golodov, Minbaleev, & Asyaev, 2017) are very typically performed as volumetric attacks. But there are also other types of attacks that exploit the resources of the computer, such as CPU or memory that result in a DoS of the victim server (Dolev, Elovici, Kesselman, & Zilberman, 2009).
iii. Application Layer Attacks - This type of attacks depends on the application that the service is using, it can be an HTTP server, a Mobile application or even a Database. Depending on the application, there are many types of attacks that can damage the owner of the service or even the visitors. Some types of attacks are SQL injection, malicious ads, redirection to malicious websites, command injection, etc. (Mahmood & Afzal, 2014). As an example, the attacker could inject a command into the service that handles the client inputs from a mobile application and every time a client tries to validate the password, a background communication would be established to the attacker to retrieve the inputted password from the victim.
iv. User Attacks - These types of attacks are divided into two types (Viegas et al., 2017): i) Remote to Local (R2L) where an attacker gains access to a victim server by exploiting remotely an unpatched vulnerability, to later install a backdoor so that still after the service patches the vulnerability, the
6 attacker persists access to the service. One known vulnerability is Shellshock where an HTTP server did not validate correctly the user inputs and the attacker could inject commands directly to the victim server. The other attack is User to Root (U2R), where the attacker already has access to the victim account but has limited permissions to perform operations on the system. Therefore, he uses system vulnerabilities, such as buffer overflow, to escalate privileges to obtain administrator privileges. v. Information Gathering - An attacker before starting an attack, starts by studying its target. This phase
is critical for every attacker because they only need to have success once and with minimal impact and track possible. To do so, the attacker starts by gathering information from the target (Viegas et al., 2017). This process can be done in a passive or active way. In a passive way, it can search for information without requesting any information directly to the system, searching for the workers in social networks (such as Linkedin), or searching engines (such as Google), to later perform phishing attacks. In an active way, the attacker can validate if the service has some network ports open, try to find some private services that are not supposed to be used publicly, etc. If the attacker is already inside the network, he can passively sniff the network to find any sensitive information, or he can actively map all the network to find the weakest link to later steal sensitive data (Martorella, n.d.). vi. Man-in-the-middle - Are attacks where, as the name implies, an attacker is in the middle of the
communication between the client and the server. With these attacks, a client assumes that he is interacting directly with the intended service, but the attacker “in the middle” is eavesdropping or
changing the information to their benefit (Luettmann & Bender, 2007). Typically, such an attack could be launched through vulnerabilities in the communication protocols used or even by a misconfiguration on the services.
vii. Phishing - Is a type of attack where the attacker intends to fraud the victim by presenting some type of information, normally an email, that is very similar to legitimate services and steal the credentials or install some backdoor in the computer (Mahmood & Afzal, 2014). One common example is emails from a suppose Apple company that informs the victim that someone has accessed the phone and they need to verify if you are the real user of the phone, so they ask you the password, which will be delivered to the attacker. The most dangerous type of phishing is called, Spear phishing (Jenab & Moslehpour, 2016). In this type, the attacker knows the victim and tries to take advantage of information that he is expecting, for example, a document that the victim needs to read before some meeting in the next day.
7
2.3.
C
ONSEQUENCES OFC
YBERCRIMEIn 2011, the Department of Commerce Internet Policy Task Force of the United States of America pointed the exponential growth of cyber attacks on commerce, business and government agencies (The Department of Commerce Internet Policy Task Force, 2011). The number of cyber attacks and the estimated damage have been increasing consistently year after year until the year of 2014, which has been
named as the “the year of cyber-attacks” (Bendovschi, 2015). “Some estimates suggest that, in the first
quarter of this year [2011], security experts were seeing almost 67,000 new malware threats on the Internet every day. This means more than 45 new viruses, worms, spyware, and other threats were being created every minute –more than double the number from January 2009” (The Department of Commerce Internet Policy Task Force, 2011, p.ii).
Following the summary statistics of Hunt (2019) for the validation of compromised accounts in a data breach, recommended by the SOC team, seven of the top ten largest data breaches from cyber attacks are, at the time of the development of this work, registered between 2016 to 2019 with more than 3.2 billion accounts breaches, being the worst attack registered in January of 2019 with more than 772 million accounts breached from a list of 2.7 billion records. Which supports the severity and scalability of the damage volumes involved as time passes by.
Even though the numbers of reported damages are real, the true damage quantification remains uncertain or undisclosed as not only material costs in equipment and revenues are negatively affected. Three major factors can be identified:
▪ The organizational brand image perceived by the customer can be irreversibly damaged. Customer’s trust and value are disrupted and comprised with unauthorized access of customer’s personal
information (name, personal identification, phone numbers, e-mail addresses, usernames and passwords, financial data) being extracted or publicly exposed (Bendovschi, 2015);
▪ As a consequence of the previous point, organizations are tempted to deny security exposures in order to minimize the damage and preserve a publicly positive sentiment (Center for Strategic and International Studies, 2014);
▪ The inability for most companies to discover that they have been compromised or data breached internally (Center for Strategic and International Studies, 2014). In fact, reports of security institutes and companies have estimated that only almost 30% of the organizations are able to do it by themselves and take an average of 205 days before detecting the presence of certain threats on their network (Wu, Lee, Wei, Hsieh, & Lai, 2017).
8 Among the business areas affected by this threat, one of the most sensitive and influential is the financial sector. Nowadays, this area is heavily dependent on the computer networks systems, relying on its technology for data communications and commercial purposes (Kumar et al., 2016). However, it is the financial sector that provides the best data on cybercrime because this sector is regulated, focused on cybersecurity and can easily measure their loss (Center for Strategic and International Studies, 2014). Although the several obstacles to quantify the value of the damage, cybercrimes cause a substantial loss to the world economy. There are different approaches to calculate the costs caused by cybercrime. Comparing with the gross domestic product (GDP), the Center for Strategic and International Studies (2014) refers that
cybercrime may be responsible for loss up to 1.5% of a country’s GDP. The Center for Strategic and
International Studies (2014) also reports different estimates for different types of countries: high-income countries can lose on average as much as 0.9% of GDP, while in developing economies the losses averaged 0.2% of GDP, being the average loss among all countries (that it was possible to obtain data) of 0.5% of GDP. The countries of G20, which produce the highest volume of wealth in the world, also suffer the greatest losses related to cybercrime and cyber espionage (Center for Strategic and International Studies, 2014). “The rate of loss from cybercrime was roughly the same (as a percentage of GDP) among three of
the four largest economies in the world (the US, China, and Germany). These countries lost more than $200
billion to cybercrime” (Center for Strategic and International Studies, 2014, p.9). Thus, wealthier countries and business in North America, Europe, and Asia are more likely to suffer attacks, since they provide bigger returns than poor targets (Center for Strategic and International Studies, 2014).
In 2014, the Center for Strategic and International Studies (2014, p.6) used a different approach to estimate the annual global cost of digital crime and intellectual-property theft: “If we used the loss by high-income countries to extrapolate a global figure, this would give us a global total of $575 billion. Another approach would be to take the total amount for all countries where we could find open source data and use it to extrapolate global costs. This would give us a total global cost of around 375 billion dollars. A third approach would be to aggregate costs as a share of regional incomes to get a global total. This would give us an
estimate of $445 billion”. According to these statistics and knowing that internet economy generates profits between 2 trillion to 3 trillion dollars each year, cybercrime is responsible for loss between 15% to 20% of the wealth generated by the internet (Center for Strategic and International Studies, 2014).
Although none of these ways to calculate the global cost of cybercrime and cyber espionage is ideal, they
are methods for estimating it. While reporting and data collection don’t improve, the estimation costs will
not improve either (Center for Strategic and International Studies, 2014). On the other hand, it is also difficult to calculate the real costs of cybercrime and cyber espionage, since there are intangible costs inevitable associated (Center for Strategic and International Studies, 2014).
9 Another problem is the difference between the value of what cybercriminals steal and the profit they can make with that (Center for Strategic and International Studies, 2014). “It is harder (in some cases, much harder) to monetize the result of a successful hack than it is to the hack itself” (Center for Strategic and International Studies, 2014, p.6).
In 2016, in financial services, the three more frequent patterns of cyber attacks were DDoS (the most common incident type), web application attacks, and payment card skimming (Verizon, 2017). The DDoS attacks are more frequent in organizations which use the internet to do business or communications (Verizon, 2017). The estimates point to a loss of revenue due to DDoS attacks over $10,000 per hour ($240,000 per day) among business organizations and over $100,000 per hour ($2,400,000 per day) for retailers (Neustar®, 2012). In the financial industry, 82% of companies lose more than $10,000 per hour during a DDoS attack (Neustar®, 2012; Verizon, 2017).
The increase of threats of internet forces the security policies, technologies and procedures to develop quickly and earlier, in order to prevent cyber attacks (The Department of Commerce Internet Policy Task Force, 2011). Cybercriminals are becoming more proficient and are constantly creating new ways to attack people, companies (in particular financial institutions) or countries (Rajan et al., 2017). “Protecting security of consumers, businesses and the internet infrastructure has never been more difficult” (The Department of Commerce Internet Policy Task Force, 2011, p.ii). In 2014, wide organizations such as Apple’s iCloud, Op
Albatross ATM thefts, Yahoo, PlayStation Network, and Microsoft Corporation suffered cyber attacks (Saad et al., 2016). Therefore, firms invest in different strategies to detect and prevent cyber attacks, through the acquisition of software and the creation of network security specialist teams to protect their networks (Jenab & Moslehpour, 2016). Therefore, it's estimated that in 2013 it was spent with cybersecurity products and services more than 58 billion dollars (Center for Strategic and International Studies, 2014).
2.4.
C
YBERCRIMEA
WARENESSIn recent years, several countries and organizations around the world have been increasing their awareness and concerns with cybercrime activities. In 2000, the Federal Bureau of Investigation (FBI) created a platform for the public in the United States known as the Internet Crime Complaint Center (IC3), responsible for receiving victim reporting crime complains as well as a public awareness channel for the population (Internet Crime Complaint Center, 2016). The annual Internet Crime Report published in 2016 by the agency, which provided some statistics from 2012 to 2016, registered over 1.4 million complains (on average 280.000 per year) and a total report loss of over 4.63 billion dollars, increasing year after year (Internet Crime Complaint Center, 2016). The report expresses concern with the real numbers and losses involved by referring that the reported figures are estimated to represent only 15% of the victims in the
10 United States (US) territory and an even smaller number when compared with the number of victims worldwide (Internet Crime Complaint Center, 2016).
In 2001, the Council of European created the first draft of the first international legislation against cybercrime, the Convention on Cybercrime (COC) (Hui, Kim, & Wang, 2017). The legislation sought international cooperation to fight cybercrime activities, promoting mutual assistance and providing legal framework to handle “any infringement against the confidentiality, integrity, and availability of computer
data and systems, including common offenses such as distributed denial of service (DDoS) or malware
attacks” (Hui et al., 2017).
In 2017, the World Economic Forum published its annual Global Risk Report (World Economic Forum, 2017). The report placed the technological dangers associated with large scale cyber attacks and massive incident of data fraud/theft, respectively in 6th and 5th places, in the list of risks most likely to occur in the next ten years. The reported technological risks predicted three important scenarios: i) a long-term pattern associated with the rising cyber dependency, expecting consequently an increase in the number of information infrastructure and network vulnerabilities; ii) widespread chaos, associated with large economic damages, geopolitical tensions or loss of internet trust due to large-scale cyber attacks or malware usage; and iii) unprecedented scale of incidents of data fraud/theft (World Economic Forum, 2017). Security concerns related to cyberwar and terrorism were also mentioned in the report, concerned with the usage of the cyberspace as a new domain of conflict used by nations and terrorist groups. The rising geopolitical tensions and violent extremist groups, associated with the rise of cyber attacks, major data breaches and hacks has led many countries to adopt new security measures and counterterrorism laws (World Economic Forum, 2017).
On the same year, Alhawamdeh (2017) published a research work proposing the development of a national institutional level information sharing framework to fight the cybercrime. The authors pointed out the existing cybersecurity information gap between countries, caused by the inexistence of a global framework platform for information exchange. Faced with information leakage dangers, each local authority works on their own in order to protect and manage their own information. The framework would provide the first layer of security protection tools used by countries, in a balanced commitment between security and data leakage.
11
3.
LITERATURE REVIEW
3.1.
B
IGD
ATAA
NALYTICSNowadays, Machine Learning and Big Data topics are subjects of great interest and focus among the scientific community (Nair, Shetty, & Shetty, 2017). A great variety of works developed have been continuously showing its potential and a wide range of applications.
Nair et al. (2017) have shown how predictive modelling of sensor data related to Oil and Gas Company can be performed through the Machine Learning platform H2O. In the same work developed by Nair et al. (2017), the authors discussed the usage of the online logistic regression for detection of phishing URL (Uniform Resource Locator), using the Hadoop framework and the scalable Machine Learning algorithms of Apache Mahout. The work also used Apache Storm to streaming data processing and WEKA classifiers for Machine Learning, as a phishing URL detection system. The social media data from social platforms, like Twitter, have been analyzed using Machine Learning in multiple research works with the objective of extracting useful information such as sentiments and tendencies of their users towards other persons or products, filtering of spam, finding trending topics, detecting real-time events like earthquakes, or personality prediction (Nair et al., 2017).
The constant growth on the number of internet usage has led to an exponential increase in network traffic (Kulariya, Saraf, Ranjan, & Gupta, 2016). New challenges have risen as the former tools and techniques are no longer efficient in processing the required volume of data (Gupta & Kulariya, 2016). New frameworks and software, like Hadoop and Spark (Kulariya et al., 2016), have been developed to handle the Big Data processing problem and provided the conditions for what is known as Big Data Analytics.
Big data Analytics is the combination of three different but interconnected scientific areas: i) Big Data Applications, ii) Data Mining and iii) Machine Learning (Epishkina & Zapechnikov, 2016). The first area, the Big Data applications, is a combination of a series of tools, techniques and approaches to effectively handle
the current information explosion commonly described by the “three V” of Big Data: Volume, Velocity and Variety (Breier & Branišová, 2017). The concept behind the developed applications is heavily influenced by the parallel processing architecture of the Hadoop MapReduce model to process large datasets while handling parallelism challenges such as load balancing, network performance or fault tolerance (Epishkina & Zapechnikov, 2016). Most of the technologies around Big Data use or are influenced by software frameworks and libraries of the Hadoop and Spark projects under the development responsibility of Apache
(Breier & Branišová, 2017; Epishkina & Zapechnikov, 2016).
The second area, Data Mining, is the name given to a series of methods and techniques used combined in a semi-automatic process of knowledge extraction from data (Breier & Branišová, 2017; Epishkina &
12 Zapechnikov, 2016; Fayyad, Piatetsky-Shapiro, & Smyth, 1996). Data Mining techniques result from a combination of various fields of study such as statistics, Machine Learning and database theory (Epishkina & Zapechnikov, 2016). Most of Data Mining methods have in its core the applications of Machine Learning algorithms and statistics methods to perform classification, clustering and regression tasks for knowledge extraction from data (Epishkina & Zapechnikov, 2016; Fayyad et al., 1996). Fayyad et al. (1996) define six of the most common Data Mining tasks, each described on Appendix 9.1: i) Association rule learning; ii) Clustering; iii) Classification and Regression; iv) Anomaly Detection; and v) Summarization.
According to Fayyad et al. (1996), based on web pools votings over the years, one of the main Data Mining process methodologies is the Cross-Industry Standard Process for Data Mining (CRISP-DM) (IBM, 2011). This process is comprised by six iterative steps, detailed on the methodology chapter: i) Business understanding, ii) Data Understanding, iii) Data Preparation, iv) Modelling, v) Evaluation and vi) Deployment (IBM, 2011).
The third area, Machine Learning, is a field of study focused on the development of learning algorithms capable of performing tasks of pattern recognition, data prediction or other decision-making tasks under uncertainty, without being explicitly programmed to do so (Epishkina & Zapechnikov, 2016; Murphy, 2012). As defined by Mitchell (1997), “A computer program is said to learn from experience E with respect to some
class of tasks T and performance measure P, if its performance at tasks in T, as measured by P, improves
with experience E”. The algorithms are developed from feeding models with a dataset as input to make data-driven decisions as outputs (Epishkina & Zapechnikov, 2016).
Two main types of algorithms of Machine Learning are usually defined: i) predictive models, also known as supervised learning algorithms, and ii) descriptive models, also known as unsupervised learning algorithms (Murphy, 2012). The first ones, the predictive models, use as input a set of training examples previously labeled to perform predictions tasks over new and unlabeled examples, such as classification (if the target or labels are categorical or nominal values) or regression (if the target or labels are real-valued scalars) (Mitchell, 1997). The second ones, the descriptive models, have no targets to train using examples, instead, they use unlabeled data with the objective of identifying relevant patterns and structures among the data in tasks also known as knowledge-discovery (Mitchell, 1997; Murphy, 2012). A classic example of the usage of unsupervised learning algorithms is the clustering methods (Murphy, 2012).
The combination of the three areas provide Big Data analytics tools that allows large scale data collection, storage, processing and analysis using various techniques that fit to solve modern days problems in many areas from business, finance, healthcare, among many others, and with relevance in the information security and computer systems security area (Epishkina & Zapechnikov, 2016).
13
3.2.
C
YBERSECURITYA
NALYTICSThe development of cybersecurity mechanisms to overcome increasingly complex threats issues has been a subject of increasing interest over the years, not only among organizations but also among the scientific community (Joseph, Laskov, Roli, Tygar, & Nelson, 2012). Over the years, an extensive variety of approaches, frameworks, techniques and algorithms have been developed and simulated for cybersecurity. The methods vary from information encryption, contents and services access control, and intrusion detection systems (IDS) among many others (Kulariya et al., 2016).
Some of the most interesting areas of application for Big Data analytics to cybersecurity problems are: i) Intrusion detection systems (IDS) and ii) Security information and event management (SIEM); among many other technologies (Epishkina & Zapechnikov, 2016).
The background for this work is the result of the combination of three interconnected areas of study related to security. The first area, where most of literature and investigation can be found, is the traditional IDS and the works developed using Data Mining techniques, with focus on supervised learning. The second area presents some of the approaches developed by IDS and Big Data analytics applications. The third and final area of interest is where the least amount of contributions is found, are the studies and works related to the development of intrusion detection on SIEM through supervised learning techniques to support system security. None of the studies in each of the areas completely fulfils the scope of this work but the three complete each other for this solution.
The rationale behind this organization of ideas is related to the objective of this work, the development of a detection model that is not intended to be used as a prevention method but a reactive one. The model developed in this work does not intend to substitute or prove its superiority in any way with the existing security systems, as each tool works as a piece of the security framework in an organization, and each piece is efficient on the purpose that it was assigned.
As security breaches are bound to happen in a real-world scenario (Quick, Hollowood, Miles, & Hampson, 2017), where client services and security restrictions are a delicate balance, the objective of this work is to fill an organizational need through the support of their security team, technically referred as Security Operation Center (SOC), on their investigations efforts, through one additional security layer, a threat detection system, over the data that has already been processed by the SIEM.
3.2.1.
Intrusion Detection Systems (IDS)
The IDS are security software tools typically focused on detecting attacks or malicious traffic, classifying them as potential security threats or nonstandard behaviour events through the monitorization of the network, known as Network Intrusion Detection Systems (NIDS), and system activities or policy violations,
14 known as Host Intrusion Detection Systems (HIDS). In the case of the NIDS scenario, IDS can prevent the packet from being delivered or can alert or notify the SOC (Epishkina & Zapechnikov, 2016; Viegas et al., 2017). Traditionally, an IDS inspect the packet payload traffic in a network searching for potential security breaches or abnormal behaviour, usually supporting the antivirus, firewall (FW), access control and other systems in the security of the whole ecosystem. In the case of the HIDS scenario, the tools are capable of providing abnormal network usage recognition through the analysis of stored system logs (Fitriani, Mandala, & Murti, 2016).
According to Viegas et al. (2017), the typical IDS architecture results from the combination of four modules: i) Event gatherer – Responsible for reading and storing events from the system or network environment assigned; ii) Preprocessing – Responsible for all the work related with the parsing, transformation and feature extraction of the collected logs in order to ready them for the detection engine; iii) Detection - Module responsible for the previously processed event analysis for intrusion identification, classifying them as normal or as potential intrusion effort events; and iv) Alert – Module accountable for acting upon the events identified as potential intrusion, usually in the form of a generated alert or notification.
Several authors identify the detection methods of an IDS in two main distinct classes: i) anomaly-based, and ii) signature-based (Kulariya et al., 2016; Viegas et al., 2017). The first class, the anomaly-based detection, also known as behavior-based detection, is a method focused on the identification of abnormal behavior of the monitored traffic patterns typically through the comparison against previously analyzed traffic activities validated as normal (Fitriani et al., 2016; Kulariya et al., 2016; Viegas et al., 2017). This approach provides an effective advantage in the detection of new and unknown attacks through the deviation from normal traffic pattern behaviour (Fitriani et al., 2016). Fitriani et al. (2016) refer to the benefits of this approach in the prevention of DoS-based attacks, intrusion by a legitimate user or even Trojan horses. However, the downside of this method stands on the high number of misclassified anomaly events due to changes of the normal traffic pattern, resulting consequently in high false positive generated alarms (Fitriani et al., 2016).
The second class, the signature-based method, also known as misuse-based method or even knowledge-based method, is an approach of intrusion detection performed through the comparison of each of the events with a regularly updated database with information related with intrusion type patterns previously identified by a security expert (Fitriani et al., 2016; Kulariya et al., 2016; Viegas et al., 2017). The events with a matched signature with one in the signature database of threats are classified as an intrusion attempt (Viegas et al., 2017). This method is effective against known and stored intrusion types but is not able to generalize and identify a new threat, leaving the system exposed to new threats until the database is updated (Fitriani et al., 2016; Viegas et al., 2017). Additionally, the IDS can only inspect the traffic efficiently
15 if it is not encrypted. Most of the times the corporates cannot decrypt the traffic before analyzing with the IDS, therefore, what is analyzed is only the unencrypted traffic.
3.2.1.1.
Data Mining on Intrusion Detection Systems
The IDS has been a research topic of great interest among the cybersecurity of network systems community (Kulariya et al., 2016). With the objective of suppressing the traditional disadvantages of the IDS, several works have proposed solutions that combine the previously functionalities and advantages of the detection systems with Data Mining and Machine Learning approaches. Epishkina and Zapechnikov (2016) suggests, as an example, the usage of Data Mining methods for intrusion detection in several potential ways, in which the following stand out: i) Classification; iii) Clustering; and iii) Anomaly Detection.
The first method,, the classification, is described by Epishkina and Zapechnikov (2016) as an evident intrusion detection method. Through the collection of known intrusion attempts, it is possible to train models to be able to classify new threats from new unclassified instances. The author suggests the potential usage of a decision tree, neural networks, Bayesian classifiers, support vector machines (SVM) and genetic algorithms. Breier and Branišová (2017) use, as the basis for its work, comparative studies of classification tasks over log files using decision trees, neural network, Naive Bayesian and Support Vector Machine. The second method, clustering, is described by Epishkina and Zapechnikov (2016) as a useful approach with potential applications, for example, on the creation of intrusion signatures clusters merged with alerting functions in order to produce an alerting system capable of identifying potential attacks whose behaviour is similar with the created clusters.
The third method, anomaly detection, is one of its most interesting applications for intrusion detection as an unsupervised learning approach, using clustering and density algorithms to define patterns of events with similar behaviours and assumed to fit normal behaviour. New instances unfitting or too sparse from any of the previously created clusters will be labelled as abnormal events and potential threats. Epishkina and Zapechnikov (2016) suggest the application of these methods in network traffic data packet headers, such as Ethernet, Internet Protocol (IP), Transmission Control Protocol (TCP), as features for the definition of attack-free clusters. Posterior new traffic packets not similar to any of the clusters would be considered anomalous.
Several authors explore in their works the potentials and advantages in the usage of Data Mining and Machine Learning methods applied to IDS. Kulariya et al. (2016) argue that the variability and speed in which a lot of new attacks are generated every day, defines two fundamental characteristics of any IDS: adaptivity and fast detection capabilities, in order to detect new attacks. The usage of Data Mining and Machine Learning methods are able to provide these critical characteristics to the IDS (Kulariya et al., 2016).
16 Through pattern extraction of normal and malicious data records, it is possible to create and train different classifiers capable of identifying different types of attacks (Kulariya et al., 2016).
In 2012, Nadiammai and Hemalatha (2012) referred, the already mentioned, potential threats that came along with the increasing usage and evolution of the internet. The work had the objective of applying Data Mining algorithms to intrusion detection. The author described the comparative study of several rules and function-based classifiers performances, namely Part, Ridor, NNge, DTNB, JRip, Conjunctive Rule, One R, Zero R, Decision Table, RBF, Multi-Layer Perception and SMO algorithms, through the metrics of accuracy, specificity and sensitivity over the KDDCUP’99 dataset. The work concluded that the sequential minimal optimization algorithm (SMO) and the NNge algorithms where the most promising ones regarding the dataset used and performance metrics indicated.
In 2013, Chauhan, Kumar, Pundir, and Pilli referred the importance of the potential role that Data Mining approaches could provide on the development of IDS over network traffic and presented a comparative study on the ten most promising classification algorithms, selected out of the twenty most widely used classification algorithms. The work assessed the accuracy, specificity and sensitivity, and training time of J48, BayesNet, Logistic, SGD, IBK, JRip, PART, Random Forests (RF), Random Tree and REPTree algorithms, using the NSL-KDD dataset. The study concluded that the Random Forests algorithm had the best performance with respect to accuracy, specificity and sensitivity, while the IBK algorithm took the least time to train. The author left as a future work the possibility of combining different Data Mining algorithms and data reduction techniques to reduce the rate of false negatives (FN) and increase the overall accuracy (Chauhan et al., 2013).
On the same year, Nagle & Chaturvedi (2013) presented a work exploring the combination of an IDS with the implementation of a classifier algorithm for the security network detection activities. The work compared the implementation several classifier algorithms, Naïve Bayes, Bagging, Boosting, Stacking, and J48, on different attack types, using the NSL-KDD dataset and the feature reduction technique of the information gain (IG). The authors concluded that, depending on the attack types, the J48 classifier presented the best performance in the intrusion detection tasks, while the Stacking classifier presented the worst.
In similar but improved approach, Prachi (2016) compared a wide variety of classification techniques in order to identify a Machine Learning algorithm capable of providing both high accuracy and real-time system application for intrusion detection on network traffic. The author explored the optimization of the IDS to face against the increasing volumes of network data and the complex nature of intrusions. As such, the work sought for maximum accuracy and minimum model building time in order to be able to perform in real-time IDS. The work evaluated fifteen different classification algorithms, such as Naïve Bayes, Logistic
17 Regression, Jrip, J48, Random Forest, Random Tree, among many others, and the KDDCUP’99 and NSL-KDD dataset. The author concluded for the algorithms tested and the indicated datasets, that the Random Forests algorithm had the highest detection rate and lowest false alarms in comparison to other algorithms. However, it also took significant time to train, making the Random Tree the chosen algorithm for its significant high detection rate and minimum model building time, to be implemented as a real-time IDS. The author focused on the training time of the algorithms and left as a future work the real-time implementations and performance assessment.
However, early detection is not always guaranteed against security threats as security breaches keep occurring in a never-ending spiral of complexity and variety of approaches either from the perpetrators and security countermeasures.
3.2.1.2.
Big Data Analytics on Intrusion Detection Systems
As referred before, the exponential increase on the internet usage in the present days as lead network traffic data sizes and variety to a point where tradition data processing engines can no longer handle it efficiently (Gupta & Kulariya, 2016). These challenges are particularly critical in sensitive areas such as the cyber-security. Tradition IDS or even anti-virus can be exploited by perpetrators with ease due to the plain amount of network traffic exchanged every day (Mahmood & Afzal, 2014).
Mahmood and Afzal (2014) identify some of the main problems related to cybersecurity and the Big Data challenges:
▪ Organizations growth in products and services using the internet as a commercial platform, through computers, mobiles or even clouds, lead to the natural increase in data and information exchanged between clients and organizations and between organizations. This ease of data accesses also led to more and varied network vulnerabilities and thus contributing to the cyber attacks.
▪ The increase in data volume, variety and complexity as provided ground for the increase in hacking skills with new approaches and new opportunities, making traditional security systems inefficient (e.g. the traditional signature-based tools).
▪ The exponential growth in the volume of today’s traffic network data lead to two scenarios, either the
excessive amount of security information alerts to be handled by security experts or only a small slice of the security information is collected for analysis.
▪ Traditional computer hardware and software architectures are not efficient to process and analyze the variety, complexity and speed in which Big Data transacts from different sources, different storages and different machines.
18 As referred previously, several authors argue that cybersecurity detection systems should not only be accurate and adaptive but fast and efficient in dealing with the variable nature, complexity and size of the network traffic (Gupta & Kulariya, 2016; Kulariya et al., 2016).
In 2015, the online publication of Breier and Branišová (2017) presented a work exploring the possibility of exploiting network activity log files from various network devices to identify security breaches. The authors proposed the implementation of Data Mining techniques for dynamic rule creation in an IDS, supported by the parallel storage and processing of the Apache Hadoop framework in order to handle the huge amount of data containing within the files. The final result demonstrated that the model was capable of detecting new types of intrusions with an acceptable error rate while keeping competitive speeds when compared with the FP-growth and apriori algorithms.
In the year of 2016, Gupta and Kulariyas proposed a framework for fast and efficient cybersecurity network intrusion detection using Apache Spark, an open source cluster computing platform designed for parallel processing, and its MLlib library to perform classification and performance assessment tasks over the logged network traffic data. The work compared two feature selection methodologies, correlation-based feature selection and hypothesis-based feature selection as well as five Machine Learning algorithms for the classification problem: i) Logistic regression, ii) SVM, iii) Random forest, and iv) Gradient Boosted Decision trees.
In the same year, the size and complexity of network traffic lead Kulariya et al. (2016) to explore a Data Mining solution capable of supporting real-time intrusion detection. The author argued that the Machine Learning algorithms implemented should not only be efficient and accurate on detection of attack traffic but also fast and scalable. The work used two correlation-based feature selection and chi-squared feature selection and compared the performance of five classification algorithms namely the Logistic regression, SVM, Random forest, Gradient Boosted Decision trees and Naive Bayes. The comparison used the Apache Spark framework for the parallel processing and the real-time network traffic dataset of KDDCUP’99. The algorithms were evaluated not only in the metrics of accuracy, sensitivity and specificity but also in its training and prediction time. The authors concluded that the Random Forests algorithm provided the best accuracy, sensitivity and specificity results, while the Naive Bayes algorithm provided the worst specificity performance but required the least time to train.
3.2.2.
Security Information and Event Management System (SIEM)
In 2016, Suh-Lee, Jo, and Kim referred the importance of the exponentially growing messages generated by the computer systems and applications in a modern computing environment and their potential as a source of information useful for advanced threat detection (Suh-Lee et al., 2016). The authors give
19 emphasizes to the volume, variety, and complexity of data generated in logs as a hard and complex task for security analysts. Breier and Branišová (2017) referred to the size of log data generated every day is expected to grow more and more as time passes by and technology continues to evolve.
The SIEM are software solutions developed as a natural response for the great amounts of log data generated every day throughout the complexity of interconnected and distributed computer systems that support organizations (Suh-Lee et al., 2016).
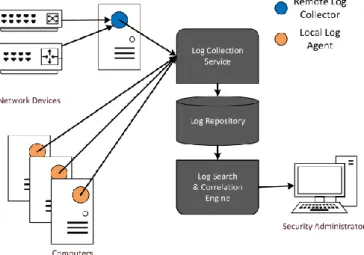
Figure 3.1 - SIEM Architecture (Suh-Lee et al., 2016)
The SIEM are solutions designed to (Epishkina & Zapechnikov, 2016; Lee, Kim, Kim, & Kim, 2017; Suh-Lee et al., 2016): i) Centralize and manage system-generated log messages, also known as Syslog data, in one central location through log collection and aggregation from multiple data sources; ii) Preprocessing (parsing and normalizing log data); iii) Log storage and retention of historical data for a specified period of time (particularly useful for organizations due to legal requirements to which they are subjected in the retention of electronic records of transactions); iv) Search log data; v) Alerting and dashboarding services; and vi) event correlation of log messages.
These tools are capable of providing security support through the correlation of the generated logs such as the FW, IDS, anti-malware systems, authentication services, HTTP servers, corporate computers, and others that are deployed at both on the host and on network domains (Epishkina & Zapechnikov, 2016). According to Suh-Lee et al. (2016) the correlation engine is capable of supporting the security systems through application of predefined correlation rules on logs for threat and anomaly detection, taking advantage of the centrality and normality of the logs collected, in order to gain better situational awareness of the
intruder’s attempts in the systems (Suh-Lee et al., 2016).
The work presented by Suh-Lee et al. (2016) identifies some of the SIEM’s technology and usage advantages
and disadvantages. The author highlights the importance of this technology as the current state-of-art in its main functions of log management, aggregation and storage. It is also capable of providing important
20 support to the security systems through the effective identification of some potential t