SYNCHROPHASORS: MULTILEVEL ASSESSMENT AND DATA QUALITY IMPROVEMENT FOR ENHANCED SYSTEM RELIABILITY
A Dissertation by
TAMARA BECEJAC
Submitted to the Office of Graduate and Professional Studies of Texas A&M University
in partial fulfillment of the requirements for the degree of DOCTOR OF PHILOSOPHY
Chair of Committee, Thomas Overbye Committee Members, Katherine Davis
Alexander Sprintson Erick Moreno-Centeno Head of Department, Miroslav Begovic
May 2019
Major Subject: Electrical Engineering
ii ABSTRACT
This study presents a comprehensive framework for testing and evaluation of Phasor Measurement Units (PMUs) and synchrophasor systems under normal power system operating conditions, as well as during disturbances such as faults and transients. The proposed framework suggests a performance assessment to be conducted in three steps: (a) type testing: conducted in the synchrophasor calibration laboratory according to accepted industrial standards; (b) application testing: conducted to evaluate the performance of the PMUs under faults, transients, and other disturbances in power systems; (c) end-to-end system testing: conducted to assess the risk and quantify the impact of measurement errors on the applications of interest.
The suggested calibration toolset (type testing) enables performance characterization of different design alternatives in a standalone PMU (e.g., length of phasor estimation windows, filtering windows, reporting rates, etc.). In conjunction with the standard performance requirements, this work defines new metrics for PMU performance evaluations under any static and dynamic conditions that may unfold in the grid. The new metrics offer a more realistic understanding of the overall PMU performance and help users choose the appropriate device/settings for the target applications. Furthermore, the proposed probabilistic techniques quantify the PMU accuracy to various test performance thresholds specified by corresponding IEEE standards, rather than having only the pass/fail test outcome, as well as the probability of
specific failures to meet the standard requirements defined in terms of the phasor, frequency, and rate of change of frequency accuracy.
Application testing analysis encompasses PMU performance evaluation under faults and other prevailing conditions, and offers a realistic assessment of the PMU measurement errors in real-world field scenarios and reveals additional performance characteristics that are crucial for the overall application evaluation.
End-to-end system tests quantify the impact of synchrophasor estimation errors and their propagation from the PMU towards the end-use applications and evaluate the associated risk.
In this work, extensive experimental results demonstrate the advantages of the proposed framework and its applicability is verified through two synchrophasor applications, namely: Fault Location and Modal Analysis. Finally, a data-driven technique (Principal Component Pursuit) is proposed for the correction and completion of the synchrophasor data blocks, and its application and effectiveness is validated in modal analyzes.
iv DEDICATION
ACKNOWLEDGEMENTS
First, I would like to express my sincere gratitude and deepest respect to my advisor, Dr. Thomas Overbye, for his endless encouragement, guidance, and support throughout the course of this research. His knowledge and patience are invaluable to the completion of this work. Working with Dr. Overbye during the last year is my greatest honor.
I also wish to thank my committee members, Dr. Katherine Davis, Dr. Erick Moreno-Centeno, Dr. Alexander Sprintson, and Prof. Sunil Khatri, for their suggestions, time, and support. Special thanks to Dr. Harold Kirkham from Pacific Northwest National Laboratory (PNNL) for all the informative discussions and his helpful advices regarding my research.
Thanks also go to my friends and colleagues, Ms. Ana Maria Ospina Sierra, and other group members for their help and support throughout my graduate study.
I am also grateful to the department faculty and staff for making my time at Texas A&M University a great experience, particularly Melissa Sheldon, Andrea Kishne, Katie Bryan, Jeanne Prestwood, Wayne Matous, Rebecca Rice, Holley Toschlog, Anni Brunker, and Alexandra Bello.
Finally, I wish to thank my sister, and my grandmother for their unconditional love, patience, and encouragement.
vi
CONTRIBUTORS AND FUNDING SOURCES
This work was supervised by a dissertation committee consisting of Professors Thomas Overbye, Katherine Davis, and Alexander Sprintson of the Department of Electrical and Computer Engineering, and Professor Erick Moreno-Centeno of the Department of Industrial and Systems Engineering. Part of the work was supervised by Professor Mladen Kezunovic of the Department of Electrical and Computer Engineering. All work conducted for the dissertation was completed by the student independently.
My research was mainly funded by financial resources from two projects. One is funded by Texas A&M – CAPES: “Development of Advanced Open-Source PMU/PDC Lab and Applications with Synchronized Data Obtained from Simulation and Actual Power Network”. The other is funded by Power System Engineering Research Center (PSERC): “High Impact Project Title: Life-cycle Management of Mission-Critical Systems through Certification, Commissioning, In-Service Maintenance, Remote Testing, and Risk Assessment.”
This work was made possible in part by a Thomas Powell’62 fellowship from Texas A&M University and a dissertation research fellowship from DEED (Demonstration of Energy & Efficiency Developments) and the American Public Power Association.
TABLE OF CONTENTS
Page
ABSTRACT ...ii
DEDICATION ... iv
ACKNOWLEDGEMENTS ... v
CONTRIBUTORS AND FUNDING SOURCES ... vi
TABLE OF CONTENTS ...vii
LIST OF FIGURES ... x
LIST OF TABLES ... xiii
1. INTRODUCTION ... 1
1.1 Motivation and Overview... 1
1.2 State of the art ... 4
1.2.1 Associated Standards and Guides ... 4
1.2.2 Synchrophasor System Assessment Methodologies ... 6
1.2.3 Bad Data Detection and Management ... 8
1.3 Research Approach and Main Contributions ... 11
1.4 Dissertation Organization ... 13
2. BACKGROUND ... 14
2.1. Introduction ... 14
2.2. Phasors and Phasor Estimation Challenges ... 15
2.3. Synchrophasor System ... 18
2.4. Phasor Measurement Unit (PMU) ... 19
3. CONFORMANCE OF THE SINGLE PHASOR MEASUREMENT UNIT TO THE IEEE STANDARD SPECIFICATION ... 21
3.1. IEEE Standard Requirements ... 21
3.2. Development of the Facility for the Synchrophasor Unit Assessment ... 25
viii
3.2.2. Quality Assessment of the Calibration Testing Facility ... 27
3.3. Testing Procedure Implementation and Numerical Results ... 30
3.3.1. PMU Under Test: Settings and Phasor Estimation Functions ... 30
3.3.2. Testing Results ... 34
3.4. Proposed Novel Assessment Metrics Beyond the Scope of the Standards ... 37
3.4.1. Introduction - Why do we need them? ... 37
3.4.2. PMU Vulnerability and Integrity Metrics: Definitions ... 40
3.4.3. Testing Results ... 43
4. END-TO-END ASSESSMENT OF SYNCHROPHASOR SYSTEM IN LABORATORY ENVIRONMENT ... 49
4.1. Impact of the Synchrophasor Measurements on the Power System Protection Applications in Transmission System ... 49
4.2. Testing Environment: Synchrophasor Testbed ... 51
4.3. Application Testing: Definition and Laboratory Set-Up... 53
4.3.1. Reference Algorithm for PMU Performance Evaluation ... 54
4.3.2. Accuracy of the Reference PMU ... 56
4.4. Application Testing Case Study: Power System Faults And Numerical Results ... 58
4.5. System End-to-end Testing: Definition and Fault Location Algorithm ... 65
4.6. System End-to-End Testing Case Study: 2-bus Network And Numerical Results ... 67
4.7. System End-to-End Testing Case Study: 23-bus System – Impact of the PMU Settings and Numerical Results... 74
5. END-TO-END ASSESSMENT OF SYNCHROPHASOR SYSTEM IN SIMULATION ENVIRONMENT ... 76
5.1. Impact of the PMU Data Quality Issues on Modal Analysis ... 76
5.2. Modal Analysis ... 79
5.2.1. Background ... 79
5.2.2. Matrix Pencil Method ... 81
5.3. Quantify the Impact of the Defected Data Sets – Case Studies ... 85
5.3.1. Single Synthetic Signal ... 86
5.3.2. Large Synthetic Network ... 92
5.4. Principal Component Pursuit ... 99
5.4.1. Mathematical Formulation ... 101
5.4.2. Algorithm ... 103
6. CONCLUSION ... 115
6.1. Summary of Contributions ... 115
6.2. Future work ... 121
x
LIST OF FIGURES
Page
Figure 1. Proposed architecture for multilevel testing of synchrophasor systems. ... 12
Figure 2. Sinusoidal waveform (a) and its phasor representation (b). ... 15
Figure 3. Typical configuration of the synchrophasor systems... 19
Figure 4. Typical PMU configuration. ... 20
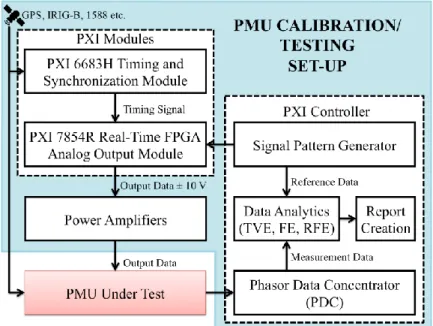
Figure 5. Functional diagram of the PMU calibration/testing set up. ... 26
Figure 6. The developed PMU calibration and automated testing set up. ... 27
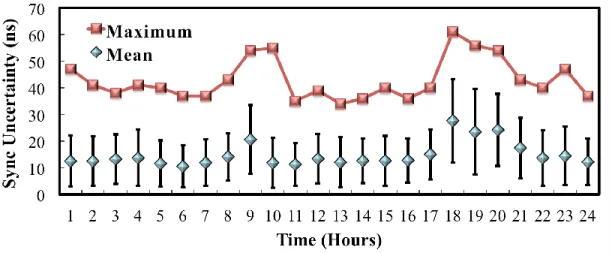
Figure 7. Synchronization error of the calibration system over a 24-hour period. ... 28
Figure 8. Total Harmonic Distortion (THD) over a frequency range of 55-65 Hz. ... 29
Figure 9. Signal to noise distortion ratio (SINAD) (dB) over the set of type tests defined in the IEEE standard for M-class PMUs... 30
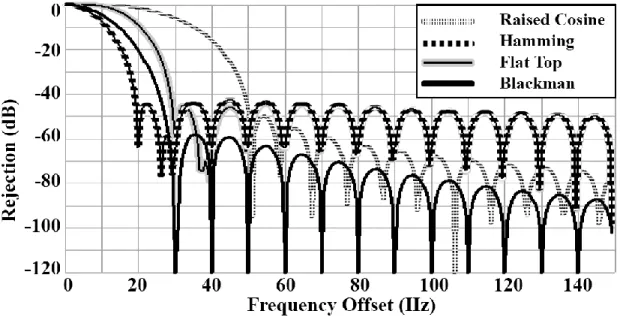
Figure 10. Magnitude response (dB) of different window functions in the tested PMU. ... 31
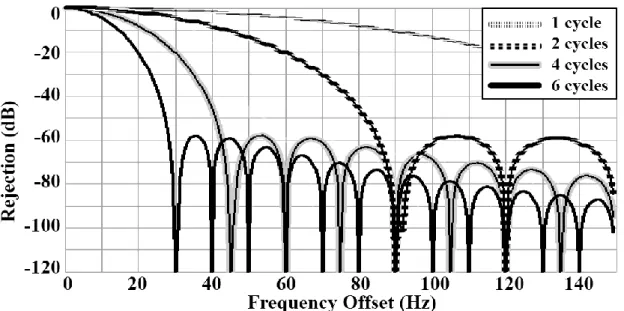
Figure 11. Magnitude response (dB) of the Blackman window function, when WL changes values from 1-6 cycles. ... 33
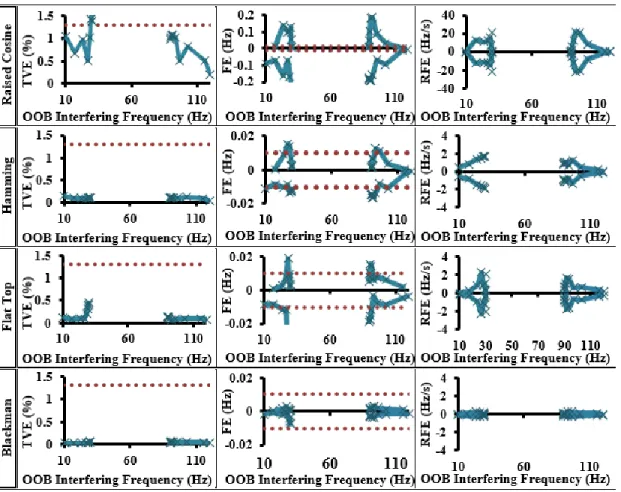
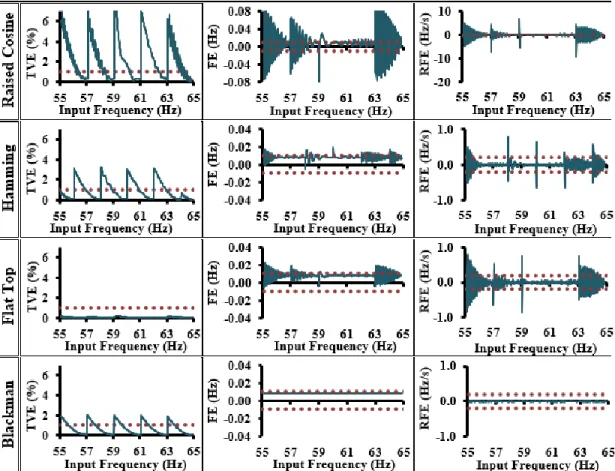
Figure 12. TVE, FE and RFE metrics for PMU performance assessment during the standard static type test (i.e., out-of-band test). ... 35
Figure 13. TVE, FE and RFE metrics for PMU performance assessment during the dynamic type tests (i.e., ramping frequency test). ... 36
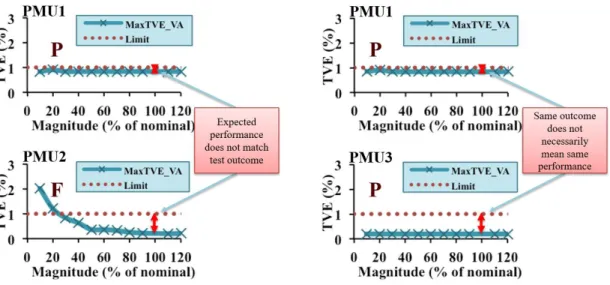
Figure 14. Sample test results from three different PMUs showing the TVE trend during the magnitude sweep test... 38
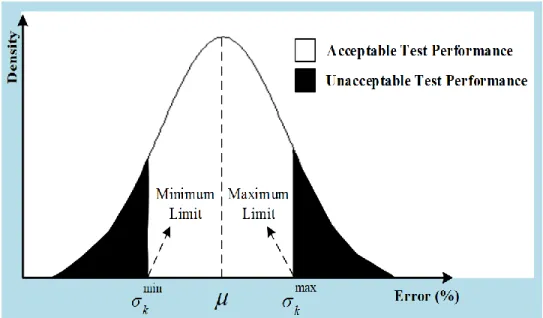
Figure 15. Probability distribution and the bands assigned to the error indicators for each PMU type test k. ... 40
Figure 16. Test results of a given PMU under various static and dynamic test conditions. ... 44
Figure 18. Functional diagram of the synchrophasor testbed developed for
application testing. ... 54
Figure 19. Magnitude response of the BPF in the reference algorithm. ... 56
Figure 20. Case Study: 23-bus model of a 500 kV transmission network. ... 59
Figure 21. (a) Frequency measurements at bus B8 during various fault types, (b) Frequency measurements for three-phase fault on the generator buses. ... 60
Figure 22. Impact of fault resistance on the FE and TVE metrics (d=80% of line length from B10; Blackman window with length of 6 cycles). ... 62
Figure 23. Impact of distance to the fault on the FE and TVE metrics (R=100 Ohms; Blackman window with length of 6 cycles; AB fault). ... 62
Figure 24. Impact of windowing functions on FE and TVE metrics; (d=30% of line length from B10; R=0 Ohm; ABC-G fault; window length of 6 cycles). ... 63
Figure 25. Impact of WL on the FE and TVE metrics (d=30% of the line length from B10; R=0 Ohm; ABC-G fault; Blackman window). ... 64
Figure 26. (a). Equivalent negative sequence network of the faulted TL. (b). Equivalent positive sequence network of the faulted TL. ... 66
Figure 27. Simulated phase voltages in the transmission line fault use case scenarios. . 68
Figure 28. PMU measurements: magnitudes and the phase angles at both ends of the faulted transmission line. ... 70
Figure 29. Synchrophasor-based fault location algorithm performance: calculated fault locations for different fault use case scenarios. ... 71
Figure 30. Proposed approach for estimating the impact of the PMU data quality issues on the modal analysis. ... 78
Figure 31. Original simulated signal. ... 86
Figure 32. Number of modes and mean error of the reconstructed signal with four different values of additive noise. ... 88
Figure 33. Simulated and reconstructed waveforms in the presence of data spikes. ... 90
Figure 34. Simulated and reconstructed waveforms with the un-updated data. ... 91
xii
Figure 36. Original clean frequency measurements from 13 PMUs. ... 93
Figure 37. PMU frequency measurement (a) before detrending (b) with trend removed ... 94
Figure 38. Clean frequency measurement and reconstructed signal. ... 95
Figure 39. Noisy frequency measurement and the reconstructed signal. ... 96
Figure 40. Frequency measurement with the spikes and the reconstructed signal. ... 98
Figure 41. Frequency measurement with un-updated data and the reconstructed signal. ... 99
Figure 42. Clean de-trended PMU frequency measurement: ambient condition. ... 106
Figure 43. Synthetic PMU frequency measurements with noise under ambient conditions. ... 107
Figure 44. Synthetic PMU frequency measurements with outliers under ambient conditions. ... 108
Figure 45. Synthetic PMU frequency measurements with un-updated data segments under ambient conditions. ... 109
Figure 46. Synthetic PMU frequency measurements with noise under transient conditions. ... 111
Figure 47. Synthetic PMU frequency measurements with outliers under transient conditions. ... 112
Figure 48. Synthetic PMU frequency measurements with un-updated data under transient conditions. ... 113
LIST OF TABLES
Page
Table 1. PMU steady state and dynamic standard type tests. ... 22
Table 2. Selected settings of the PMU under test. ... 34
Table 3. Probabilistic Metrics for PMU Vulnerability and Integrity Assessment ... 47
Table 4. Performance assessment of the reference PMU. ... 57
Table 5. Parameters of the active networks. ... 69
Table 6. Transmission line parameters. ... 69
Table 7. Summary of the fault analysis. ... 73
Table 8. Performance of different windowing functions on the fault location algorithm accuracy. ... 74
Table 9. Impact of different windowing lengths on the fault location algorithm accuracy. ... 74
Table 10. Limits of the singular value threshold in the presence of noise. ... 89
Table 11. Estimated mode parameters in the presence of arbitrary data injection. ... 89
Table 12. Limits of the singular value threshold in the presence of un-updated data. ... 91
Table 13. Modal parameters estimated from the 13 PMU frequency measurements. ... 95
Table 14. Modal parameters estimates from 13 PMU frequency measurements with noise and respective errors. ... 97
Table 15. Modal parameters estimates from 13 PMU frequency measurements with spikes and respective errors ... 98
Table 16. Modal parameters estimates from 13 PMU frequency measurements with un-updated and respective errors. ... 99
Table 17. Modal parameters estimates error from synthetic PMU frequency measurements with noise with and without PCP. ... 111
Table 18. Modal parameters estimates errors from synthetic PMU frequency measurements with spikes with and without PCP. ... 112
xiv
Table 19. Modal parameters estimates errors from synthetic PMU frequency
1. INTRODUCTION
1.1 Motivation and Overview
The electricity grid is a critical infrastructure of the modern society, yet vulnerable to numerous sources of uncertainties and disturbances, due to its noticeable growth of both electricity demand and penetration of non-conventional generators. Unfortunately, the number of failures in the grid is also increasing as a result of the grid’s aging infrastructure, and more severe weather conditions [1]. Hence, advanced monitoring and control strategies need to be properly planned and deployed to mitigate and minimize the impact of such risks on the grid performance.
Following the catastrophic Northeastern US blackout in 2003, the American Recovery and Reinvestment Act (Recovery Act) of 2009 supported the DOE with $4.5 billion for the modernization of the power grid, which offered a new impetus for the development of synchrophasor technology [2]. With up to 120 measurements per second, synchrophasor technology is deemed a solution for more advanced and high-resolution monitoring, protection, and control of the grid. PMU measurements help capture and track real-time system dynamics and allow development of new, groundbreaking applications that can improve situational awareness of the grid states [3]-[8]. Deployment of PMUs and PMU-capable IEDs over the last 30 years has facilitated a better understanding of modern power systems. PMUs now serve as the backbone for many system-wide mission-critical applications in the electric industry, such as state estimation, fault detection,
2
remedial actions, oscillation detection, and wide area monitoring. Nevertheless, those applications require synchrophasor data to be reliable, accurate, and delivered “on-time.” The synchrophasor infrastructure is a mission-critical system and, it is expected to operate reliably each time it is called upon. To ensure the reliability and security of the infrastructure for synchrophasor-based applications, good synchronization (accuracy of the timing reference is higher than 1 us), a fast and reliable communication network, and accurate phase angle and magnitude measurements are needed [9]. On the other hand, PMU data is often delivered with various data quality issues, hindering PMUs to be fully incorporated and deployed in control and operation practices [40]. Several IEEE standards and guides provide requirements for installation, performance and testing procedures for synchrophasor devices (i.e., PMU, PDC), but considering the lack of enforcement, data quality is still not sufficient for many downstream applications. California ISO reported that the typical bad data ratio of synchrophasor measurements in the US ranges from 10% to 17%, where 80% of the problems are the invalid data problem (incorrect magnitude, phase and/or frequency measurement) while 10% are the unsynchronized data problems [39].
Regardless of the application, certain testing and performance validation of PMUs and the end-to-end synchrophasor system are essential to confirm measurement accuracy and continuously ensure high reliability and trustworthiness. Over the past decades, many synchrophasor applications have been developed, although the performance under various PMU errors has not been explored and is unknown for most applications. This research strives to examine a number of procedures and testing tool implementation techniques to
reach a better understanding of the PMU measurement limitations imposed on the applications, and improve quality of synchrophasor data by looking in the following problems:
1) Performance of the single PMU device under standard-defined test and beyond While compatibility of commercial PMUs with the industrial standards (e.g., IEEE standard C37.118.1a-2014) is expected, calibration laboratory tests reveal noticeable inconsistencies among the measurements obtained by PMUs from various manufacturers due to different phasor estimation techniques and hardware solutions [32]. Furthermore, hardware in the loop testing reveals evident discrepancies among the phasor estimates under the conditions not specified in the standards (e.g., transients, faults) [31]-[34], [41]. Such observations suggest that there is no guarantee that different end-use applications would perform satisfactorily even if the PMUs have passed all the standard type test requirements. Thus, development of advanced testing facilities and procedures that will help to understand the behavior of different implementations is crucial.
2) Synchrophasor end-to-end system evaluation
Even though all components (e.g., PMUs, PDC, and communication gear) may pass the laboratory tests, there is no guarantee that everything will work properly together after installation and deployment in the field. To preserve a satisfactory level of service quality, system components need to be tested keeping in mind different stages of the deployment. Therefore, developing the testing environment for not only PMUs but also an assessment of the complete system solution is critical. Moreover, the risk of failure of the end-use applications caused by inaccuracy and abnormality of PMU measurements,
4
especially in the face of different system operating conditions such as faults and transients should be researched.
3) Synchrophasor data quality improvement
Data issues in the synchrophasor system can arise because of topology errors, meter failures, improper configurations. Additionally, communication infrastructure brings vulnerabilities to the power system allowing intruders to launch various types of cyber-attacks and jeopardize the reliability of the electric grid. Hence, it is crucial to have a proper mechanism for the detection and mitigation of the corrupted PMU data. In spite of its importance, limited effort has been made to characterize and understand the source nature, detect and finally, if possible correct PMU data [40].
Having a rigorous procedure and adequate tools to test different aspects of the hardware and software design, from the component to the overall system level, and over different time spans is the only way to assure a robust and reliable operation of the mission-critical systems.
1.2 State of the art
1.2.1 Associated Standards and Guides
Multiple efforts have resulted in standards and guides for PMU testing and calibration. IEEE Standards Association and North American Synchro Phasor Initiative (NASPI) have issued several standards and guidelines providing information on how to test and safeguard mission-critical infrastructure such as PMUs and Phasor Data Concentrators (PDCs) [10]-[17]. Since 2005, standards for the static and dynamic performance of the PMUs, as well as communication requirements for the synchrophasor
data transfer have been developed and eventually adopted. The IEEE C37.118.1-2011 standard defines acceptable performance requirements for synchrophasor measurement [10]. In 2014, this standard was revised, where some tests were removed, and some of the requirements were relaxed because none of the PMUs and IEDs with PMU capabilities available at that time in the market could comply with the standard [12]. Testing procedures and requirements for the test equipment, such as timing reference, signal source, calibration device, and environmental conditions, are given in IEEE Synchrophasor Measurement Test Suite Specification (TSS) document published by IEEE Conformity Assessment Program (ICAP) [13]. TSS provides a suite of unambiguous test procedures by following the Smart Grid Interoperability Panel (SGIP) Recommendations contained in the Interoperability Process Reference Manual [14]. IEEE C37.118.2-2011 standard covers the requirements for the PMU data transfer in power systems [11]. IEEE C37.242 document provides guidance for synchronization, calibration, testing, and installation of PMUs applied in power system protection and control [16]. Testing procedures for the Phasor Data Concentrators (PDCs) are given in the IEEE C37.244 Guide for Phasor Data Concentrators Requirements for Power System Protection, Control, and Monitoring [17].
According to the above standards, two performance classes of PMUs, namely P and M, are defined where the P-class is intended for protection applications demanding fast measurement response time, while the M performance class is utilized in applications that require high measurement accuracy [10]. A standard-compliant PMU should meet all
6
the requirements, at least for one class, for the type test steady-state and dynamic performance.
1.2.2 Synchrophasor System Assessment Methodologies
Type tests are conducted in a controlled environment where the PMUs are exposed to known input waveforms defined in the IEEE standards. Many organizations, government agencies, and researchers have developed calibration and testing facilities for performance evaluation of PMUs and PMU-embedded devices (e.g., relays and recorders) according to standard requirements [18]-[29] and field-testing procedures [30]-[34]. For instance, the National Institute of Standard and Technology (NIST) lead the way in this area, and Synchro-Metrology lab was built in 2006 [18], and has advanced to reference calibration system for all other testing facilities [19]. Since the National Metrology Institute (NMI) did not provide support for the calibration of these devices, and due to the lack of the reference calibration system, NIST took the lead to develop such facility. This calibration system is capable of testing PMUs only under the signal conditions given in the standard and it is not fully automated. Additionally, PMU testing laboratories have been developed and used to evaluate PMUs in Brazil [20], China [21], Europe [22], [23], Canada [27], and in the USA [28]. However, the traceability of those testing systems to the NIST system was not demonstrated, hence the trustworthiness of the acquired testing results is uncertain. Recently, Fluke Company has promoted a commercial PMU calibration system, which complies with IEEE C37.118.1-2011a-2014 [29].
Furthermore, a team at the Bonneville Power Administration (BPA) in collaboration with the Pacific Northwest National Laboratory (PNNL) was involved in
testing the PMUs in laboratory and field environments under both static and dynamic conditions [30]. However, details about the calibration system and its accuracy are not provided. In [31], several issues related to PMU measurements under transient conditions were discussed and procedures for PMU testing under such scenarios were proposed. Authors in [33] analyzed the impact of PMU frequency and phase angle errors on a number of synchrophasor applications among which are: islanding detection, event location detection, dynamic line rating, and oscillation detection. The main issue with the proposed approach is the assumption that the maximum frequency error present in the PMU measurement is equal to 0.005 Hz, which is many cases, is not correct. We showed that in the certain test cases, frequency error exceeds the assumed value; hence, the results from [33] are underestimating the impact of the flawed PMU data.
Besides, all these facilities are focused only on the particular test set, while this dissertation proposes the comprehensive framework that includes multiple stages of testing, ranging from evaluation of the PMUs according to standard requirements and beyond, as well as the assessment of entire synchrophasor system under normal power conditions and during system disturbances. Also, the traceability of the developed PMU calibration system has been demonstrated to a NIST system.
The concept of end-to-end testing has been established in the literature [35]-[38]. An example of such end-to-end testing of protection system and fault clearing system is discussed in [36], [37] where the overall engineering process of system study, protection concept, design, purchase, build, and installation is described. However, this concept is not yet being applied the synchrophasor systems [110].
8
1.2.3 Bad Data Detection and Management
Presence of bad data in power system application is not a novel issue. Conventional measurements collected from the meters contain the errors due to the imperfections in the current/voltage transformers, rounding in the calculation, communication gear, etc. Within energy management system, state estimation (SE) is widely used as a tool for data “pre-screening” having a capability of the measurement correctness and timeliness. With the introduction of the modern devices such as PMUs and advancement in the network infrastructure, power system has become more vulnerable, imposing a need for the better solutions in regards to data protection and bad data detection [115]. In general, bad data detection (BDD) techniques can be divided into five categories: 1) traditional approach based on the SE [42]-[45]; 2) methods that utilize Kalman filter [46]-[50]; 3) data-driven analyses [51]-[65]; 4) machine learning algorithms [66] and 5) logic-based techniques [67]-[69].
Many of the bad data detection methods are still based on SE, though it has been shown that when smart cyber-attack is launched, traditional SE methods will fail (bypass) to detect it, putting the system in danger. To deploy the SE-based BDD technique, previous knowledge on the system model is necessary, which in turn may result in non-reliable bad data detection when system topology is inaccurate. Therefore, the detection accuracy of the SE-based approaches may be affected when gross errors are presented in system topology or parameters. Furthermore, these methods cannot operate successfully when state estimation diverges because of gross measurement errors, system physical disturbances, or stressful operating conditions. The techniques based on the Kalman filter
are model-free since the estimate of the state is based on the previously predicted values of the same state, however, usually those are computationally expensive.
Techniques that require prior knowledge of the network parameters and/or system topology might be affected by the errors in the topology/parameters, giving the significant advantage to the purely data-driven methods, among which are: Principal Component Analyses (PCA), low-rank matrix approach, density based Local Outlier Factor detection techniques (LOF), clustering. However, some data-driven approaches [53], [54] are defined as nonlinear optimizations problem. The problem with nonlinear functions is that it can make the minimization problem to be non-convex, making it computationally expensive. References [53], [55] pioneered purely data-driven approach to improve the PMU measurements quality.
To be applied onto PMU measurement blocks, PCA based data detection requires a prior estimation of error-free measurement matrix as well as a certain training period. Low-rank matrix techniques are block-based processing methods, and potential applications include the recovery of missing PMU data, detection of the outliers, cyber-attacks. One interesting approach for the recovery of a low-rank matrix is the Principal Component Pursuit (PCP), which is based on a convex problem that can be solved by applying an augmented Lagrangian multiplier (ALM)-based algorithm [64]. In contrast to PCA, PCP guaranties recovery of the low-rank matrix despite the gross sparse errors. Algorithms such as Singular Value Thresholding (SVT) and the Information Cascading Matrix Completion (ICMC) are just some of the examples applied in the synchrophasor domain [58], [59]. In addition, a few more algorithms were proposed to solve the matrix
10
completion problem in other research areas such as ADMiRa, and Singular Value Projection (SVP).
Although the proposed recovery techniques are capable of filling the missing points, and bad data detection due to high computational complexity those are not suitable for on-line applications. In [59], an online algorithm for PMU data processing (OLAP) has been proposed and is built upon the recent art in subspace tracking, continuously updating the dominant singular values and singular vectors, and the missing data is recovered by filling the empty point space based on the singular vectors.
Authors in [61], [62] applied density based LOF analyses to identify the low-quality synchrophasor measurement leveraging the spatial-temporal correlation between the measurements. LOF method is threshold-based, and it is system dependent, which imposes the need for the algorithm to pass the off-line training using the historical system data. A drawback of the methods that use outliers for the BD detection is that it can mislead the detection methods when disturbances occur in the system or produce false alarms because of insufficient PMU redundancy.
Sometimes, simple plausibility checks combined with the engineering judgment can greatly help in mitigating some basic, still common issues that arise in the PMU data sets. It has been shown that this type of basic checks are very efficient, nevertheless, in some cases, the “logical rules” do not catch bad measurements (especially when a cyber-attack is executed), or incorrectly reject valid data points which can result in increased loss of data. In [68] authors proved that the largest residual location does not mean that it is the location of the bad data occurrence, which results in removing the good data. The
computational burden is very low, allowing this method to be used online for the detection and correction purpose.
In this work, the Principal Component Pursuit technique that has been widely used in the image processing is applied for the correction of PMU data, and its effectiveness is demonstrated on the synthetic PMU frequency measurements.
1.3 Research Approach and Main Contributions
This dissertation proposes the synchrophasor measurement evaluation to be accomplished in three layers: type testing, application testing, and system end-to-end testing. Figure 1 depicts the proposed synchrophasor testing framework.
Type tests are conducted in a calibration laboratory environment where PMUs are exposed to known signal patterns defined in the IEEE standard 37.118.1a and the PMU response to such static and dynamic patterns are assessed. Proposed comprehensive evaluation of PMUs assesses the performance of different design alternatives such as length of the phasor estimation windows, type of the filtering windows (i.e., Raised Cosine, Hamming, Flat-Top, Blackman, etc.), reporting rates, by subjecting PMUs to known waveforms.
Application tests are conducted to evaluate the PMU performance under faults and other disturbances in power systems. At this stage of testing, the performance of the stand-alone PMU device is evaluated when PMU is exposed to a set of input waveforms from the field. Phasor estimates and frequency measurements of the Device Under Test (DUT) are compared with those estimated from the reference PMU (with the very accurate algorithm). The accuracy of the reference algorithm
12
is confirmed in the calibration laboratory to ensure applicability of the developed algorithm to serve as a valid reference even under the unknown inputs.
System end-to-end tests are conducted by feeding the end-use synchrophasor applications with the measurements from real PMUs and quantify the impact of measurement errors on the application of interest.
Finally, purely data-driven technique, namely Principal Component Pursuit is used for the correction and completion of the synchrophasor data blocks, and its application in the modal analyzes is verified.
1.4 Dissertation Organization
This dissertation is organized as follows. In Section 2, a background of the synchrophasor technology is introduced, including the basic synchrophasor concepts and the phasor estimation challenges. Furthermore, brief overview of the typical synchrophasor system infrastructure and its devices is reviewed.
Section 3 focuses on the performance evaluation of the standalone PMUs according to the IEEE standard requirements. Detailed hardware and software solution for the calibration test set is provided. Issues with the standard requirements are recognized and the novel metrics for the performance evaluation are introduced.
In Section 4, the concepts of the application and system end-to-end testing in the hardware environment are elaborated. We explored the performance of different PMUs when exposed to the waveforms generated from the system under disturbance, specifically faults in the transmission network. Risk assessment of the purely synchrophasor fault – location algorithm is studied and quantified.
Next, Section 5 studies are focused on the risk assessment of the PMU data in the modal analyses in the simulation environment. The Matrix Pencil Method for the modal extraction was presented and we quantified the impact of the various PMU data issues on the application outcome. Different quality data issues are applied to the input data (i.e. PMU frequency measurements), among which are noise, un-updated data and outliers. In this section, we also introduced the Principal Component Pursuit technique for the data correction and applied it as a pre-screening tool for the modal extraction.
14
2. BACKGROUND 2.1. Introduction
The concept of phasor representation of alternate current and voltage signals was introduced in early 1893. by Charles Proteus Steinmetz [70]. Almost a century later, in 1992 at Virginia Tech, the idea of the complex representation of the electrical waves evolved and the first Phasor Measurement Unit (PMU) prototype was developed. The PMU is capable of calculating the voltage/current waveform phasors that are synchronized to the absolute time reference provided by the Global Positioning System (GPS). Since synchrophasor technology was introduced, developed, and partly integrated into the electric power systems, it has shown great advantages in control and monitoring of the grid, detection of network problems in early stages, maximization of power system security, and reliability. Extensive research efforts on the use of PMUs in power systems have been reported in the literature, particularly on Wide Area Measurement Systems (WAMS) for monitoring, control, and protection applications. PMUs now serve as the backbone of various critical applications in the electric industry, such as state estimation, fault detection, remedial actions, and wide area monitoring [3]-[8].
Issues such as inconsistent accuracy due to the use of different synchrophasor estimation methods in various PMU products, and difficulties in the integration of proprietary software and hardware features of different products from different vendors, hindered the wide implementation of synchrophasor technology [9]. Such a wide range of phasor estimation techniques and resulting performance differences necessitate quality assessment, compliance analysis, calibration, and field-testing.
2.2. Phasors and Phasor Estimation Challenges
In an ideal scenario when power system is in normal operation mode, voltage/current waveforms appear as a pure sinusoidal wave with a frequency of 60 Hz (or 50 Hz). A normal operation implies all electricity demand being supplied with stable frequency, and transmission line flows are within the desirable margins. Using the phasor representation concept, a pure sinusoidal time dependent signal in (2.1) can be represented with the unique constant number, called phasor, as in (2.2).
mcos
mcos 2
0
a t A t A f t (2.1)
cos sin
2 i m A A j Ae (2.2)where, θ is the phase angle of the sine waveform defined relative to a time reference signified by t=0, and magnitude A is the root mean square (rms) value of the signal in (2.1) with the amplitude Am. Sinusoidal signal with phase angle θ and its phasor representation are depicted in Fig. 2. Note that the nominal signal frequency (f0) is not part of the phasor representation.
16
Phasor representation indicates that signal continuously residues stationary and that its complaint has constant value. However, power system frequency may vary from its nominal value during disturbances, faults, and transients, while voltage and current waveforms can suffer from different types of distortions, e.g., harmonics, amplitude and phase distortions, modulations [41]. In such circumstances, assumption made regarding the pure stationary sinusoidal signals is not valid any longer and the concept of phasor representation needs to be modified.
In general case when the amplitude and the signal frequency are the functions of time, we can define the function g f f0 where f0 is the nominal signal frequency (50 or 60 Hz) and g is the difference between actual and nominal frequency. In this case, the equation (2.1) can be rewritten as follows:
m
cos 2
m
cos 2
0
2
a t A t
f dt A t f t
gdt (2.3) Phasor representation of this waveform is then given in (2.4).2 ( ) 2 j gdt m A t A e (2.4)
The most common practice for phasor estimation in commercial PMUs is to apply the Discrete Fourier Transform (DFT) technique. The DFT deconstructs a finite number of time domain waveform samples into the frequency domain representation that comprises of voltage/current spikes at varying frequencies.
2 1 0 2 N j n N k k n n A a e N
(2.5)where N represents the number of samples in data window and k denotes the first sample of the data set. The transformation in the frequency domain may be done using an optimized version of the DFT, the Fast Fourier Transformation (FFT), after which the pure sinusoidal signal has only one spike at the nominal frequency when sampling frequency is an integer multiplication of the 60 Hz. FFT assumes that the endpoints of the waveform are interpreted as they are connected together (circular topologies) and that the acquisition interval is equal to an integer number of signal periods.
When the frequency differs from the nominal value, the sampling frequency is no longer the integer multiplication of the nominal frequency; hence, artificial discontinuities or sharp changes will be observed in the measured signals, the consequence of which is a phenomenon called specter leakages. It appears as the energy is “leaking” from one frequency into another and FFT is not capable to accurately estimate the parameters of the signal in frequency domain. In the meantime, there exist many techniques in digital signal processing domain to deal with this phenomenon, example of which are various windowing techniques used to minimize the effect of errors introduced by the frequency deviations [71]. However, there is no perfect filter that can make estimation of all parameters (i.e. frequency, magnitude, and phase) equally accurate, and using the proposed testing framework impact of various filter parameters on the estimation accuracy is studied in this dissertation.
18 2.3. Synchrophasor System
A typical synchrophasor system consists of several layers as depicted in Fig. 3: Substation layer, including timing references created using GPS/GNSS receivers,
PMUs and a PDC (in the case there are multiple PMUs) that will merge the measurement streams sent from the substation.
Communication layer, connecting the equipment in substations, as well as between substations and control center allowing the measurement streams from substations to be sent to PDCs located at the Control Center.
Control Center layer, receiving the streams from substations and merging them through a PDC that makes them available to the decision making environment where the application software, data management and visualization tools are located, and forwards them to the next layer.
Regional System Operator or an Independent System Operator layer, receiving the synchrophasor measurement streams from the Control Centers PDCs, and aligning them based on the reported time tags and combining them in a unique stream of measurements that represent the wide area system dynamics, which is further processed and used in various wide-area grid applications.
The described synchrophasor system is quite complex with multiple components that can influence the performance and accuracy of the applications and it signifies a need for multilevel testing and evaluation of the measurements.
2.4. Phasor Measurement Unit (PMU)
Housing the estimation algorithms, PMUs are devices capable of providing the synchrophasors of the voltage and/or current electrical signals, as well as frequency and the rate of change of frequency of the system. Synchrophasor is a term that designates time-imprinted phasor with associated time tag synchronized to Universal Coordinate Time (UTC) at the nominal system frequency. All measurements that belong to the exact same point of time can be time-aligned and provide a big picture of the entire system or interconnected region. Depending on the hardware and technology, precise and accurate timing reference is provided to PMUs directly using the Global Positioning System (GPS)
20
signal or using the IRIG-B signal generated by separate GPS receivers. Typical configuration of the PMU is depicted in Fig. 4.
Nominal voltage/current signals (signal sources) provided to PMU device are not specified in any standard, though typical value for the voltage is 70 Vrms while for current
signal is 2 or 5 Arms. However, these values are still too high to be directly digitally sample
with an analog-to-digital converter (ADC); thus, each PMU device has smaller step-down transformers. Before signal are converted to the digital values, stepped-down inputs pass the anti-aliasing filters that aid in the selection of the fundamental frequency component that is desired for measurement. Next, ADC digitally sampling point-on-wave values, that are used by the signal processor (phasor estimator) for estimating the phasor values of the input signals.
3. CONFORMANCE OF THE SINGLE PHASOR MEASUREMENT UNIT TO THE IEEE STANDARD SPECIFICATION*
3.1. IEEE Standard Requirements
According to the IEEE standard C37 118.1, each device that is capable of providing GPS synchronized measurements has to undergo various test scenarios while being calibrated. The tests can be generally categorized into steady state or dynamic tests as specified in the IEEE C37.118.1, and as shown in Table 1. Further, two performance classes of PMUs, namely P and M, are defined where the P-class is intended for protection applications demanding fast measurement response time, while the M performance class is utilized in applications that require high measurement accuracy.
During the steady state tests, PMUs are exposed to various type test scenarios where all variables are kept unchanged during each test and the measurements are captured according to the standard procedure [13]. Such static type tests include performance evaluation of PMUs over a range of frequency values, voltage/current amplitudes as well as influence of harmonic and inter-harmonic interferences. Dynamic type tests involve testing PMUs with the modulated signals, checking their performance during the step occurrence in amplitude and angle, as well as testing the PMU response to the frequency ramp events. Dynamic tests are devised to account for the dynamic signal changes that a PMU would face when applied in a real-world power grid. As a part of the standard requirements, latency of a PMU device has to be measured as well.
* Part of this section is reprinted with permission from “Probabilistic Assessment of PMU Integrity for Planning of Periodic Maintenance and Testing” by T. Becejac, P. Dehghanian,
22
Mathematical representation of the input signals during the dynamic tests, namely modulation, ramping and step changes, as well as the frequency, frequency deviation and the rate of change of frequency (ROCOF) during those tests, are given respectively by, Equation (3.1), Equation (3.2), and Equation (3.3):
Table 1. PMU steady state and dynamic standard type tests.
Test
Category Test Name
Input Range P Class M Class Steady Tests Magnitude Sweeping 0.8-2 pu 0.1-2 pu Frequency Sweeping ±2Hz ±2Hz, or ±5Hz Harmonic
Distortion 1% each harmonic up to 50th
10% each harmonic up to 50th Latency 1000 consecutive messages 1000 consecutive
messages Out-of-Band Interference N/A Depending on reporting frequency, harmonic infiltration from 10Hz to twice nominal frequency; interfering signal 10% of signal magnitude Dynamic Tests Amplitude
Modulation Modulation frequency from 0.1Hz to 2Hz Modulation level 0.1 Modulation frequency from 0.1Hz to 5Hz Modulation level 0.1 Angle Modulation
Frequency Ramp ±1Hz/s, frequency range within ±2Hz ±1Hz/s, frequency range within ±5Hz Magnitude Step Change ±10% Step Angle Step
0 0 0 0 21 cos cos cos
1 cos cos 2 3 cos
1 cos cos 2 3 cos
sin 2 2 sin 2 c 2 a m x a b m x a c m x a a a a A A k t t k t A A k t t k t A A k t t k t f nT k nT f nT k nT ROCOF nT k os
nT
(3.1)where Am is the amplitude of the input signal, ω0 is the nominal power system frequency, ω is the modulation frequency in radians/s, kx is the amplitude modulation factor, and ka is the phase angle modulation factor. t = nT represents the reporting time tags, where T is equal to the phasor reporting interval.
2 0 2 0 2 0 0 cos cos 2 3 cos 2 3 2 ( ) a m f b m f c m f f f f A A t R t A A t R t A A t R t f nT R nT f nT R nT ROCOF nT R (3.2)Am is the amplitude of the input signal, ω0 is the nominal power system frequency and Rf is the frequency ramp rate given is Hz/s. t = nT represents the reporting time tags, where T is equal to the phasor reporting interval.
24
1 0 1 1 0 1 1 0 1 1 cos 1 cos 2 3 1 cos 2 3 a m x a b m x a c m x a A A k f t t k f t A A k f t t k f t A A k f t t k f t (3.3)where Am is the amplitude of the input signal, ω0 is the nominal power system frequency, f1(t) is a unit step function, kx is the magnitude step size and ka phase step size.
Metrics for PMU performance evaluation according to the IEEE standard are: Total Vector Error (TVE), Frequency Error (FE), and Rate of Change of Frequency Error (RFE). TVE is defined as the deviation of the estimated phasor from the reference true value, and is calculated as follows:
2 2 2 2 100% t t r r i i t t r i A A A A TVE A A (3.4)where subscript r stands for real, and i for imaginary parts of the phasor, and superscript t designates the true value of the input signal for each reported measurement; Ar and Ai are, respectively, the real and imaginary parts of PMU estimated phasor. TVE contains errors in both magnitude and phase angles. The FE and RFE are defined as absolute values of the estimated frequency (Hz) and ROCOF (Hz/s) deviation from the true values at the same time instant, given in (3.5) and (3.6):
t
FE f f (3.5)
t
RFE df dt df dt (3.6)
The PMU performance conformity under the aforementioned static and dynamic conditions needs to be ensured during the life-cycle of the PMUs and, hence, periodic
maintenance and testing of the PMUs can help checking the desired functionality over time. A standard-compliant PMU should meet all the requirements, at least for one class, for the type test steady state and dynamic performance.
3.2. Development of the Facility for the Synchrophasor Unit Assessment 3.2.1. Hardware Architecture of the Testing Facility
In this effort, a unique PMU calibration lab is constructed to execute standardized PMU acceptance tests according to IEEE and IEC standards, such as the IEEE C37.118.1a among others. PMU test platform is developed to verify the performance of PMU device exposed to type tests. In particular, the type test implementation is done based on mathematical signal models defined in the standard using very accurate signal generators to replay the generated waveforms into the device under test. The measurements acquired from the device under test are compared against the true phasor values derived from the signal model. In order to implement the PMU type tests, a synchrophasor testing and calibration set-up is developed using the National Instrument (NI) PXIe-1062Q Chassis equipped with the following PXI boards: (a) PXIe-8105n 2.0 GHz Dual Core controller; (b) PXI-6683H Synchronization module, and (c) PXI-7854R FPGA-based IO module; all controlled in graphical system design software platform, LabVIEW. Full testing of PMUs on 50/60Hz for each reporting rate defined in the IEEE standard and considering various PMU communication protocols is automated. Functional architecture of the implemented test set-up is depicted in Fig. 5 and the actual implementation of such testing environment is illustrated in Fig. 6.
26
Using the PXI controller, signal pattern generator calculates the waveform parameters according to the IEEE C37.118.1 std. definitions [10]. Parameters are then transferred to the Virthex-5 LX110 FPGA board and six voltage and current waveforms are generated using the PXI-7854R analog I/O module equipped with eight 16-bit digital-to-analog converters (DACs). Generated waveforms are low-level signals (±10V) with a sampling rate controlled with 40MHz clock that are amplified to a given nominal value (70Vrms for three phase voltage and 5Arms for the current signals).
Synchronization and time alignment with respect to the Coordinate Universal Time (UTC) of all modules are ensured in the calibration system through the PXI 6683H module with the accuracy of higher than 100 ns. PMU measurements are then directed over Ethernet or Serial communication ports back to the PXI system, where they are parsed in a local PDC developed on the PXI controller. Received measurements are compared
against the reference values and the TVE, FE and RFE performance metrics are calculated. Values of the reference phasors are compensated, through compensation factors, to take into account the influence of the hardware response (signal generator and power amplifiers) and correspondingly the induced errors.
3.2.2. Quality Assessment of the Calibration Testing Facility
To ensure the validity of the testing and calibration procedure, systematic characterization of the testing hardware and software modules is carried out in all stages of testing. Overall accuracy of the calibration system depends on (a) the accuracy and stability of the timing reference, and (b) the ability to curtail the angle and magnitude uncertainties in the generated waveforms. Impact of uncertainties in the developed signal
Figure 6. The developed PMU calibration and automated testing set up. Adapted with permission from[111]
28
generation and synchronization modules is carefully studied and the results are presented as follows:
Timing Reference: with the onboard temperature-compensated crystal oscillator (TCXO) that can be disciplined with the GPS source, 6683H module allows the long-term stability of the real time calibration system. Quality of the timing reference is evaluated by measuring the maximum synchronization error with respect to the UTC reference over a 24-hour period. Fig. 7 reflects the maximum uncertainty and the corresponding mean and standard deviation. It can be seen that the maximum uncertainty over the entire range of measurements is limited to 60 ns, which in turn, causes a maximum phase angle error of less than 1.3 mdeg. for the reference system.
Signal Generation: two metrics are used to assess the power quality of the generated waveforms: (a) total harmonic distortion (THD) over the first 50 harmonics, and
(b) signal to noise and distortion ratio (SINAD). Measurements are taken using the very accurate oscilloscope [72] equipped with a software for power quality assessments and interfaced with the testing software module where the metrics are assessed. For THD evaluation, the nominal frequency is swept in the range from 55 to 65 Hz (for nominal system frequency of 60Hz), while keeping the voltage/current values at nominal (70Vrms/5Arms, respectively). According to Fig. 8, observations revealed that the THD is
independent of the nominal frequency and is limited to 4e-4%, which is two orders of magnitude better than specified in the standard. Furthermore, the quality of the generated signals is evaluated by measuring the THD with noise. Similarly, the results confirmed the accuracy of the designed calibration set-up for PMU testing, and that the impact of the THD is negligible.
Next, the SINAD metric is calculated as presented in Fig. 9. One can see in Fig. 9 Figure 8. Total Harmonic Distortion (THD) over a frequency range of 55-65 Hz.
30
and out of band (OOB) interference tests where the interfering components with magnitude equal to 10% of the fundamental are added to the fundamental component.
Magnitude and Phase Angle Error: As mentioned before, the reference synchrophasors are derived from the mathematical models defined in the IEEE C37.118.1 std. [10]. The “true” values are compared against the oscilloscope measurements and the offsets, resulting from the DAC and power amplifier responses to generated signals, are compensated in the calibration system software module.
3.3. Testing Procedure Implementation and Numerical Results
3.3.1. PMU Under Test: Settings and Phasor Estimation Functions
Some of the PMU devices are equipped with various options for the estimation algorithms (in both P and M performance classes). The options include different windowing functions and filters, adaptive tuning capability of the estimation algorithm, number of cycles used for calculation of the phasors (WL), reporting rate, and are provided
Figure 9. Signal to noise distortion ratio (SINAD) (dB) over the set of type tests defined in the IEEE standard for M-class PMUs.
to user as the optional parameters to be defined and used within a given PMU device. Window function is a mathematical function used to minimize the effect of the specter leakage and improve the signal quality before applying the DFT by removing the corrupting influence of noise, harmonics, modulation, etc.
The filters used in the PMUs may seriously affect the accuracy of the output estimate by introducing magnitude attenuation and phase offset [71]. In this study, the PMU under test has a built-in setting allowing the user to select between four windowing functions, namely the Raised-Cosine, Flat-Top, Hamming, and Blackman. The frequency-domain magnitude characteristics (dB) of four window functions are demonstrated in Fig. 10. The window length (WL) is set to 6 cycles of the nominal frequency (100ms). Each window function consists of the main-lobe and several side-lobes, characteristics (width
32
of the main-lobe, roll-off of the side-lobes, attenuation factor, etc.), which determine the filter performance. Selecting the most appropriate settings for synchrophasor measurement depends on the target end-use application, which involves a compromise on the filter characteristic (e.g. bandwidth, the amplitude accuracy, and the decrease rate of the spectral leakage into other frequencies).
The Raised-Cosine and Hamming window functions, both of the Hamming family of functions, are constructed by multiplying a rectangular window by one period of a cosine signal, offering it two degrees of freedom. General definition of the Hamming family of functions is given in (3.7).
2 1 1 2 cos , ,..., 1, 0,1,..., 2 2 n N N w n n N (3.7)where, N is the length of the window function in samples. Raised-Cosine function is characterized by the parameters α = 0.5 and β = 0.25, while they are α = 25/46 ≈ 0.54 and β = (1- α)/2 ≈ 0.23 for the Hamming functions.
Adding one more degree of freedom compared to the Hamming family results in the family of Blackman windows.
0 1 2 2 2 cos n cos 2 n w n N N (3.8)Classic Blackman window is defined with α0 = 0.42, α1 = 0.50, and α2 = 0.08.
The Flat-Top window functions are basically the sum of few cosine terms designed to have smooth and flat filtering characteristics in frequency domain, especially to determine the amplitude of the signal with excellent precision. However, they typically lack a reasonably good frequency resolution.
Additionally, WL also plays an important role on the frequency response of the functions. The PMU device under test has an option to choose WL from set of {1,2,3,4,5,6} cycles of fundamental frequency. Fig. 11 depicts the influence of the WL on the frequency response of the Blackman window function taking values in the set {1, 2, 4, 6}. As N increases, the main-lobe narrows, providing a better frequency resolution with no impact on the side-lobes but at the same time introduces the additional delay in estimate. One can also see that decreasing the WL degrades the estimation accuracy while the phasor estimates are available faster in time.
Furthermore, the reporting rate of the synchrophasor estimates is selected by taking values from a set of {10,12,15,20,30,60} frames per second (fps) as required by the IEEE standard when considering a nominal frequency of 60 Hz. Depending on the selected
34
value, coefficients of the filter functions vary which in return influence the overall performance of the PMU. Correct choice of such parameters is crucial for an accurate synchrophasor measurement. Once again, trade-offs between the required accuracy and the estimation speed should be made depending on the target application of interest.
3.3.2. Testing Results
Full set of static and dynamic type tests according to the IEEE C37.118.1 Std. [12] and following the test procedures defined in the IEEE Test Suit Specification [13] is carried out considering various settings for the PMU under test. In order to assess the impact of different settings, only one parameter was changed at a time while the rest remained unchanged. Fig. 12 illustrates the sample results of one static (i.e., out-of-band test) and Fig. 13 depicts the sample results of one dynamic type test (i.e., frequency ramping test). The selected settings of the PMU under test for the presented results in Fig. 12 and Fig. 13 are given in Table 2. PMU is evaluated applying the requirements for the M performance class. For the Out of Band (OOB) compliance test, frequency of the fundamental power signal is set equal to the system nominal frequency; and measurements are not evaluated in the “excluded frequency range”, defined as the nominal frequency half of the reporting rate (i.e., 30-90 Hz). Frequency ramping compliance for the M-class
Table 2. Selected settings of the PMU under test.
Nominal Frequency (Hz) 60
Window Length
(cycles of nominal frequency) 6 Reporting Rate
PMU is executed with the ramp of frequency applied to three phase balanced input signals in the range of ±5 Hz, with the rate of 1 Hz/s.
The TVE, FE and RFE metrics evaluated for four different window functions reveal a significant difference in their performance while exposed to test signals. The Raised-Cosine is attributed the worst performance in all the fulfilled tests, mainly due to its low frequency resolution and the lowest side-lobe attenuation. The Hamming window
Figure 12. TVE, FE and RFE metrics for PMU performance assessment during the standard static type test (i.e., out-of-band test).
36
during dynamic tests where it violated the desired estimation error. Flat Top windowing approach has the best comparative performance regarding the voltage magnitude and angle measurements during the static test. While measuring voltage vectors precisely, it can be seen that the error in measuring the frequency is higher using the Flat Top algorithm compared to the Blackman windowing function (Fig. 13). The reason for this observation is activation of the adaptive frequency tracking option for better estimation performance during the off-nominal frequency measurements. Consequently, the time offset is present
Figure 13. TVE, FE and RFE metrics for PMU performance assessment during the dynamic type tests (i.e., ramping frequency test).
and the measurement of the frequency is not deemed accurate. On the other hand, the Blackman filtering approach has the best performance regarding the accurate measurements of the frequency, while the TVE is insignificantly above the allowed limits. In addition, even though the limits for the existing errors in the measurements of the ROCOF are not specified in the IEEE standard for all tests, it is worth to mention that among the different algorithms studied, the deviation is noticeable (Fig. 12 and Fig 13), and if this measurement is going to be used as the application input parameter, one should be careful in choosing an appropriate filter function.
From the results obtained in this testing stage, one can foresee that a synchrophasor-based fault location algorithm based on only voltage/current estimates will have the best performance and accuracy if the Flat-Top window function is implemented in the corresponding PMU. This hypothesis is verified in the next stages of the proposed testing framework.
3.4. Proposed Novel Assessment Metrics Beyond the Scope of the Standards* 3.4.1. Introduction - Why do we need them?
Some conditions that PMU under test is seeing during the evaluation according to the IEEE std., take into account wide range of signals (i.e. frequency range from 45 to 65 Hz, or voltage magnitude equal to 10% of nominal value). These conditions are not very likely to happen in real-world, nevertheless, are important to certify a PMU calibration procedure. Consequently, even if the PMU under test fails in one of such test conditions, that does not imply that the tested device is 100% unreliable while exposed to extreme signal conditions. Moreover, the outcome from the testing results can be even incorrect,
38
and the PMU that does not comply with the standard could perform better in the filed environment, than the PMU that passed the test, as it can be seen from the sample results acquired during the calibration process of the commercial PMUs, Fig. 14a. Therefore, rather than solely a pass/failed status, we proposed new metric that highlights the success rate of all the test scenarios within a given type test and, as a result, it is a reliable measure to recognize sustainable problems in a PMU device and differentiate them from ephemeral conditions that might have led to a test failure.
Furthermore, the PMUs may pass all the static and dynamic tests, but the test results do not reflect the uncertainty level of the test acceptance. In other words, the original test results do not reveal how close the errors a
![Figure 6. The developed PMU calibration and automated testing set up. Adapted with permission from[111]](https://thumb-us.123doks.com/thumbv2/123dok_us/798804.2600951/41.918.165.781.140.489/figure-developed-pmu-calibration-automated-testing-adapted-permission.webp)