COMPLEX ECOSYSTEMS
by
Nina Sanapareddy
A dissertation submitted to the faculty of The University of North Carolina at Charlotte
in partial fulfillment of the requirements for the degree of Doctor of Philosophy in Bioinformatics and Computational Biology
Charlotte 2011 Approved by: ______________________________ Dr. Anthony A. Fodor ______________________________ Dr. Christine Richardson ______________________________ Dr. Shannon Schlueter ______________________________ Dr. Zhengchang Su
©2011 Nina Sanapareddy ALL RIGHTS RESERVED
NINA SANAPAREDDY. Using bioinformatics to analyze the role of microbial taxa in complex ecosystems. (Under the direction of DR. ANTHONY A. FODOR)
Microbes are abundant on earth and play a crucial role in the environment they inhabit. Before the dawn of metagenomics, the study of the effect of microorganisms on their environment was limited due to use of low throughput techniques that could only examine single organisms or a few at a time. Metagenomics is a fast growing field of science that permits investigation of microbes by directly extracting DNA from the environment. A lot of environments, ranging in complexity from the ocean to acid mines, from wastewater communities to the human body have been targeted by metagenomics studies, and these studies generate tremendous amounts of data and newer and more efficient bioinformatic tools and methods are needed to interpret this complex data.
In this dissertation we used bioinformatic tools to enrich our understanding of the role that microorganisms play within some important but understudied microbial environments. In Chapter # 1, we report an increased microbial richness associated with colorectal cancer. This is an important finding that could lead to the development of diagnostic methods to identify individuals at high risk of developing colorectal cancer and this early detection could help devise preventive strategies. In Chapter # 2 we discuss a batch-effect we discovered in our colorectal cancer project and how filtering out the batch-effect helped us in revealing the true biological signal. In Chapter #3 we report results of a metagenomic survey where we analyzed the pyrosequences obtained from a wastewater community. In Chapter # 4 of this dissertation we perform a systematic
comparison of some of the methods used in taxonomic profiling of microbial communities and show how the choice of method can have an effect on a community’s taxonomic profile.
Overall, this dissertation demonstrates the value of using bioinformatic tools during the course of analysis of complex communities, in not only filtering out artifacts and in choice of analysis pathways but also in discovering important biological effects.
DEDICATION
This thesis is dedicated to my parents, who taught me the persistence and tenacity that I needed to fulfill my ambition. Without their unconditional support and encouragement, my goal of completing doctoral level education would’ve been difficult to achieve.
ACKNOWLEDGEMENTS
To start with, I would like to acknowledge the funding support from NIH; through grants: P30DK034987, R01 CA44684, P50 CA106991, R01 CA136887, and K01 DK 073695; for the colorectal cancer project, which gave rise to the Chapters 1 and 2 of this dissertation.
In addition, I am grateful to Dr Temitope O Keku, Associate Professor, UNC Chapel Hill, for being generous enough to allow us to analyze the very interesting colorectal cancer dataset. I appreciate Jon Mccafferty for helping me find chimeric sequences in the dataset described in Chapter 1 and Timm Hamp for his reliable and remarkable molecular biology skills in generating the wastewater dataset that was discussed in Chapters 3 and 4 of this dissertation. I would also like to thank everyone in my research group for
providing a very productive, stimulating and pleasant environment to work in. I am greatly indebted to my advisor Dr Anthony A. Fodor, for imparting his
invaluable bioinformatics expertise to me and for providing the training, guidance, advice and direction throughout the course of my research. Finally, I would like to express my gratitude to my friends and family who have been a constant source of encouragement and support during this very important and demanding period of my life.
INTRODUCTION
The significance of microbes in the environment they inhabit: Microbes are everywhere and their presence always affects the environment that they are growing in. Microbes are found in almost every habitat on earth, ranging from extreme climates like acidic hot springs [1], radioactive waste [2], and Earth's crust [3] to relatively moderate ones like inside and on the surface of the plants and animal bodies [4]. Nearly all animals, plants and certain types of fungi are dependent on microbes because the microbes make vital minerals, nutrients and vitamins accessible to their hosts[5]. Microbes inhabit animal digestive systems, their mouths, their skin and many other organs and are important for the maintaining the health of their animal hosts. Comparisons of germ free mice with those colonized with microbiota[6], have shown that the microbiota help regulate energy balance, not only by extracting calories from otherwise indigestible components of our diet but also by controlling host genes that help in storage of the extracted energy. These studies thus conclude that manipulating the microbial composition may be helpful in regulating the energy balance in the hosts [7],[8],[9].
The role that microorganisms play in their environment has been a central focus of microbiology for a long time. However, in the past, microbiology focused on isolating one or a few species at a time, by culturing them individually, so very little insight was gained about all the members of that community, as a whole. Metagenomics, sequencing of DNA extracted directly from environmental samples is a new tool that helps us study microbes, not as separate entities but as a whole, in complex communities. Metagenomic studies on a wide variety of environments including the ocean, soil, thermal vents, acid
mine drainages and the human microbiome are helping to reveal the vast microbial diversity that has been hidden from us in the past due the limitations of the preexisting technologies[10], [11], [12]. Metagenomics has rapidly advanced in the recent past and this growth can be attributed, not only to the technical and analytical methods developed from high throughput platforms but also to the simultaneous advancements in the associated bioinformatics and statistical software [13-14].
Metagenomic analysis of microbial communities: The term “metagenome”[15] was coined by Jo Handelsman and was initially used to describe a collection of genes, from a number of genomes, sequenced directly from the environment that could be analyzed in the same way as a single genome. Recently though, metagenomics is being used in a broader sense, to describe any sequencing of genetic material from uncultured environmental samples, whether it is from an entire community, a single organism, all the genes or just one gene (like the 16S rRNA gene). Kevin Chen and Lior Pachter (researchers at the University of California, Berkeley) defined metagenomics as "the application of modern genomics techniques to the study of communities of microbial organisms directly in their natural environments, bypassing the need for isolation and lab cultivation of individual species."[16].
The quality and quantity of results obtained from a metagenomic analysis of any community will be dependent upon the procedures used for sampling the community, on the molecular biological methods like DNA extraction on the sequencing methods used, and on the bioinformatic and statistical analytical methods used. Deciding on the best way to sample a microbial community for metagenomics is one of the biggest challenges faced in the planning phase of any metagenomic study. Time-course studies gauge the
response of the inhabitant microbes to changing conditions over time. These studies lead to a better understanding of the overall community structure, function, and its robustness to the changing conditions. Similarly, to comprehend the role of host-associated microbial communities in host development and health requires not only sampling from the same host over time (longitudinal studies), but also assessing host-to-host variation at a given point of time (cross-sectional and case-control studies). Habitat and host variability add more levels of complexity the already complex sampling related issues. Another source of variability, which is crucial in metagenomics studies, is technical variability. In studies involving large sample sizes, sometimes the samples are processed in batches and the quality of the data will depend on ensuring that, as far as possible, same reagents, protocols, personnel, technologies etc. be used for all the batches in a study. In addition, making sure that biological variables (example disease status) do not overlap with technical variables (example sequencing date) will assure that the results obtained are due to biological differences between samples and not technical differences. As biological and computational methods become more efficient, we will be able to draw more robust conclusions from analysis of complex metagenomic communities, but issues relating to sampling and sequencing procedures and the choice of the methods used for bioinformatic and statistical analysis of the community in question should be considered, not only in the beginning but also throughout the course of any metagenomic study.
Advances in sequencing technology and its effect on analysis of complex ecosystems: Initially environmental gene sequencing focused on specific genes (often the 16S rRNA gene) to obtain a profile of the microbial diversity in the environmental sample. More recently, however, “shotgun Sanger sequencing, massively parallel pyrosequencing”, or
Illumina sequencing [17] have been used to obtain sequences of all genes from all
members of sampled communities. These studies, whether the focus is on a single gene or on all the genes, revealed that culture based methods missed a majority of the microbial diversity within the environment[18].
Shotgun sequencing, the approach which had been used to sequence many cultured microorganisms[19]as well as the human genome [20], randomly shears the extracted genomic DNA into many short sequences before sequencing them. These short fragments were sequenced by Sanger sequencing [21] in earlier studies but in the recent past high-throughput sequencing methods are being increasingly used [13], [22]. The Sanger sequencing method (Sanger et al., 1977) is based on synthesizing DNA based on a single stranded template while randomly incorporating chain terminators, and the different fragment sizes generated by this sequencing method coincide with to the chain-terminator locations. In the last decade, the average length of a sequencing-read generated by Sanger sequencing has increased from around 450bp to 850bp. Due to the fact that the Sanger method runs one sequencing reaction at a time, large metagenomic studies that utilize Sanger sequencing could only be carried out at large genome centers with hundreds of sequencing machines, all of them working simultaneously to sequence the metagenome. Until now, the largest such metagenomic study to have utilized Sanger sequencing is the Sorcerer II Global Ocean Sampling (GOS) expedition [23], lead by Dr Craig Venter (well known for his role in the Human Genome Project). The enormous size of this study can be appreciated by the fact that just the pilot project of this study (conducted in the Sargasso Sea) yielded DNA from about 2000 different species, 148 of which were completely novel bacteria[24]. This study ended up increasing the size of protein
databases to almost twice their original size by adding millions of predicted protein sequences and thousands of protein families to the protein databases.
New sequencing approaches, made possible by parallel advances in fields of enzymology, imaging and microfluidics, have increased sequencing capacity but are not associated with the huge infrastructure involved in earlier sequencing methods. Most sequencing processes involve an initial amplification step that amplifies the DNA. In the Sanger method, this is usually done by cloning, where the DNA is incorporated into a plasmid and the clones are then grown. Due to a number of reasons (fragment toxicity, replication inhibition etc.) the bacteria, mostly E. coli, into which the plasmids are transformed, can selectively amplify certain fragments of DNA inducing a bias in this step. To overcome the aforementioned shortcomings of the in-vivo methods, Margulies et al developed a high throughput strategy for in-vitro amplification that has an added advantage of also being inexpensive relative to Sanger sequencing. This method [25] is commonly known as 454 pyrosequencing after 454 Life Sciences (Branford, CT, USA), the company that commercialized this technology. With the high accuracy, low cost, and relatively long reads associated with some “next generation” methods like 454 sequencing and Illumina sequencing, many researchers have migrated away from traditional Sanger capillary sequencing instruments and toward these sequencing platforms for a variety of their genome projects. Forest Rohwer’s group at San Diego State University were the first to use next generation sequencing, pyrosequencing developed by 454 Life Sciences[25], for sequencing community DNA[26]. Even though the 454 sequencing method generates shorter sequence lengths, it compensates for that by generating very large number of sequences compared to traditional Sanger sequencing
methods. The newly available titanium platform, from 454, allows reads as long as 400bp and is therefore beginning to approach the read lengths reachable through traditional Sanger methods[27]. More recently the Illumina sequencing technology[17] is being increasingly used for shotgun metagenomic studies[22] including for the Human Microbiome Project; due to its lower cost and lower error rates than the pyrosequencing method.
Bioinformatics methods and challenges in community analysis: Analysis pipelines of many early metagenomics studies concentrated on gathering enough sequence information to characterize complete genomes from the concoction of metagenomic sequences. This was possible for low complexity environments, such as an acid mine drainage ecosystem [28], by using various complicated “binning” methods (grouping sequences based on oligonucleotide signatures). Whereas in more complex environments like soil or ocean samples, assembly still remains one of the major analysis limitations. Sequence data from complex environments, due to high levels of microbial diversity, is heterogeneous and in most cases contains an unequal representation of the constituent species. In addition, organisms in a complex environment frequently belong to closely related strains, whose genomes are highly similar, making it practically impossible to construct assemblies of each organism present in a sample. Also, viruses and/or inserted phages, if present, increase the possibility of generating chimeric contigs[29] that further impede assembly. The short-reads associated with newer generation sequencing methods, like 454 sequencing and Illumina sequencing, impose further complications. Due to the limitations in assembly of metagenomic data, gene prediction methods used in metagenomic analysis have been adapted to work with large numbers of fragmented
genes on short sequences. However, due to the phylogenetic diversity in samples it is difficult to find appropriate training sets for “intrinsic” gene finding in metagenomes. Consequently, extrinsic gene finding strategies that find coding regions based on their similarity to genes and coding regions in a reference database have been used. Some studies (e.g.[30], [31] ) skip gene prediction altogether and focus only on the ‘known fraction’ of their dataset by limiting the downstream analyses to the BLAST annotated portion of their reads. These studies rely on direct classification of raw reads by homology to existing sequences in sequence databases[32] but the disadvantage of this approach is that it will miss genes from novel organisms that have no close relative (homologs) in the sequence databases.
Taxonomic profiling of metagenomic reads: Assessing the composition of the community in question is one of the crucial steps in understanding the role that microbes play in their environment. Traditionally, 16S rRNA gene sequences have been used for taxonomic assignment in genomes extracted from cultured organisms [33]. The sequencing of 16S rRNA genes from new species is made possible by the presence of highly conserved regions at several positions, well-located, along the gene [34]. The conservation of these regions allows one to design and use broadly targeted oligonucleotide primers that work on a wide diversity of species for both sequencing and amplification by the polymerase chain reaction (PCR). The amplified products can then be characterized in multiple ways; such as through restriction digestion[35], denaturing gradient gel electrophoresis[36-37], hybridization to arrays[38], or sequencing [39],[40],[41],[42]. As sequencing continues to decrease in cost and difficulty, it has
become the preferred option and therefore we focus only on sequence analysis in this dissertation.
The length of the gene targeted using 16S rRNA gene sequencing, not surprisingly, has been dependent on the sequence length options offered by the sequencing technology available at the time the study was initiated. This is corroborated by the fact that earlier sequencing studies, targeting the 16S rRNA gene, captured either the entire or most of 16S rRNA gene, using the longer read-length associated with traditional Sanger sequencing. Recently, with the rapid development of next generation sequencing technologies, uncultured bacteria from complex environments have been sequenced at a much lower cost than Sanger dideoxy sequencing. One of the earliest examples of the use of pyrosequencing in surveying microbial diversity is the exploration of the “deep sea” by Sogin and colleagues [43]. One of their reasons for choosing the V6 region for the study is that the shorter length of V6 variable region of the 16S rRNA (~65bp), compared to the other 16S variable regions, makes it amenable for capture by the 100-bp reads generated by the pyrosequencing technology (GS-20), available at that time. More recently, the read length of 454 pyrosequencing machines has been increased to an average of 250bp (GS-FLX) and later to 400bp (454-titanium). This opened up more options for primer design and allowed the possibility of targeting regions of the 16S rRNA gene other than just the V6 region[44]. Using these newly available technologies, a vast numbers of “partial sequences” from 16S rRNA genes of environmental DNA have been generated and analyzed. The use of partial 16S rRNA sequences has been feasible due to studies that found that even fragments of the 16S rRNA gene can be used as substitutes for the full-length sequence, in many community analyses [45-46]. The
pyrosequencing approach has been used to target a wide range of microbial communities and variable regions of the 16S rRNA gene, including the V6 region in deep-sea vents microbial communities [43]; V1, V2, V6 and V3 regions in human gastrointestinal tract [39],[47],[48]as well as the V9 region in soil-derived microbial DNA[49].
Whole genome sequence based methods that utilize the random or shotgun sequences, generated from the entire DNA of the environmental sample[10], for characterization of the community, have been suggested as a potential alternative for rRNA gene sequence-based studies. These methods, also known as “metagenomic methods”, are indeed very powerful in that they bypass some of the limitations of PCR methods and, in the process, generate sequence data of many genes, including the 16S rRNA gene, from the many organisms present in a community. Taxonomic profiling of a community using random whole genome sequence reads can not only characterize “Who is there?” but can also be used to predict “What they are doing?”[50]. In some cases, application of shotgun metagenomics has led to the discovery of novel lineages of organisms that have been entirely gone undetected by rRNA gene PCR methods [51].
Metagenomics is most likely to help us reveal the complex microbial communities, inhabiting nearly every environment and organism on Earth, that have been invisible so far due to the limitations of pre-existing technologies. Extracting all the possible information from metagenomic libraries will continue to be difficult, mainly because of the massive size and complexity of the datasets. Greater sequencing depth enabled by the lower cost and higher resolution of new technologies would make it possible to detect the rare yet important members of our biosphere. But more importantly, improvements in bioinformatics tools will make it easier to interpret the metagenome sequence data and in
some cases may help assemble whole genomes from metagenomic sequence data. Even in communities where assembly is not possible bioinformatic tools, by unearthing the microbial composition of the community in question, can help us move closer towards a better understanding of the role microbes play in an environment.
In Chapters#1 and #3 of this dissertation we discuss metagenomic analyses of some understudied microbial communities, during the course of which we touch upon some of the bioinformatic challenges, mentioned above, which arise during these analyses. In Chapter 2 we talk about batch-effects that are one of the major challenges faced during metagenomic analysis and how such effects can mask the true biological signal. In Chapter#4 we provide a comparative exploration of some the taxonomic composition estimating tools used during metagenomic analyses to exemplify the effect of analysis choices on the results of a metagenomic study.
TABLE OF CONTENTS
LIST OF TABLES xxi
LIST OF FIGURES xxii
LIST OF ABBREVIATIONS xxv
CHAPTER 1: INCREASED MICROBIAL RICHNESS IS ASSOCIATED WITH 1 HUMAN COLORECTAL ADENOMAS
1.1 Abstract 1
1.2 Background and significance 1
1.3 Materials and Methods 3
1.3.1 Patient characteristics 3
1.3.2 DNA extraction and sequencing 4
1.3.3 Data Filtering 5 1.3.3.1 Sample filtering 5 1.3.3.2 Sequence filtering 5 1.3.3.2.1 RDP Pipeline 5 1.3.3.2.2 OTU Pipeline 6 1.3.4 Bacterial Identification 6 1.3.4.1 RDP assignment method 6
1.3.4.2 OTU assignment method 6
1.3.5 Richness and Evenness 7
1.3.6 Data Preprocessing 8
1.3.6.1 Normalization 8
1.3.6.2 Removal of rare taxa 8
1.3.7 Tree Generation 8
1.3.9 Data Validation 9
1.3.9.1 Real-time quantitative PCR validation 9
1.3.10 Nucleotide sequence accession numbers 10
1.3.11 Statistical analyses 10
1.4 Results 11
1.5 Discussion 14
CHAPTER 2: FILTERING OUT BATCH-EFFECTS IN METAGENOMIC 20 ANALYSIS REVEALS A TRUE BIOLOGICAL SIGNAL
2.1 Abstract 19
2.2 Background and significance 19
2.3 Materials and Methods 20
2.3.1 Methods 20
2.3.2 Bacterial Identification 20
2.3.3 Statistical analyses 21
2.4 Results and Discussion 21
2.4.1 Descriptive characteristics of study participants 21 2.4.2 All samples clustered into two distinct groups 22 2.4.3 The distinct clustering was due to a batch-effect 23
2.4.4 Batch-1 had a biological signature 23
CHAPTER 3: MOLECULAR DIVERSITY OF A NORTH CAROLINA 35 WASTEWATER TREATMENT PLANT AS REVEALED BY PYROSEQUENCING[117]
3.1 Abstract 35
3.2 Background and significance 36
3.3 Materials and Methods 37
3.4.1 Our sequence set largely fails to assemble, although contigs that 40 were generated from the assembly include many transposons and
hypothetical proteins.
3.4.2 The majority of taxa in the wastewater treatment plant cannot be 41 classified at the Genus level.
3.4.3 16S rRNA gene sequences from freshwater, soil and other wastewater 43 studies dominate our sequence set.
3.4.4 Sequenced bacterial genomes are not well represented in the wastewater 44 metagenome.
3.4.5 When mapped to protein space, the wastewater metagenome displays a 48 distinct metabolic profile.
3.5 Summary 48
CHAPTER 4: COMPARISON OF 16SrRNA GENE SEQUENCE BASED 60 TAXONOMIC PROFILING TO WHOLE GENOME SEQUENCE
BASED TAXONOMIC PROFILING METHODS
4.1 Abstract 59
4.2 Background and significance 60
4.3 Materials and Methods 65
4.3.1 Computational Methods 66
4.3.1.1 Targeted 16srRNA gene (PCR generated) based taxonomic profiling 66
4.3.1.2 16s Mined 66 4.3.1.3 16s Merged 66 4.3.1.4 BlastBestHit method 67 4.3.1.5 MEGAN 67 4.3.1.6 WebCARMA 68 4.3.2 Comparative Analysis 68
4.3.2.1 NCBI namespace to RDP namespace 68
4.4 Results 69
4.4.1 16srRNA mined method is more similar to the PCR targeted 70 16srRNA methods than the whole genome sequence based methods
4.4.2 The two groups of methods (16s and WGS) agree at broader 71 taxonomic levels but the degree of correlation decreases towards the specific taxonomic levels .
4.4.3 16s mined method is the only whole genome sequence based 71 method that shows potential for replacing the PCR targeted 16s sequence
based methods
4.4.4 Performance of the Whole Genome Sequence based methods is driven 72 not only the by underlying algorithm but also by the community
complexity and by the database bias
4.4.5 Different methods produce different profiles of the same community 73 as shown by Shannon Diversity measurements
4.5 Discussion 72
CHAPTER 5: CONCLUSIONS 83
REFERENCES 85
APPENDIX A: SUPPLEMENTARY MATERIALS FOR CHAPTER 1 98
LIST OF TABLES
TABLE 1.1: Descriptive characteristics of the study participants 18 TABLE 1.2: 454 dataset characteristics before and after QC for RDP and OTU 18
pipelines
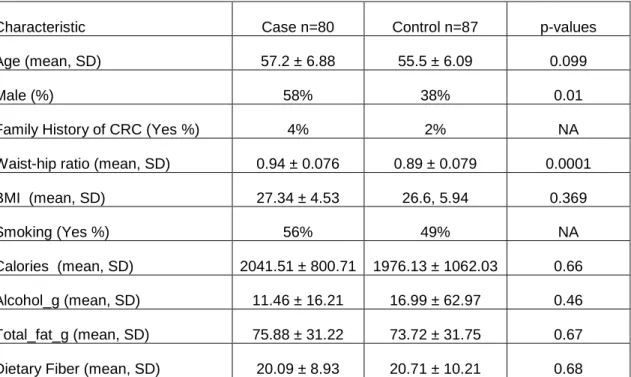
TABLE 2.1: General characteristics of the study participants 30 TABLE 2.2: T-tests on log-normalized abundances of genera in cases vs. controls 31
in cluster 1
TABLE 2.3: T-tests on log-normalized abundances of genera in cases vs. controls 32 in cluster 2.
TABLE 2.4: T-tests on log-normalized abundances of phyla in cases (80 subjects) 32 vs. controls (87 subjects), before removing batch-effect shown.
TABLE 2.5: T-tests on log-normalized abundances of genera in cases (80 subjects) 32 vs. controls (87 subjects), before removing batch-effect shown.
TABLE 3.1: The top ten assembled microbial genomes as sorted by the number 58 of hits recruited from our wastewater metagenome.
LIST OF FIGURES
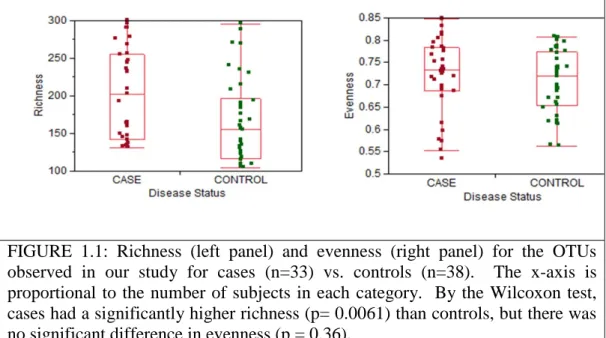
FIGURE 1.1: Richness (left panel) and evenness (right panel) for the OTUs 15 observed in our study for cases (n=33) vs. controls (n=38).
FIGURE 1.2: Maximum likelihood tree generated from the 371 OTUs in which 16 the OTU was observed in at least 25% of our patients.
FIGURE 1.3: Richness (left panel) and evenness (right panel) at the OTU level, in Normal (n=27) vs. Overweight (n=25) vs. Obese (n=18) BMI 18 categories.
FIGURE 1.4: Richness (left panel) and evenness (right panel) at the OTU level, 17 in Low-Risk (n=25) vs. Medium-Risk (n=16) vs. High-Risk (n=30)
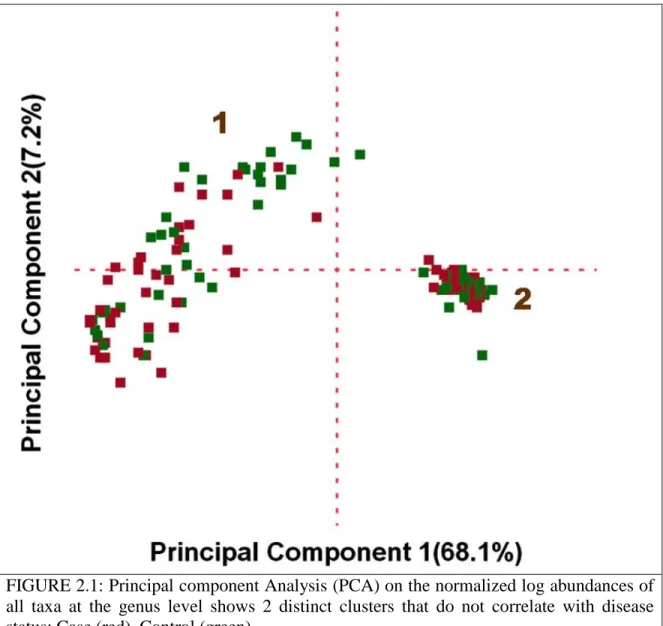
FIGURE 2.1: Principal component Analysis (PCA) on the normalized log 26 abundances of all taxa at the genus level
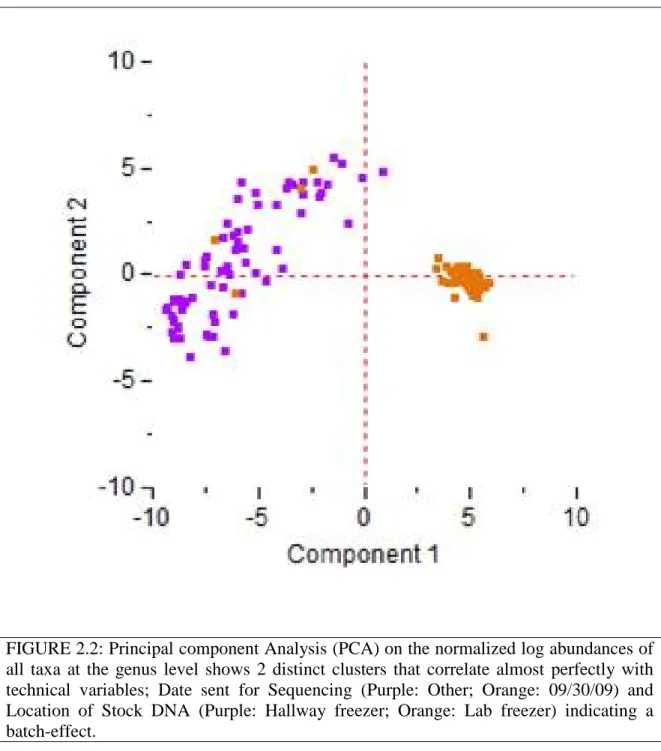
FIGURE 2.2: Principal component Analysis (PCA) on the normalized log 27 abundances of all taxa at the genus level
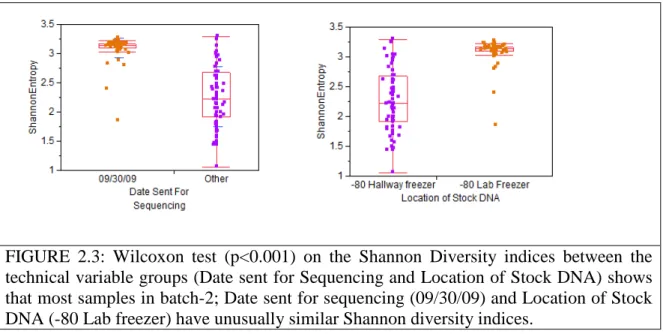
FIGURE 2.3: Wilcoxon test (p<0.001) on the Shannon Diversity indices 28 between the technical variable groups
FIGURE 2.4: Wilcoxon test (p<0.001) on the percentage of Bacteroidetes + 28 Firmicutes between the technical variable groups
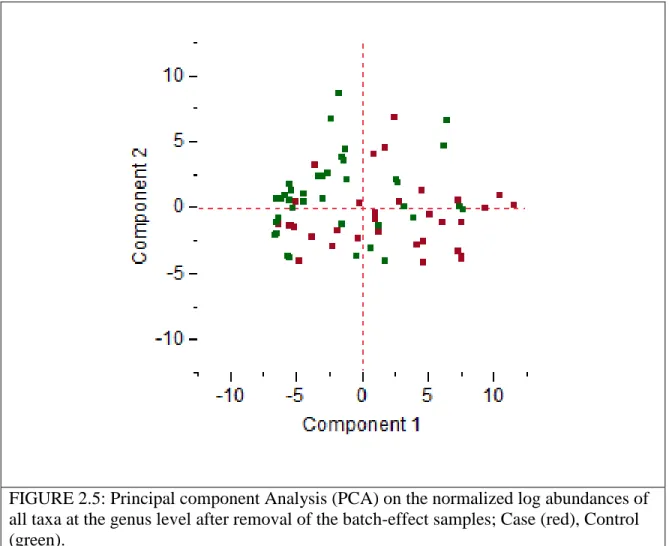
FIGURE 2.5: Principal component Analysis (PCA) on the normalized log 29 abundances of all taxa at the genus level after removal of the
batch-effect samples
FIGURE 3.1: Pie charts show taxonomic assignments for 148 16S rRNA sequences 51 within our dataset that could be classified to Phylum with an RDP
confidence scores of >=80.
FIGURE 3.2: Results from the RDP classification algorithm for 148 16S rRNA 52 sequences that can be assigned to the Phylum level with a
confidence score of >=80
FIGURE 3.3: The location (as determined by manual annotation) and e-score 53 of sequences from the 648 member pyrosequencing dataset
FIGURE 3.4: For each of the 1,442 assembled plasmids and chromosomes at 54 NCBI, the fraction covered as a function of the size of each
assembled sequence.
FIGURE 3.5: Non-specific recruitment against the Acidovorax sp. JS42 genome. 55 FIGURE 3.6: A region involving a transposase from the JS42 genome that 56
shows an exception to the pattern of non-specific recruitment.
FIGURE 3.7: Functional categories provided for our dataset by the Seed server 57 FIGURE 4.1: Shows a flowchart describing the analysis path followed in 76
comparison of taxonomic profiling methods.
FIGURE 4.2a: Comparison of the 16S sequences mined from the wastewater 77 metagenome to the PCR targeted 16S sequences and whole genome
sequences from the same environment.
FIGURE 4.2b: Comparison of the 16S sequences extracted (mined) from the 78 metagenome of the human gut microbiome to the PCR targeted 16S
sequences and whole genome sequences from the same environment.
FIGURE 4.3a: Wastewater dataset: Scatter-plots showing the high level of 79 agreement between 16sMined methods and the16sMerged
method and both BlastBestHit method at the Phylum level.
FIGURE 4.3b: Human gut microbiome dataset: Scatter-plots showing the high 79 level of agreement between 16sMined methods and the 16sMerged
method and both BlastBestHit method at the Phylum level.
FIGURE 4.4a: Wastewater Dataset: Scatter-plots showing the relatively lower 79 level of agreement between 16sMined methods and 16sMerged
method and BlastBestHit methods at the Genus level compared to the Phylum level.
FIGURE 4.4b: Human gut microbiome dataset: Scatter-plots showing the relatively 80 lower level of agreement between 16sMined methods and 16sMerged
method and BlastBestHit methods at the Genus level compared to the Phylum level.
FIGURE 4.5a: Comparison of the 16sMerged method(PCR 16S method) to all the whole genome sequence based methods shows that, for the
wastewater metagenome, the 16sMined method (WGS 16S method)
FIGURE 4.5b: Comparison of the 16sMerged method (PCR 16S method) to 81 all the whole genome sequence based methods shows that,
for the human gut microbiome dataset, the 16sMined method (WGS 16S method) performs best
FIGURE 4.6a: Shannon Diversity indices of the wastewater dataset at the
Error! Bookmark not defined.Error! Bookmark not defined. Phylum
and Genus levels using the different taxonomic profiling methods is shown
FIGURE 4.6b: Shannon Diversity indices of the human gut microbiome dataset at the Phylum and Genus levels using the different
LIST OF ABBREVIATIONS
BMI body mass index
DGGE Denaturing Gradient Gel Electrophoresis RISA Ribosomal Intergenic Spacer Analysis FISH Fluorescent in situ hybridization
TRFLP Terminal restriction fragment length polymorphism RNA Ribonucleic acid
UNC University of North Carolina DHS Diet and Health Study IRB Institutional Review Board DNA Deoxy-Ribonucleic Acid
CAGE Core for Applied Genomics and Ecology PCR Polymerase Chain Reaction
QC Quality Control
RDP Ribosomal Database Project OTU Operational Taxonomic Unit BLAST Basic Local Alignment Search Tool EPA Evolutionary Placement Algorithm q-PCR Quantitative Polymerase Chain Reaction PCoA Principle Coordinate Analysis
FDR False Discovery Rate WHR Waist to hip Ratio
SEM Standard Error of the Mean SD standard deviation
PCA Principle Component Analysis
NPDES National Pollutant Discharge Elimination System
CBOD5 Carbonaceous Biochemical Oxygen Demand (5 day test) CFU Colony Forming Units
COD Chemical Oxygen Demand
NCBI National Center for Biotechnology Information GOS Global Ocean Survey
EPBR enhanced biological phosphate removal BNR Biological Nutrient Removal
MEGAN MEta Genome ANalyzer
CARMA Characterizing short Read Metagenomes LCA Least Common Ancestor
pHMM Profile Hidden Markov Model EGT Environmental Gene Tags Pfam Protein Family
DZ Dizygotic
MB Megabases
HUMAN COLORECTAL ADENOMAS
1.1 Abstract
Differences in gut microbial community composition have been linked to many important human diseases including obesity, Crohn’s disease, Ulcerative Colitis [52], [53], [54] and colorectal cancer. Previous studies that suspected a link between commensal gut bacteria and colorectal cancer, however used low throughput methods [55], [56], [57]. In this study, we employed 454 titanium pyrosequencing of the V1-V2 region of the 16S rRNA gene to characterize adherent bacterial communities from mucosal biopsies of 33 adenoma subjects and 38 non-adenoma subjects. We found 87 taxa (including known pathogens) that had significantly higher relative abundances in cases vs. controls while only 5 taxa that were more abundant in control samples. In addition, adenoma samples had a pronounced increase in average microbial richness suggesting that conditions associated with colorectal adenomas create an environment in which potentially pathogenic microbes can flourish. Intriguingly, the magnitude of the differences between adenoma case and control in the gut microbiota was more pronounced than differences in the microbiota associated with patient obesity. Because the microbial signature associated with colorectal adenomas is generally distinct from microbial signatures associated with known risk factors such as increased body mass
has potential utility as a diagnostic tool indicating the presence of adenomas. 1.2 Background and significance
The human microbiome, the microbes that are associated with the human body, outnumber our own “human” cells 10 to 1[58] and provide us with a wide array of vital metabolic functions that we are lacking in[12]. The role that these “beneficial” microbes, play in health and disease, has been explored in the past, but only recently has the technology reached a point where the species present within an individual's microbiome can not only be accessed but identified [59], [12], [60], [61], [62], [63]. Recent research has shown that the relationship between the gut bacteria and humans is not just commensal (non-harmful coexistence), but is in fact symbiotic (mutually beneficial)[64]. For instance, microbes living in the our gut help us in digestion of food, in disruption of toxic compounds and in combating disease-causing pathogens[65]. Changes in these microbial communities may be responsible for digestive disorders [66-67],[68], skin diseases [63], obesity [69],[8],[59],[7],[70],[71],[72] and a range of “immuno-pathologic” conditions including inflammatory bowel diseases [73],[74],[75-76]. These studies suggest that each individual person is a “microbial island”, meaning that each has their own unique bacterial signature just as each individual has a unique fingerprint. However, our gut microbiomes share a core group of genes that carry out some core functions and the differences in this “core set” can define different physiological states or phenotypes (for example lean and obese)[52]. In spite of the strong individual differences in the microbial community, researchers studying the human microbiome often perform cross-sectional, “case-control” studies, which look for differences in bacterial populations
between patients who have a specific disease and those who do not[68], [77-78]. These studies have shown distinct microbial signatures of disease groups that separate cases from controls in diseases such as periodontal disease and gastric cancer [79], [80], [67]. The results from these studies indicate that disruption of the human microbiome levels plays a crucial role in human health and disease and that these changes can be indicators of the disease status in the human hosts. As a possible mechanism, Mazmanian et. al. have proposed that “the equilibrium between potentially harmful and potentially beneficial bacteria in the gut mediates health versus disease”[81]. Under this model, if the balance is altered by changes, for instance due to diet, stress or antibiotics, then the immune response in the intestines is also changed leading to inflammation. This change in host-microbe relationship, called “dysbiosis”, has been associated with numerous gastro-intestinal diseases like inflammatory bowel disease [77] colon cancer [55] obesity [7-8, 70] and diabetes [78]. Chronic inflammation leads to cancer, and this mechanism has been suggested as a possible trigger for inflammation and colon cancer in animal models [82].
Colorectal cancer is the second most common cancer in women and third most common cancer in men in the Europe and is the second leading cause of death resulting from cancer in both sexes[83], in developed countries. Although age, tobacco and alcohol consumption, physical activity and body weight are considered important risk factors for colorectal cancer[84], the most significant risk factor happens to be diet [85], [86] . In addition to the various factors mentioned above, the role of host associated microbiota has also been frequently proposed as a critical factor in colorectal cancer [55],[87],[88],[57]. Recent studies have investigated the possible role of the microbial
component of the colon in Colorectal Cancer [55] and have used culture independent approaches to explore the distal gut’s microbiome diversity and stability in individuals with colorectal cancer [88]. These studies[87], [88], used 16S rRNA gene denaturing gradient gel electrophoresis (DGGE) and ribosomal intergenic spacer analysis (RISA) to explore of the microbial diversity in the fecal samples in case and control subjects. Recent research on the mucosal adherent microbial component of the colon [89] showed that the bacterial community profiles of healthy individuals are stable along the length of the colon. While each individual has a distinct bacterial profile, there is some overlap between the mucosal-associated bacterial communities among individuals [87].
In a recently published study[57], our collaborator Dr Keku Temitope and her colleagues characterized the adherent bacteria in normal colon and in the diseased colon by fluorescent in-situ hybridization (FISH) analysis of the 16S rRNA genes as well as by terminal restriction fragment length polymorphism (TRFLP) and Sanger sequencing of 16S rRNA clones. Their study showed that a distinct microbial signature is associated with colorectal adenomas. The work described in this Chapter, is a further extension of Dr. Temitope’s study via the utilization of second-generation sequencing technology, to provide deeper coverage of bacterial communities and to characterize the gut microbial communities of a larger set of patients.
1.3 Materials and Methods 1.3.1 Patient characteristics
Subjects were screening colonoscopy patients at UNC Hospitals who agreed to participate in the Diet and Health Study (DHS V) and the characteristics of these subjects are shown in Table 1.1. The enrollment procedure as well as colonoscopy and biopsy
procedures and sample collection have been previously described [90], [57]. The study was approved by the Institutional Review Board (IRB) at the University of North Carolina, School of Medicine (Protocol #05-3138).
1.3.2 DNA extraction and sequencing
Bacterial genomic DNA was extracted from mucosal biopsies; the biopsies ranged in weight between 10-20 mg. Two biopsies per subject were used for bacterial DNA extraction and these were placed in lysozyme (30mg/ml; Sigma, St. Louis MO) for 30 minutes. The biopsy-lysozyme mixture was homogenized on a bead beater (Biospec Products Inc., Bartlesville, OK) at 4,800 rpm for 3 minutes at room temperature followed by DNA extraction using the Qiagen DNA isolation kit (cat # 14123) per the
manufacturer’s recommended protocol. The mucosal adherent microbiome was analyzed by Roche 454 titanium pyrosequencing of 16S rRNA tags from genomic DNAs.
Pyrosequencing [25] was conducted at the University of Nebraska Lincoln Core for Applied Genomics and Ecology (CAGE). We amplified the V1-V2 region (F8-R357) of the 16S rRNA gene from mucosal biopsies followed by titanium-based pyrosequence analyses. The 16S primers contained the Roche 454 Life Science's A or B Titanium sequencing adapter (italicized), followed immediately by a unique 8-base barcode sequence (BBBBBBBB) and finally the 5' end of primer A8FM, 5'
-CCATCTCATCCCTGCGTGTCTCGACTCAGBBBBBBBBAGAGTTTGATCMTGGC TCAG-3' and B-357R,
5'- CCTATCCCCTGTGTGCCTTGGCAGTCTCAGBBBBBBBBCTGCTGCCTYCCGTA-3’. Each DNA sample was amplified with uniquely barcoded primers, which allowed us to mix PCR products from many samples in a single run.
1.3.3 Data filtering 1.3.3.1 Sample filtering
We screened all the samples for a batch-effect that correlated with the date of submission to the sequencing center. Samples were shipped on 3 separate dates from Chapel Hill to the sequencing center in Nebraska. Samples shipped on one particular date (09/30/2009) were found to cluster separately from samples shipped on other dates (06/10/2008 and 7/21/2008). The DNA stocks of these 2 groups of samples were also stored in different freezers at the Chapel Hill lab. In addition, the sum of Bacteroidetes and Firmicutes observed in samples shipped on this date was much lower than we would expect based on both previously published human gut microbial 454 datasets and our own 454 datasets. Sequences generated from samples sent to the sequencing center on this date were therefore removed from further analysis. Leek et al. recently showed the importance of screening high throughput datasets for batch-effects [91] and screening for batch-effects indeed proved useful in removing the technical artifacts from our dataset. The descriptive characteristics and of the 71 samples, 33 cases and 38 controls selected after sample filtering, are shown in Table 1.1.
1.3.3.2 Sequence filtering 1.3.3.2.1 RDP Pipeline
The first step in the data analysis process involved a preliminary QC (quality control) filter (downstream of the Roche-454 GS-FLX software filtering). We removed sequences from our dataset if there were any Ns in the sequence or the 5’ primer did not exactly match the expected 5’ primer or if the average quality score was less than 20. We then removed the 5’ primer sequence from our reads that have survived above filtering. Only
trimmed filtered sequences with a length between 200-500bp were kept in our data set for RDP analysis.
1.3.3.2.2 OTU Pipeline
We removed sequences from inclusion in the OTU dataset if there were any Ns in the trimmed sequence or if the 5’ primer did not exactly match the expected 5’ primer. As recommended by Kunin et. al.[92], sequences were end-trimmed with the Lucy algorithm [93] at a threshold of 0.002 (quality score of 27). Only reads with trimmed lengths between 150 and 450 were retained for OTU analysis. Table 1.2 shows the number of sequences removed by our RDP and OTU pipelines.
1.3.4 Bacterial Identification
The sequences in our dataset were given taxonomic assignments based on two methods.
1.3.4.1 RDP assignment method
Sequences that have been filtered using the RDP pipeline (Table 1.2) were submitted to the RDP Classifier 2.1 algorithm for taxonomic identification at various taxonomic levels. Sequences assigned in each sample to various taxa, from phylum level and genus level, were counted at the RDP confidence threshold of 80.
1.3.4.2 OTU assignment method
OTU analysis is more sensitive to sequencing error[92] and we therefore applied additional QC steps in our OTU analysis pipeline (Table 1.2). Sequences filtered through
the OTU pipeline were submitted to Abundant OTU
(http://omics.informatics.indiana.edu/AbundantOTU/) for assignment of each sequence to operational taxonomic units (OTUs; 97% identity). Sequences assigned in each sample to
various OTUs were counted and then normalized and log transformed (see Data Preprocessing), before proceeding to further downstream analyses. Consensus sequences generated by AbundantOTU during construction of OTUs were submitted to RDP classifier 2.1 to assign taxonomy to each of the OTU groups. Consensus sequences of the
613 OTUs generated by AbundantOTU (available as
Sanapareddy_SupplementaryDataFile1) were also submitted to ChimeraSlayer [94] ( http://microbiomeutil.sourceforge.net/) and the 9 consensus OTUs identified by chimera slayer as chimeras were removed from our dataset. In addition consensus sequences of 4 OTUs on BLAST (http://blast.ncbi.nlm.nih.gov/Blast.cgi) search against the Silva reference 16S database failed to match with >97% sequence identity so these were also removed from further analysis. This left a total of 600 OTUs.
1.3.5 Richness and Evenness
Shannon-Wiener Diversity Index, H, was calculated using the equation, H = -∑ Pi (lnPi), where Pi is the proportion of each species (taxa) in the sample. Richness was calculated as the number of OTUs, genera or phyla observed in 2,636 sequences (where 2,636 is the number of sequences seen in the sample with the fewest sequences). For each sample, 2,636 sequences were randomly chosen 1,000 times and the average number of OTUs, genera or phyla observed over these 1,000 permutations was reported as richness.
Evenness measures how evenly the individuals are distributed among the different species/taxa and is calculated by J= H’/Log (S) where H’ is Shannon diversity and S is the number of species or taxa in each sample. Wilcoxon-tests and Student’s t-tests were performed to compare the mean similarities of the groups, case and control. The false
discovery rate was set at 10% using the Benjamini and Hochberg procedure[95] to avoid type 1 error due to multiple comparisons on a single data set.
1.3.6 Data Preprocessing 1.3.6.1 Normalization
Raw counts were normalized then log transformed using the normalization scheme mentioned below, before proceeding with the rest of the analyses.
LOG10 ((Raw count / # of sequences in that sample)*Average # of sequences per sample +1).
1.3.6.2 Removal of rare taxa
In order to minimize the number of null hypotheses for which we would need to correct for multiple hypothesis testing, we removed rarely occurring taxa that occurred in so few patients that they could not be significantly associated with case-control or obesity phenotypes. In all of our analyses (except richness calculations), we therefore only included taxa which occurred at least once in 25% of all samples. For the RDP approach, 9 phyla and 100 genera met this criterion. For the OTU approach, 371 OTUs met this criterion.
1.3.7 Tree Generation
For each of the 371 consensus sequences from OTUs that met the above criteria, BLASTN (http://blast.ncbi.nlm.nih.gov/Blast.cgi) was used to find the top 10 hits in the Silva reference tree release 104 (http://www.arb-silva.de/download/arb-files/). In this way, we identified a set of 3,594 aligned sequences to serve as our reference tree. The program align.seqs within MOTHUR (http://www.mothur.org/) was used to align the 371 AbundantOTU consensus sequences that passed all QC steps, to these 3,594 aligned
sequences as extracted from the Silva reference alignment. With custom Java code based on the Archaeopteryx code base (http://www.phylosoft.org/archaeopteryx/), we removed all but the 3,594 sequences from the Silva reference tree. We then uploaded the alignment of the 3,594 reference sequences plus the 371 AbundantOTU sequences to the RaxXML EPA server (http://i12k-exelixis3.informatik.tu-muenchen.de/raxml), which uses maximum likelihood to place new sequences within a reference tree. Custom Java code (available upon request) was used to add RDP calls from each consensus sequence (Appendix A, Supplementary Figure 5) and coloring by false discovery rate (Figure 1.2, Appendix A, Supplementary Figure 5) to the tree. Trees were visualized with Archaeopteryx. Leaf nodes in Supplementary Figure 5 (Appendix A, Supplementary figures) are labeled with the RDP call of the consensus sequence at 80% confidence. 1.3.8 UniFrac Analysis
The tree generated from the 371 OTU consensus sequences (using RaxXML EPA server described above) along with the environment file with the abundance information of each of the 371 OTUs within the case and control environments were submitted to UniFrac [96] and Fast UniFrac to see if cases cluster separately from controls. We ran 100 permutations on the abundance weighted tree using the UniFrac significance test. 1.3.9 Data Validation
1.3.9.1 Real-time quantitative PCR validation
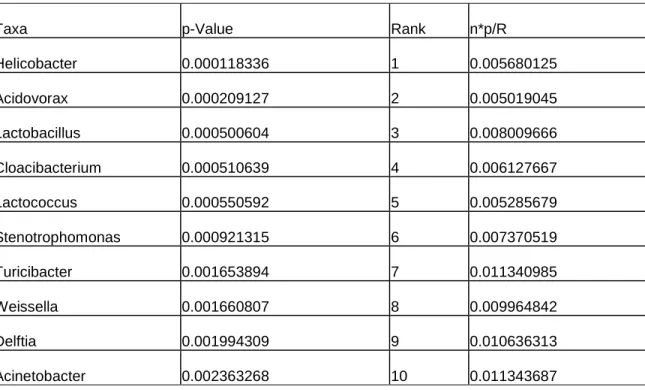
q-PCR primers were designed based on no less than 95% sequence similarity from bacterial 16S ribosomal DNA sequence alignments obtained from pyrosequencing. To measure the abundance of a specific taxon, three primer pairs where designed: one generic for all bacterial groups (Universal Primer): [EUB341-F
5’-CCTACGGGAGGCAGCAG-3’ EUB518-R 5’-ATTACCGCGGCTGCTGG-3’] and three taxon-specific primer pairs: first for the Helicobacter genus (Heli_F 5’ AGTGGCGCACGGGTGAGTA 3’
Heli_R 5’ GTGTCCGTTCACCCTCTCA 3’), the next one for the Acidovorax genus (Aci_F 5’-TGCTGACGAGTGGCGAAC-3’ Aci_R 5’-GTGGCTGGTCGTCCTCTC-3’) and another for the Cloacibacterium genus (Clo_F 5’-TGCGGAACACGTGTGCAA-3’ Clo_R 5’-CCGTTACCTCACCAACTAGC-3’).
10 µ L PCR reactions were prepared containing 100ng of DNA extracted from colonic mucosal biopsies, 10 µM of each primer, and 5 µ L of Fast-SYBR Green Master Mix (Applied Biosystems). Cycling conditions were: 1 cycle at 95°C for 10 minutes followed by 45 cycles of 95°C for 15 seconds, 60°C for 1 minute, and 72°C for 30 seconds. A single dissociation curve cycle was run as follows: 95°C for 30 seconds, 60°C for 30 minute, and 90°C for 30 seconds. A pool of samples was prepared to serve as the standard for the qPCR by mixing equal volumes from each sample. Abundance of a specific taxon was calculated by the delta-delta threshold cycle (∆∆Ct) method[97] in which: ∆∆Ct = (CtTSE – CtUE) – (CtTSP – CtUP) .Where: CtTSE: Ct of experimental samples for taxon-specific primers, CtUE: Ct of experimental samples for universal primer, CtTSP: Ct for DNA Pool for taxon-specific primers, CtUP: Ct for DNA pool for universal primers. Theoretically, the abundance of a taxon is 2−ddCt.
1.3.10 Nucleotide sequence accession numbers
All 454 pyrosequences from this study are available in the Genbank database under the accession # SRS 166138.1-172960.2.
The diversity indices, richness and evenness, were calculated using JAVA
implementations (available upon request). Kruskal-Wallis, Wilcoxon and Student’s t-tests were performed using JMP 8.0 (SAS Institute, Cary NC) to compare the mean similarities of the groups, case and control. Regression and correlation analyses were performed using JMP 8.0 (SAS Institute, Cary NC) and in R (Open Sourced Statistical software).
1.4 Results
To evaluate associations between the gut microbiota and the presence of adenomas, we collected mucosal biopsies from the same region (~10-12 cm regions from the anal verge) from 33 adenoma subjects and 38 controls. Our initial analyses looked at global signatures of the entire microbial community. At the phylum, genus and OTU levels we found significant differences in richness (i.e. the number of taxa present in a sample), but no differences in evenness (i.e. how evenly distributed taxa are within a sample), between cases and controls (Figure 1.1; Appendix A, Supplementary Figures 1 & 2). In order to see whether case samples cluster separately from control samples, we used UniFrac[96] to cluster our sequences based on their placement in the phylogenetic tree shown in Figure 1.2. Running 100 permutations on the abundance weighted tree using the UniFrac significance test resulted in a p-Value of 0.02 suggesting a marginally significant
separation between cases and controls when considering all of the nodes of the phylogenetic tree. Similarly, weak clustering was seen when we used principle co-ordinate analysis (PCoA) on the same tree using FastUnifrac (Appendix A,
We next asked which individual bacterial taxa were different between cases and controls. By examining the results of the RDP classification algorithm [46] at the phylum level, we observed at a 10% false discovery rate threshold that cases had higher relative abundance of TM7, Cyanobacteria and Verrucomicrobia compared to controls (Appendix A, Supplementary Table 1). At the genus level at a 10% false discovery rate threshold, the relative abundance levels of 30 genera including Acidovorax,
Aquabacterium, Cloacibacterium, Helicobacter, Lactococcus, Lactobacillus and
Pseudomonas were higher in cases vs. controls (Appendix A, Supplementary Table 2). Remarkably, only one genus, Streptococcus, had a higher relative abundance in the control group. In order to validate these pyrosequencing results, we developed qPCR assays for a subset of observed genera that were significantly different in their relative abundances between cases and controls (i.e., Helicobacter spp, Acidovorax spp and Cloacibacteria spp.). We observed the expected correlations between the two methods (Appendix A, Supplementary Figure 4), validating the results of our pyrosequencing approach.
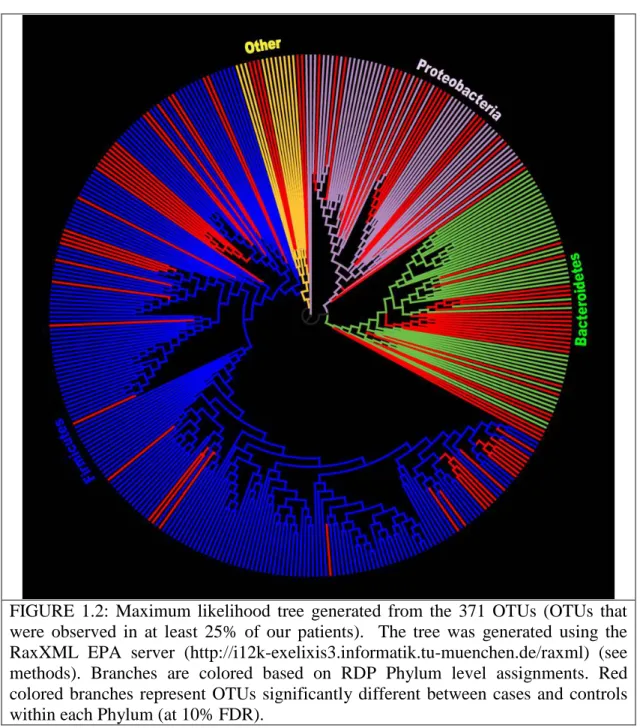
We also performed an analysis of Operational Taxonomic Units (OTUs), which are clusters of sequences in which the average percent identity of all of the sequences within a cluster is >=97%. Our analysis at the OTU level at a 10% false discovery rate threshold found 87 OTUs with significantly higher relative abundance in cases vs. controls and only 5 OTUs higher in controls (Appendix A, Supplementary Table 3). When we used the RDP classification algorithm to classify the consensus sequence for each of the 92 significantly different OTUs, bacteria with higher relative abundance in cases were mostly members of the phyla Firmicutes (42.6%), Bacteroidetes (25.5%) and
Proteobacteria (24.5%) (Figure 1.2, Appendix A, Supplementary Figure 5). A rank-abundance curve demonstrates that the OTU differences between cases and controls (significant at 10% FDR) are entirely in low abundance taxa (Appendix A,
Supplementary Figure 6). This observation explains why there are differences between case and control in richness (Figure 1.1), which depends on the total number of taxa observed, but not evenness, which is more sensitive to changes in high-abundance taxa.
Since obesity is a risk-factor for development of colorectal cancer, and changes in the human microbiome have been associated with obesity [52], [98] we evaluated the
relationship between the relative abundance levels of the individual taxa and the risk factors, BMI and Waist-to-Hip Ratio (WHR). We classified subjects into one of three BMI categories; Normal (BMI<25), Overweight (BMI = 25-29) and Obese (BMI 30 and above) and three WHR levels; low, medium and high based on accepted thresholds
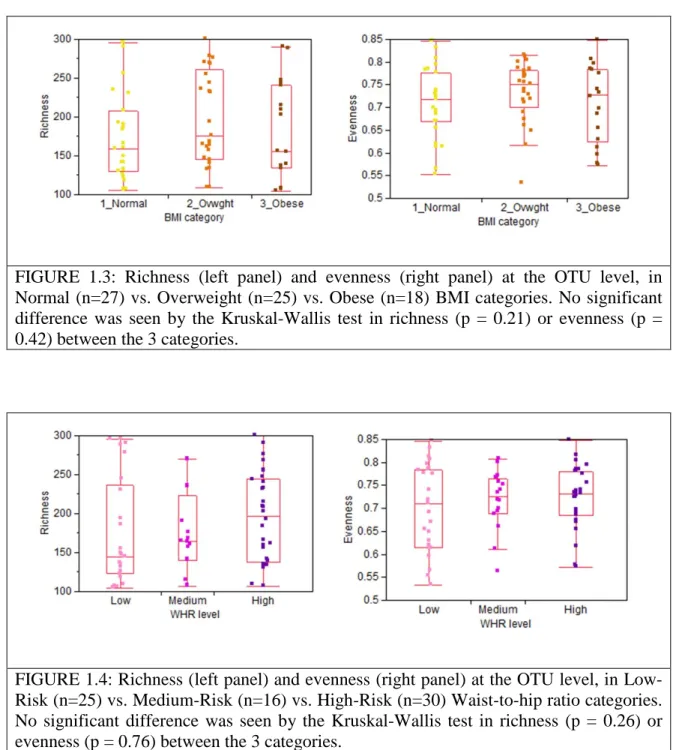
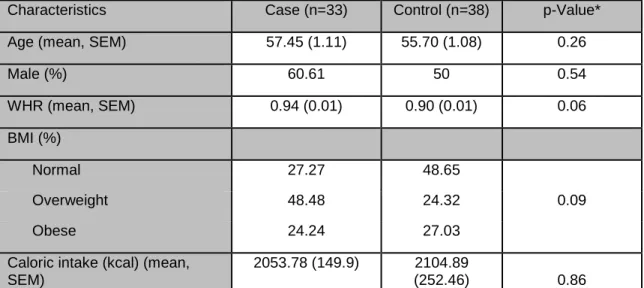
(http://www.bmi-calculator.net/waist-to-hip-ratio-calculator/waist-to-hip-ratio-chart.php). For each OTU, the non-parametric Kruskal-Wallis test was performed between the three groups for BMI and WHR. There were no OTUs that showed significant differences between the various BMI and WHR risk factor categories even if we were to set a false discovery rate threshold as high as <200% (Appendix A, Appendix A, Supplementary Tables 4 & 5). Likewise, there were no significant differences in the diversity measures, richness and evenness, between the various risk factor categories (Figures 1.3 & 1.4). Finally, regressions between BMI values and WHR values against each taxa at the OTU level also showed no significant association between the OTUs with either BMI or WHR at an FDR threshold of <10% (Appendix A, Supplementary Figures 7 & 8, Appendix A, Supplementary Tables 6 & 7).
1.5 Discussion
Taken together, these findings demonstrate that the development of adenomas is associated with changes in the relative abundance of various taxa, including pathogens, present in the gut mucosa and that these changes are distinct from those associated with obesity. Analogous to the mechanism suggested for inflammatory bowel diseases[99], a potential explanation for this observation could be that the presence of adenomas
compromises gut mucosal immunity, leading to an increased relative abundance in known pathogens such as Pseudomonas, Helicobacter, Acinetobacter (Appendix A: Appendix A, Supplementary Table 2, Supplementary Table 3) and other genera
belonging to the phylum Proteobacteria (Figure 1.2). Alternatively, the presence of these pathogens may directly increase the risk of adenoma development by changing the gut environment. For example, Helicobacter has a much higher relative abundance in cases vs. controls (Appendix A, Supplementary Tables 2& 3) consistent with previous studies, which implicate the role of this bacterium in colorectal adenomas[100],[101],[102]; a possible explanation for this association is that this microbe alters the pH of the gastrointestinal tract[103],[104]. Acidovorax spp, another member of the bacterial signature identified as significantly different between case and control in this study, is a flagellated, Gram-negative acid-degrading member of the phylum Proteobacteria. Although, not much is known about its clinical epidemiology and pathogenicity in humans, it has been associated with induction of local inflammation [105], [106]. Lactobacillus, another taxa that we found to be higher in case than control, is an acid producing bacteria known to lower gut pH and regulate the growth of other bacteria. While Lactobacillus is generally considered a beneficial microbe, [107], [108] its
presence in this case may help to lower pH to create favorable conditions for bacterial dysbiosis. This is consistent with suggestions by Duncan and co-workers [109] that bacteria that grow in acidic pH create an environment that can be exploited by more low pH-tolerant microbes.
While further experiments will be required to determine if and how increased microbial richness causes the development of adenomas, our observation that the
microbial signature associated with adenomas is largely distinct from that associated with obesity suggests that next-generation sequencing of microbial communities may have considerable value as a diagnostic that can separate risk-factors from the actual presence of adenomas.
FIGURE 1.1: Richness (left panel) and evenness (right panel) for the OTUs observed in our study for cases (n=33) vs. controls (n=38). The x-axis is proportional to the number of subjects in each category. By the Wilcoxon test, cases had a significantly higher richness (p= 0.0061) than controls, but there was no significant difference in evenness (p = 0.36).
FIGURE 1.2: Maximum likelihood tree generated from the 371 OTUs (OTUs that were observed in at least 25% of our patients). The tree was generated using the RaxXML EPA server (http://i12k-exelixis3.informatik.tu-muenchen.de/raxml) (see methods). Branches are colored based on RDP Phylum level assignments. Red colored branches represent OTUs significantly different between cases and controls within each Phylum (at 10% FDR).
FIGURE 1.3: Richness (left panel) and evenness (right panel) at the OTU level, in Normal (n=27) vs. Overweight (n=25) vs. Obese (n=18) BMI categories. No significant difference was seen by the Kruskal-Wallis test in richness (p = 0.21) or evenness (p = 0.42) between the 3 categories.
FIGURE 1.4: Richness (left panel) and evenness (right panel) at the OTU level, in Low-Risk (n=25) vs. Medium-Low-Risk (n=16) vs. High-Low-Risk (n=30) Waist-to-hip ratio categories. No significant difference was seen by the Kruskal-Wallis test in richness (p = 0.26) or evenness (p = 0.76) between the 3 categories.
TABLE 1.1: Descriptive characteristics of the study participants, cases (33) and controls (38). p-Values are based on t-tests between case and control (age, WHR and caloric intake) or the Chi square test (% Male and %BMI). The *p-Value for BMI is from the chi-quare test comparing across the groups. Caloric intake is reported as kilocalories (kcal) and is based on responses from a food frequency questionnaire [110] that was administered to subjects during phone interviews.
Characteristics Case (n=33) Control (n=38) p-Value*
Age (mean, SEM) 57.45 (1.11) 55.70 (1.08) 0.26
Male (%) 60.61 50 0.54 WHR (mean, SEM) 0.94 (0.01) 0.90 (0.01) 0.06 BMI (%) Normal 27.27 48.65 Overweight 48.48 24.32 0.09 Obese 24.24 27.03
Caloric intake (kcal) (mean, SEM)
2053.78 (149.9) 2104.89
(252.46) 0.86
TABLE 1.2: 454 dataset characteristics before and after QC for RDP and OTU pipelines
RDP Pipeline Original After QC
Total # of Sequences 600354 598645
Average/Sample 8455.69 8431.62
SD 3840.73 3843.29
Average Sequence Length 343.131 343.575
OTU Pipeline Original After QC
Total # of Sequences 600354 532506
Average/Sample 8455.69 7500.08
SD 3840.73 3578.55
ANALYSIS REVEALS A TRUE BIOLOGICAL SIGNAL
2.1 Abstract
Difference between populations, different body sites and disease states has been the focus of many metagenomic studies, including the Human Microbiome project. As with other comparative studies, caution needs to be exerted in these studies to separate real biological differences from technical artifacts. Using an example of a major batch- effect that we discovered during the analysis phase of our colorectal cancer project (chapter 1), we illustrate how filtering out batch-effects helped us to reveal a very important
biological result in our data. 2.2 Background and significance
The quality and validity of results obtained from any biological research, including research involving high-throughput technologies like microarrays, mass spectrometry and sequencing requires quality control measures to be used during the design, experimental and analysis phases of the research process. During the course of a metagenomic study such as the one described in chapter 1, a series of experimental methods, protocols, hardware, software and analyses are used. Keeping all these conditions constant is essentially impossible. Batch-effects occur when the outcome of experiments is affected by the group in which the samples are processed. Batches can be either reagent batches,
subgroup of samples were processed in one lab versus the other or by one technician versus the other. Batch-effects are important technical artifacts commonly encountered in many metagenomic and genomic studies; they must be accounted for in order to reap the benefits from these studies. Low throughput techniques such as Western blotting and PCR are also prone to batch-effects but batch-effects are much more easily detected in high-throughput methods like microarrays, sequencing (454, Illumina etc.) and
proteomics [91]. Also due to the fact that high-throughput experiments are generally performed in larger scale they are processed in different locations, on different dates, and possibly by various technicians in order to distribute workload. All of these factors make high-throughput studies, like metagenomic studies extremely vulnerable to batch-effects.
Studies that demonstrated the correlation between biological variables and technical variables have been reported in literature[111],[112] and these studies acknowledge the fact that batch-effects are critical in high throughput analyses and have to be dealt with in order to reach biologically accurate conclusions. In this chapter we illustrate, through our own dataset, how batch-effects masked true biological effects and how by filtering them out we were able to salvage the study.
2.3 Materials and Methods 2.3.1 Methods
Study Participants, colonoscopy and Biopsy procedures and DNA Extraction were as described in the previous chapter.
The first step in the data analysis process involved a preliminary QC filter (downstream of the filters from the Roche-454 GS-FLX software). We removed
sequences from our dataset if (1) there were any Ns in the sequence or the 5’ primer did not exactly match the expected 5’ primer or if the average quality score was less than 20. We then removed the 5’ primer sequence from our reads that have survived above
filtering. Only trimmed filtered sequences with a length between 200-500bp were kept in our data set and submitted to the RDP classifier algorithm 2.0[46] for taxonomic
identification at various taxonomic levels. Sequences assigned in each sample to various taxa, from phylum level up to genus level, were counted at the RDP confidence threshold of 80%. Raw counts were normalized, and then log transformed using the normalization scheme mentioned below, before proceeding further.
LOG10 ((Raw count / # of sequences in that sample) +0.001)
Only taxa with >= 10seqs in at least 25% of the samples were selected for downstream statistical analyses.
2.3.3 Statistical analyses
The Shannon-Wiener Diversity Index, H, was calculated using the following
equation: H = -∑ Pi (lnPi) where Pi is the proportion of each species (taxa) in the sample. Student’s t-tests were performed to compare the mean similarities of the groups, case and control. Student’s t-tests, Wilcoxons, PCA and hierarchical clustering were performed using JMP 8.0 (SAS Institute, Cary NC).
2.4 Results and Discussion
We analyzed the adherent microbiota from mucosal biopsies from 167 individuals, including 80 adenoma cases and 87 non-adenoma controls based on the16S rDNA genes and 454 titanium pyrosequencing methods. Case subjects were slightly older (case-57.2 years) compared to controls (55.5 years). Cases were more likely to have higher Waist-to-Hip-Ratio than controls (p=0.0001) and be overweight or obese (p=0.018). There were no significant differences between cases and controls for smoking, fiber intake, caloric intake, and fat (Table 2.1). After applying a quality filter (see methods), a total of 1,411,767 sequences were present and of these, 1,407,099 were classified as domain Bacteria at a confidence threshold of 80% by the RDP classification algorithm[46]. The average number of sequences/subject was ~8400 (8403.37±3133.38) and the average sequence length was ~350bp (341.37±86.9).
2.4.2 All samples clustered into two distinct groups
We started our analysis of this dataset with an unsupervised approach by asking whether all samples from the study form natural groups with respect to their microbiome composition, independent of metadata associated with each sample. Principal component analysis of the log normalized abundance of all taxa at the genus level revealed 2 distinct clusters (Figure 2.1). The samples in cluster 1 showed a very different microbial profile compared to the samples in cluster 2 (Tables 2.2 and 2.3). The cluster 1 had a lot of within-cluster variability with significant differences in microbial abundance between cases and controls (Table 2.2), whereas cluster 2 was compact with very little variability between all the samples within the cluster. Most of the case subjects belonged to this cluster and there were no significant differences between the case and control subjects within this cluster (Table 2.3). Due to the fact that from the PCA all samples in cluster 2
were incredibly similar to one another, with respect to their microbiome composition, and that previous studies [113],[59],[52] had suggested that each individual had a unique microbiome fingerprint, we suspected that there could be some technical artifact that was causing the incongruent pattern in the samples belonging to cluster 2.
2.4.3 The distinct clustering was due to a batch-effect
To check if our notion was indeed true, we looked for a correlation between these naturally occurring groups and the metadata associated with the samples to see if any of the metadata categories were responsible for this separation. Just as we had expected, our results indicated that there is an almost perfect correlation of clusters 1 and 2 with the technical variable groups (batches) namely the “Date sent for Sequencing” and “Location of Stock DNA” (Figure 2.3). Once we had confirmed that this behavior was due to a batch- effect, the next step wa