ARTICLES
The Measurement of Curiosity
As a Feeling of Deprivation
CURIOSITY AS A FEELING OF DEPRIVATIONLITMAN AND JIMERSONJordan A. Litman
Center for Research in Behavioral Medicine and Health Psychology Department of Psychology
University of South Florida
Tiffany L. Jimerson
Department of Psychology University of South FloridaCuriosity as a feeling of deprivation (CFD) reflects feelings of uncertainty and tension that mo-tivate information-seeking and problem-solving behavior. Twenty-seven CFD items were ad-ministered to 321 participants (248 women, 73 men) along with other measures of curiosity and other personality traits such as anxiety, anger, and depression. Factor analyses of the CFD items identified 3 factors from which 5-item subscales were developed: (a) a need to feel competent, (b) intolerance experienced when information is inaccessible or inadequate, and (c) a sense of urgency to solve problems. Moderately high correlations of the CFD scales with other mea-sures of curiosity provided evidence of convergent validity, whereas divergent validity was demonstrated by minimal correlations of the CFD scales with the other personality traits.
Curiosity may be defined as a desire for new information aroused by novel, complex, or ambiguous stimuli. Drive the-orists associated the arousal of curiosity with unpleasant feelings of uncertainty and hypothesized that to reduce these feelings, organisms were motivated to acquire new informa-tion through exploratory behavior. Supportive of this hypoth-esis, a number of studies have demonstrated that when novel, complex, or ambiguous (curiosity-evoking) stimuli were pre-sented to animals, they engaged in exploration without addi-tional incentives (Berlyne, 1950, 1954; Dember, 1956; Harlow, 1950; Welker, 1956). However, one serious limita-tion to the drive account of curiosity was that it could not ex-plain why humans and other animals often searched for curi-osity-evoking stimuli when none were present. If the arousal of curiosity, like other drives, was an unpleasant experience, it was not clear why organisms would look for opportunities to have their curiosity aroused (Berlyne, 1966; Fowler, 1966; Hebb, 1955).
Optimal-level theorists proposed an alternate account of curiosity and exploratory behavior arguing that organisms were motivated to maintain an optimal level of arousal, which was pleasurable, whereas being underaroused or overaroused
was unpleasant (Berlyne, 1967; Hebb, 1955; Leuba, 1955). According to the optimal-level model, when organisms were underaroused (i.e., bored), they were motivated to increase their arousal to an optimal level by seeking out and investigat-ing curiosity-evokinvestigat-ing stimuli. Thus, contrary to the drive ac-count, optimal-level theorists assumed that exploratory behavior was aimed at increasing arousal and that the arousal of curiosity was a positive emotional experience.
THE MEASUREMENT OF CURIOSITY AS A “FEELING OF INTEREST”
Whereas drive and optimal-level theorists have attempted to explain the underlying causes of curiosity and exploratory behavior, personality theorists have endeavored to assess in-dividual differences in tendencies to experience and express curiosity as a personality trait. Influenced primarily by the optimal-level theory of curiosity, several scales have been de-veloped based on the view that curiosity involves heightened states of arousal and very positive emotions. Day’s (1971) 110-item Ontario Test of Intrinsic Motivation consists almost entirely of items that describe experiencing feelings of
ment when seeking out novelty or closely examining a spe-cific stimulus (e.g., “I like to go somewhere different nearly every day”; “I like to look at pictures which are puzzling in some way”).
The 10-item Trait Curiosity scale (T–Cur; Spielberger, Peters, & Frain, 1976) assesses how frequently individuals experience positive emotional reactions such as feeling “in-terested” and “stimulated.” Similarly, Naylor’s (1981) 20-item Curiosity Trait scale associates curiosity with feel-ings of interest and heightened arousal (e.g., “I think learning about things is interesting and exciting”). Peterson and Seligman’s (2001) Values in Action Inventory of Strengths includes a 10-item Curiosity scale that, like its predecessors, also assesses curiosity as reflecting feelings of interest and enjoyment (e.g., “I can find something of interest in any situ-ation”; “I really enjoy learning about other countries and cul-tures”). Two 10-item scales that were very recently developed assess positive reactions to different types of stim-uli: The Perceptual Curiosity scale (PC; Collins, Litman, & Spielberger, in press) evaluates feelings about sensory stim-uli (e.g., “I enjoy visiting art galleries and art museums”); the Epistemic Curiosity scale (EC; Litman & Spielberger, 2003) assesses feelings about stimuli that activate cognitive pro-cesses (e.g., “I enjoy discussing abstract concepts”). Thus, theory and research on individual differences in curiosity have emphasized the measurement of curiosity as a feeling of interest (CFI) that involves very pleasurable emotional expe-riences.
THE CONCEPT OF CURIOSITY AS A “FEELING OF DEPRIVATION”
Early accounts of exploratory behavior considered curiosity to reflect relatively unpleasant feelings, whereas contempo-rary theorists have defined curiosity as a highly pleasurable emotion. However, these contrary perspectives on the nature of curiosity are not incompatible. Keller, Schneider, and Henderson (1994) observed that most motivational systems involve both unpleasant and pleasant emotional experiences. For example, hunger may be stimulated by uncomfortable pangs from a nutritional deficit but also by the pleasing sight or smell of food (Mayer, 1952; Rolls, Rowe, & Rolls, 1980). Consistent with Keller et al. (1994), Loewenstein (1994) sug-gested that curiosity can reflect the pleasurable anticipation of acquiring knowledge (e.g., an opportunity to hear gossip) but can also involve feeling deprived by not having access to new information (e.g., wanting the answer to a question).1
Whereas the former case clearly reflects CFI, in the latter
case, curiosity may be more meaningfully conceptualized as a feeling of deprivation.
Loewenstein (1994) suggested that whether CFI or curios-ity as a feeling of deprivation (CFD) was aroused may be in-fluenced by individual differences in reactions to curiosity-evoking stimuli. If individuals only recognize the potential for enjoyment in learning something new, then CFI will be stimulated. By contrast, if individuals perceive them-selves as suffering a deficiency without new information, CFD reactions will become aroused (Loewenstein, 1994; Loewenstein, Adler, Behrens, & Gillis, 1992).2According to
Loewenstein, CFD reactions reflect a more powerful motive for learning than CFI, and he posited that “information seek-ing is motivated by the aversiveness of not possessseek-ing the in-formation more than it is by the anticipation of pleasure from obtaining it” (p. 92). Loewenstein described CFD as an im-pulse to obtain new information, which is accompanied by feelings of uncertainty and tension. Acquiring factual knowl-edge or solving problems (depending on the situation) is hy-pothesized to reduce these feelings. Thus, one important difference between CFI and CFD is that CFI is assumed to positively reinforce exploratory behavior and brings pleasure by increasing stimulation, whereas CFD is hypothesized to negatively reinforce exploration and involves pleasure de-rived by reducing tension. Loewenstein suggested that an-other important difference between CFI and CFD is that individuals who experience CFD reactions often remain dis-satisfied after they obtain new information that seems inade-quate, whereas the arousal of CFI, which involves positive stimulation, may be enjoyable regardless of whether any in-formation is acquired. Loewenstein also suggested that the uncertainty reduction associated with CFD reactions might play a more important role in achieving feelings of compe-tence than the emotional experiences associated with CFI re-actions.
In summary, curiosity has been recognized as involving two very different types of reactions to novelty, both of which serve to motivate exploration: (a) pleasurable feelings of interest (CFI) and (b) relatively aversive feelings of uncer-tainty (CFD). Although there are a number of scales cur-rently available that assess the experience and expression of CFI, no scales have been developed to measure CFD. Logically, it would be desirable to researchers interested in studying individual differences in curiosity to have scales that measure both aspects of this complex construct to evalu-ate how subjective feelings of interest and deprivation each contribute to the stimulation of exploratory behavior. Before differential experiences of CFD can be empirically studied, it is necessary to first develop a reliable and valid instrument
1
In a similar vein, Spielberger and Starr (1994) theorized that ex-ploratory behavior can be motivated purely by pleasurable feelings of interest but also by an admix of interest and unpleasant feelings of tension.
2
A highly similar view on individual differences in reactions to novel, complex, and ambiguous stimuli was proposed much ear-lier—but never developed—by Berlyne (1971).
for measuring this important, although neglected, aspect of curiosity as a personality trait.
Thus, we had four major goals in this study. The first goal was to identify an internally consistent set of CFD items, which would provide evidence that a reliable CFD scale could be developed. A second goal was to examine whether CFD was a unidimensional or multidimensional construct. A third major goal was to select the best items for assessing CFD to form a scale and to evaluate the convergent and di-vergent validity of this scale by examining its relationships with other measures of curiosity and other personality traits, respectively. A fourth goal was to examine the structural re-lationship between the newly developed CFD scale and mea-sures of CFI.
METHOD Participants
The study participants consisted of 321 undergraduate stu-dents (248 women, 73 men) recruited from psychology courses at a large urban university who ranged in age from 18 to 40 years (M= 20.97,SD= 5.10). The sample consisted of approximately equal numbers of students who entered the university as freshmen or in their junior year as community college transfers. All participants received extra credit to-ward their final grade in one psychology course for taking part in this study.
Instruments
Each participant responded to a Curiosity Questionnaire that consisted of 27 items developed to assess individual differ-ences in CFD along with the Trait, Epistemic, and Perceptual Curiosity scales and also the Trait Anxiety, Trait Anger, and Trait Depression scales of the State–Trait Personality Inven-tory (STPI; Spielberger, 1979). The order in which the scales were administered was determined by the importance of each measure to the goals of the study and by similarities in the in-structions and rating procedures. Each questionnaire used in this study is briefly described following.
Curiosity Questionnaire. The 57-item Curiosity Questionnaire consisted of the 10-item T–Cur scale (Spielberger et al., 1976), the 10-item PC scale (Collins et al., in press), the 10-item EC scale (Litman & Spielberger, 2003), and 27 items designed to assess individual differences in CFD. In responding to each Curiosity Questionnaire item, the participants were instructed to report how they “generally feel” by rating themselves on the following 4-point fre-quency scale, which has been used extensively to evaluate in-dividual differences in other personality traits: 1 = almost never, 2 = sometimes, 3 = often, and 4 = almost always (Spielberger, 1983, 1988).
The content of the T–Cur items inquired about how fre-quently individuals feel generally “interested” or “stimu-lated.” The PC items asked about one’s interest in investigating novel perceptual stimuli (e.g., “I like to listen to new and unusual kinds of music”), whereas the EC items in-quired about interest in exploring new ideas and figuring out how things work (e.g., “When I see a complicated piece of machinery, I like to ask someone how it works”). In previous research, the alpha coefficients for the brief T–Cur, PC, and EC scales were quite satisfactory, ranging between .82 and .87 (Collins et al., 2003; Litman, 2000; Litman & Spielberger, 2003). The T–Cur, PC, and EC scales were in-cluded in this study to measure CFI and to evaluate the con-vergent validity of CFD.
The pool of 27 CFD items was designed to assess individ-ual differences in experiences of tension associated with not having information (e.g., “It really gets on my nerves when I’m close to solving a puzzle, but still can’t figure it out”), a need to reduce ignorance and feel competent (e.g., I’m not happy unless I learn everything I need to fully understand a new concept”), and feeling dissatisfied with knowledge that seemed either unattainable or insufficient to satisfy one’s cu-riosity (e.g., “I find that simple answers to complex problems are rather unsatisfying”). Of the 27 CFD items, 16 were con-structed for this study based on the theoretical definition of CFD (Loewenstein, 1994); 11 were adapted from existing CFI scales or measures of constructs that are conceptually similar to CFI, including the Need for Understanding scale (Murray, 1938), the Ontario Test of Intrinsic Motivation (Day, 1971), the Need for Cognition scale (Cacciopo & Petty, 1982), and the Tolerance for Ambiguity scale (Mac-Donald, 1970). Adaptations included the alteration of item content to reflect the concept of CFD and use of the 4-point frequency rating scale that was previously described.
STPI Trait scales. The 10-item STPI Trait Anxiety, Anger, and Depression scales assess individual differences in how frequently each corresponding emotion is experienced (Spielberger, 1979). Participants responded to the STPI trait items by rating themselves on the same 4-point frequency scale that was used with the Curiosity Questionnaire. The three STPI trait scales exhibited very good reliability in pre-vious research, with alpha coefficients ranging from .80 to .96 (Spielberger, 1979). The trait measures of anxiety, anger, and depression were included to evaluate the divergent valid-ity of CFD.
Procedure
At the beginning of the testing session, the participants were informed that the goals of the study were to learn about the feelings and attitudes of college students, and that additional information about the study would be provided to them after they finished taking part. Approximately 30 to 40 min were required to respond to the questionnaires.
RESULTS
In keeping with the goal of developing an internally consistent measure of individual differences in CFD, the item-total and interitem correlations of the 27 CFD items, which are reported in Table 1, were carefully reviewed. CFD items that had item-total correlations of at least .30 and an average interitem correlation of .20 or higher were considered for retention, whereas the remaining items were deleted (Comrey, 1988; Jarvis & Petty, 1996). Twenty CFD items (listed in the top part of Table 1) met these two criteria for retention, and their con-tent was evaluated for redundant or ambiguous wording.
Item 23 (“Not happy unless I learn everything I need to fully understand a concept”) and Item 28 (“Uncomfortable when I don’t understand concept/try hard to make sense”) were considered to have content that was similar in meaning. As Item 28 had better psychometric properties, Item 23 was dropped. Two additional items, Item 25 (“Frustrated if can’t figure out solution/work even harder to solve”) and Item 39 (“Disturbs me when don’t completely understand solu-tion/have to figure it out”) also appeared to be quite similar. Item 39 had slightly weaker psychometric properties than Item 25 and implied that the solution was known but not well understood, which is ambiguous; thus, Item 39 was deleted. This item selection process yielded a set of 18 highly inter-nally consistent items (Cronbach’sα= .86) for measuring in-dividual difference in CFD.
To evaluate whether CFD was a multidimensional con-struct, responses to the 18 CFD items were analyzed in a principal axis factor analysis with oblique (promax) rotation. In determining the appropriate number of factors to extract for rotation, three criteria were considered: (a) parallel and discontinuity analyses of the eigenvalues (Hays, 1987), (b) the amount of common variance explained by each factor (Rummel, 1970), and (c) the interpretability and psychologi-cal meaningfulness of the rotated factors (Cattell, 1958). Par-allel and discontinuity analyses of the eigenvalues (5.22, .714, .523, .373, .287, and .209) both indicated that an upper limit of five factors could be extracted. The first factor ac-counted for over 80% of the common variance, the second factor explained over 10%, less than 9% was attributed to the third factor, and subsequent factors accounted for relatively trivial amounts of variability. Thus, one very strong CFD factor was found along with possible second and third factors that were much weaker. To examine whether two or three psychologically meaningful CFD factors could be identified, two- and three-factor solutions with oblique rotation were computed. Factor loadings of the 18 CFD items in the three-factor solution are reported in Table 2.
Of the 18 CFD items, 8 had dominant salient loadings of .30 or greater on the first factor, 5 items had dominant loadings of .41 or greater on the second factor, and 5 items had dominant loadings of .44 or higher on the third factor. Only one of these items (Item 28) had a salient dual loading. Parallel and
discon-TABLE 1
Item Statements, Item Total, and Mean Interitem Correlations for the 27 CFD Items
Item No. Item Statement Item Total r M Interitem r
28 Uncomfortable when I don’t understand concept/try hard to make sense .65 .33 41 Brood for long time to solve problem .60 .31 19 Problem/can’t rest without knowing answer .59 .31 20 Don’t like not knowing/try to learn about complex topics .59 .31 46 Work like fiend at problems/must be solved .58 .31 25 Frustrated if can’t figure out solution/work even harder to solve .57 .30 34 Aggravates me if can’t remember fact/think about it until comes to me .56 .29 39 Disturbs me when don’t understand solution/have to figure it out .52 .28 7 Uncertain of answer/work hard to find out .50 .27 49 Work for tangible and clear results .50 .27 18 Gets on nerves when close to solving but can’t figure it out .49 .26 23 Not happy unless I learn everything I need to fully understand a concept .48 .26 9 Important to feel knowledgeable .47 .26 12 Troubles me/doesn’t seem to be reasonable solution to problem .47 .25 33 Read something that puzzles/keep reading until I understand .45 .25 42 Critical of ideas and theories .42 .23 30 Hard time accepting mysteries can’t be solved .41 .22 2 Conceptual problems keep me awake thinking about solutions .36 .21 11 Spend time formulating ideas clearly to be understood .34 .20 37 Bothers me if I don’t know a word/ will look up meaning .33 .20 27 Simple answers to complex problems are unsatisfying. .32 .19 13 Word is on the tip of my tongue/bothers me until I think of it .29 .17
54 Search for truth is important .28 .21
31 Prefer to avoid discussing complex topics (R) .23 .15 3 Read something that doesn’t make sense/ignore it and keep reading (R) .20 .13 5 Drives me crazy when a television program ends with a cliffhanger .17 .12 16 Meet someone that I like/don’t like wondering how she/he feels about me .05 .06
Note. N= 32. Items are listed in the descending order of the magnitude of their item total and mean interitem correlations. CFD = curiosity as a feeling of deprivation; item no. = the ordinal position of an item within the Curiosity Questionnaire; R = item was reverse scored.
tinuity analyses of the eigenvalues (5.22, .714, .523, .373, .287, .209 , …) both indicated that an upper limit of five factors could be extracted.
The content of the items that defined Factor 1 corre-sponded with a need for competence as reflected in a desire to reduce feelings of ignorance and a recognition of the value of feeling knowledgeable (e.g., “read something that puzzles me/keep reading until I understand”; “important to feel knowledgeable”). The items with high loadings on Factor 2 all described intolerance for situations in which information was inaccessible or inadequate (e.g. “troubles me/doesn’t seem to be a reasonable solution to a problem”; “aggravates me if can’t remember fact/think about it until it comes to me”). The items that comprised Factor 3 clearly involved en-gaging in problem-solving behavior that was motivated by feelings of tension or by a strong sense of urgency (e.g., “conceptual problems keep me awake thinking about solu-tions”; “work like fiend at problems/must be solved”). These three dimensions were highly consistent with the concept of CFD formulated by Loewenstein (1994).
In the two-factor solution, the first factor primarily con-sisted of the items that defined Factor 1 and 3 in the three-factor solution but with weaker loadings for most of the items, of which several also had salient dual loadings. The second factor in the two-factor solution was nearly identical to Factor 2 in the three-factor solution. Given these findings, the two-factor solution was considered to be relatively infe-rior in terms of interpretability and psychological meaningfulness and was not considered further.
The next step was to select items from the three CFD fac-tors for measuring each dimension of CFD. The five items with strong loadings on Factor 2 were selected to form the In-tolerance (CFD/I) subscale, and the five items that defined
Factor 3 formed the Problem-Solving (CFD/P) subscale. Be-cause it was considered desirable to have an equal number of items for measuring individual differences in each CFD di-mension, and there were more than five items from which to choose the best measures of competence (Factor 1), these items were carefully evaluated on the basis of the their factor loadings and item content.
Items 33, 20, and 9 had the strongest loadings on Factor 1 and appeared highly related to feeling competent; therefore, these three items were retained. Item 28 had a salient dual loading on Factor 2 and was eliminated. Item 49 had the weakest salient loading on Factor 1 and was also eliminated. Although Item 7 had a very strong loading on Factor 1 be-cause its content (“uncertain of answer/work hard to find out”) was considered to differentiate poorly between the Competence and Problem-solving dimensions, this item was dropped. Item 11 had a moderately strong loading on Factor 1 and content that was considered highly relevant to wanting to feel competent (“spend time formulating ideas clearly to be understood”). Therefore, Item 11 was retained and joined with Items 33, 20, 9, and 37 for the five-item Competence (CFD/C) subscale. The three CFD subscales were combined to form a 15-item CFD Total Scale.3
Although the three CFD factors that emerged in the ex-ploratory factor analysis appeared to be psychologically dis-tinct given that a one-factor model would have accounted for most of the variability in the data set, the meaningfulness of extracting additional factors required further evaluation.
TABLE 2
Factor Loadings of the 18 CFD in Three-Factor Principal Axis Factor Analyses With Oblique Rotation
Item No. Item Statement Factor 1 Factor 2 Factor 3
33 Read something that puzzles/keep reading until I understand .64 –.03 –.08 20 Don’t like not knowing/try to learn about complex topics .52 .06 .16 09 Important to feel knowledgeable .51 .00 .06 07 Uncertain of answer/work hard to find out .50 –.15 .27 37 Others me if I don’t know a word/ will look up meaning .48 .12 –.20 28 Uncomfortable when I don’t understand concept/try hard to make sense .44 .35 –.02 11 Spend time formulating ideas clearly to be understood .40 –.13 .14 49 Work for tangible and clear results .30 .26 .06 30 Hard time accepting mysteries can’t be solved –.22 .69 .03 12 Troubles me/doesn’t seem to be reasonable solution to problem –.04 .56 .06 34 Aggravates me if can’t remember fact/think about it until comes to me .29 .43 –.06 42 Critical of ideas and theories .22 .42 –.11 18 Gets on nerves when close to solving but can’t figure it out .09 .41 .09 02 Conceptual problems keep me awake thinking about solutions –.07 –.14 .69 19 Problem/can’t rest without knowing answer –.17 .25 .67 25 Frustrated if can’t figure out solution/work even harder to solve .11 .01 .59 41 Brood for long time to solve problem .12 .15 .48 46 Work like fiend at problems/must be solved .28 –.01 .44
Note. N= 321. Items are listed in the descending order of magnitude of their dominant loadings on each factor. Underlined factors are rotated loadings≥.30. CFD = curiosity as a feeling of deprivation; item no. = ordinal position of an item within the Curiosity Questionnaire.
3
A principal axis factor analysis of the 15 CFD Scale items yielded the three CFD factors with perfect simple structure after oblique rotation. Median (Mdn) factor loadings were Competence = .48, Problem-Solving = .66, and Intolerance = .44.
Thus, responses to the 15 CFD Scale items were submitted to confirmatory factor analyses using maximum likelihood so-lutions. Although the findings of these analyses were not in-terpreted as a true validation of the three-factor model, which would have required an analysis of data from a novel sample, the confirmatory factor analyses provided an additional means of evaluating whether CFD was more appropriately conceptualized as either a unidimensional or multidimen-sional construct.
Given that the three CFD factors were considered to re-flect substantially overlapping but distinct aspects of an un-derlying CFD construct, the first structural model tested consisted of a higher order CFD factor with paths leading to the three CFD component factors (Competence, Prob-lem-Solving, and Intolerance) that were identified by the ex-ploratory analysis. Paths were estimated from each lower order factor to the five CFD items hypothesized to comprise that factor. This higher order factor model was compared to a second structural model consisting of a single CFD factor with paths to all 15 items. Both structural models were com-pared to a null model, which was based on the assumption that there are no factors present in the data. The chi-squares and other goodness-of-fit (GOF) indexes for each model are reported in Table 3.
The chi-square statistics for the one-factor and higher or-der factor structural models were significant (p< .01), sug-gesting that there was room for improvement in both models. However, chi-square values may become inflated with large sample sizes and thus reject models that are otherwise valid (James, Mulaik, & Brett, 1982; Raykov, 1998). In comparing the relative fitness of structural models with significant chi-squares, models with smaller chi-square values are con-sidered superior to those with larger values (Hatcher, 1994). A test of the difference between the chi-squares for these models indicated that the one-factor model fit the data signif-icantly better than the null,χ2(15,N= 321) = 981.06,p< .01,
whereas the higher order factor model, which had the small-est chi-square, provided a better fit than the one-factor model,χ2(3,N= 321) = 75.41,p< .01. Therefore, both
struc-tural models fit the data better than the null model, of which the higher order factor model appeared to be the best.
The goodness-of-fit index (GFI), comparative fit index, and nonnormed index (NNI), which are reported in Table 3, can range from 0 (no fit) to 1.0 (perfect fit), with values close to .90 indicating an acceptable fit4(Browne & Cudeck, 1992;
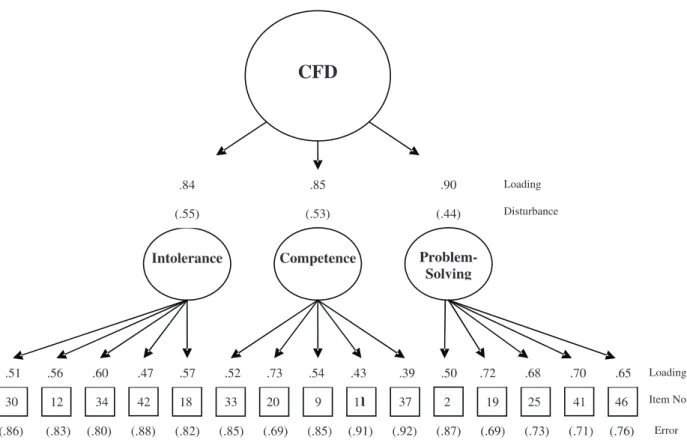
Schumaker & Lomax, 1996). For the root mean standard er-ror of approximation (RMSEA), which is also reported in Ta-ble 3, values less than .08 are indicative of an adequate fit (Browne & Cudeck, 1992; Byrne, 1998). The GFI, compara-tive fit index, NNI, and RMSEA suggested that the one-factor model had a relatively poor fit, whereas all four of these GOF indexes for the higher order factor model pro-vided evidence of an adequate, although far from perfect, fit. Thus, the chi-square difference test and the other GOF in-dexes were most supportive of the hypothesized higher order factor CFD model. The maximum likelihood estimates for the standardized factor loadings, error path coefficients, and disturbance terms for the higher order factor CFD model are presented in Figure 1. As expected, the three lower order CFD factors had substantial loadings on the higher order fac-tor (Mloading = .86). For the lower order factors, the load-ings for the indicators were relatively strong, ranging in magnitude from .39 to .72. All of the higher order and lower order factor loadings were significant (p< .001).
Psychometric Characteristics of the CFD Scale and Subscales
Means, standard deviations, and Cronbach’s alpha coeffi-cients for the CFD scale and subscales, the three CFI mea-sures, and the other personality traits are reported in Table 4. Because no gender differences were found for any of the scales, these statistics are based on the total sample. As ex-pected, the alpha coefficient for the 15-item CFD scale was high (α= .84), indicating good internal consistency. Although alphas for the five-item subscales were relatively low (Mα= .70), they were considered to indicate acceptable, if not desir-able, internal consistency given that each subscale consisted of only five items and that this study reflected only the very early stages of research on CFD as a psychological construct (Cortina, 1993; DeVellis, 1991; Nunnally, 1967, 1978; Streiner, 2003). The mean interitem correlations for the three subscales ranged from .27 to .42, which was also indicative of acceptable internal consistency (Clark & Watson, 1995). Al-phas for the three CFI scales (T–Cur, PC, and EC) were
satis-4
Stevens (1996) suggested that less stringent values may also be considered indicative of an acceptable fit and may be more appropri-ate when testing newly developed models. Similarly, Raykov (1998) and also MacCallum and Hong (1997) have expressed concerns that the commonly used .90 cutoff may lead to the rejection of well-fitting models, especially in the very early theoretical and em-pirical stages of research.
TABLE 3
Goodness of Fit Indexes for the Three CFD Models
GOF
Index Null Model
One-Factor CFD Model Higher Order Factor CFD Model χ2(df) 1267.40 (105)* 286.34 (90)* 210.93 (87)* GFI — .89 .92 CFI — .83 .89 NNI — .80 .87 RMSEA — .08 .06
Note. CFD = curiosity as a feeling of deprivation; GFI = goodness-of-fit index; CFI = comparative fit index; NNI = nonnormed fit index; RMSEA = root mean standard error of approximation.
factory (Mα= .77), as were alphas for the STPI Trait measures of Anxiety, Anger, and Depression (Mα= .86).
Pearson product–moment correlations between the CFD scale and subscales, the three CFI measures, and the other
personality traits are reported in Table 5. The CFD scale cor-related very highly with its subscales due to the overlap of items. Small to moderately large significant positive correla-tions were found between the CFD scales with the three CFI measures (M r= .446). The strongest of these correlations were between the CFD scales with the EC scale (M r= .62), which was not surprising considering that these measures were specifically designed to assess reactions to acquiring knowledge and solving problems. The weakest relationships (r< .30) were found between the CFD/P subscale with the PC and T–Cur scales, most likely due to the fact that these CFI measures do not assess tendencies to solve intellectual problems. As would be expected, the three CFI scales corre-lated positively and substantially with one another (M r = .513). Overall, these results provide evidence of convergent validity for the CFD scale and subscales but also suggest that the CFD and CFI subscales were assessing different, al-though overlapping, aspects of curiosity.
Very small negative correlations were found between the CFD/C subscale and the STPI Trait measures of Anxiety and Depression, whereas small positive correlations were found between the CFD/P subscale with Depression and Anger and between the CFD/I subscale with Anxiety, Depression, and Anger. These findings provided evidence of divergent valid-ity for the CFD scales but also suggested that the prob-lem-solving and intolerance aspects of CFD are associated
TABLE 4
Means, Standard Deviations, and Cronbach’s Alpha Coefficients for the CFD
Total Scale and Subscales, the CFI Measures of Curiosity, and Other
Personality Measures Measure M SD CFD Scales CFD Total Scale 37.82 7.24 .84 CFD/C 13.65 2.76 .64 CFD/P 10.80 3.14 .78 CFD/I 13.37 2.92 .68 CFI Scales EC 26.88 5.34 .83 PC 27.93 5.13 .72 T–Cur 28.92 4.34 .76 Other Trait Anxiety 20.92 4.34 .83 Trait Depression 16.87 5.39 .89 Trait Anger 21.13 6.12 .86
Note. N = 321. CFD = curiosity as a feeling of deprivation; CFI = curiosity as a feeling of interest; CFD/C = CFD Competence subscale; CFD/F = CFD Problem-Solving subscale; CFD/I = CFD Intolerance subscale; EC = Epistemic Curiosity; PC = Perceptual Curiosity; T–Cur = Trait Curiosity.
FIGURE 1 Maximum likelihood estimates for the standardized factor loadings, error path coefficients, and disturbance terms for the higher order fac-tor curiosity as a feeling of deprivation (CFD) model (N= 321). Item no. = the ordinal position of an item within the Curiosity Questionnaire; all factor loadings are significant atp< .001.
with some degree of negative affectivity. By contrast, the only significant relationships that were found between the CFI and STPI measures were negative in sign. Although these findings are generally consistent with the view that CFD reactions involved some unpleasantness, they also sug-gest that CFD experiences were not as aversive in nature as hypothesized (Loewenstein, 1994).
Evaluating the Structural Relationship Between CFD and CFI
To evaluate the structural relationship between the CFD and CFI constructs, scores on the three CFD subscales (Compe-tence, Problem-Solving, and Intolerance) and the three CFI scales (T–Cur, PC, and EC) were submitted to confirmatory factor analyses. As with similar analyses conducted earlier, these findings were not interpreted as reflecting a true valida-tion of the proposed two-factor model but simply provided a means of comparing the relative fitness of alternative struc-tural models. The first model tested consisted of a single curi-osity factor with paths to each of the scales; the second model consisted of a CFD factor with paths leading to the three CFD subscales and a CFI factor with paths to the T–Cur, PC, and EC scales. Given the very high correlations that were found between the EC and CFD scales, a nonstandard third model was tested, which was identical to the second model except that it included an additional path from the CFD factor to the EC scale. These three structural models were compared to each other and to a null model for which the GOF indexes are reported in Table 6.
For all three structural models, significant chi-squares (p< .01) were found; a test of the difference between the chi-squares indicated that the two-factor model was superior to the one-factor model, χ2(1, N = XX) = 15.55,p < .01,
whereas the nonstandard (CFD→EC←CFI) model had a significantly better fit than the two-factor model,χ2(1,N=
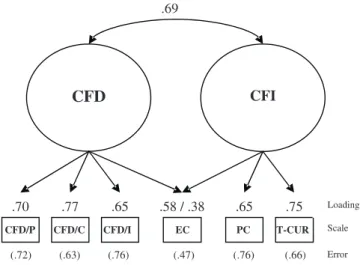
XX) = 17.30,p< .01 and therefore had the best fit overall. The GFI and comparative fit index were greater than .90 for the one- and two-factor models, whereas the NNI was less than .90, and the RMSEA was greater than .08. Although the RMSEA for the nonstandard model was also above .08, the GFI, comparative fit index, and NNI were all .92 or greater. Thus, the chi-square difference test and three of the four other GOF indexes were most supportive of the nonstandard model, providing further evidence that CFD and CFI can be empirically differentiated but that the EC scale, given that its items referred to acquiring knowledge and solving problems, was less distinct from CFD as compared to the other two CFI measures. Estimates for the interfactor correlation, factor loadings, and error path coefficients for the nonstandard model are presented in Figure 2. The two factors were very highly correlated (r= .69), suggesting that CFD and CFI re-flected substantially related but distinct aspects of an under-lying curiosity construct; all loadings for the nonstandard model were significant (p< .01) and ranged from .38 to .77.
DISCUSSION
A major goal of this study was to develop a reliable and valid scale for measuring individual differences in CFD. A pool of 27 CFD items was administered to 321 participants (248 women, 73 men) along with three scales for assessing CFI and measures of other personality traits. A set of 18 CFD items with high internal consistency was identified, and a factor analysis of responses to these items yielded three fac-tors: (Factor 1) a need for competence, (Factor 2) intolerance for information that was inaccessible or inadequate, and (Factor 3) problem-solving motivated by feelings of tension. These three factors were highly consistent with Loewenstein’s (1994) concept of CFD.
On the basis of factor loadings and item content, five items were selected for measuring each CFD dimension to form a
TABLE 5
Pearson Product–Moment Correlations Between the CFD Total Scale and Subscales, the CFI Measures of Curiosity, and Other Personality Measures
Measure CFD Total Scale CFD/C CFD/P CFD/I EC PC T–Cur
CFD Scales CFD/C .79** — — — — — — CFD/P .85** .52** — — — — — CFD/I .81** .44** .53** — — — — CFI Scales EC .72** .66** .57** .53** — — — PC .40** .37** .21** .40** .49** — — T–Cur .43** .44** .28** .35** .58** .47** — Other Trait Anxiety .04 –.12* .09 .11* –.13* –.08 –.38** Trait Depression .07 –.12* .11* .11* –.04 –.02 –.31** Trait Anger .20** –.01 .17* .32** .03 .08 .00
Note. N= 321. CFD = curiosity as a feeling of deprivation; CFI = curiosity as a feeling of interest; CFD/C = CFD Competence subscale; CFD/F = CFD Problem-Solving subscale; CFD/I = CFD Intolerance subscale; EC = Epistemic Curiosity; PC = Perceptual Curiosity; T–Cur = Trait Curiosity.
15-item CFD scale with three five-item subscales. A confir-matory factor analysis in which CFD was treated as a higher order factor with each subscale modeled as lower order fac-tors was found to have the best fit as compared to two alter-nate models that were tested. This finding was consistent with the view that the three subscales reflected overlapping but meaningfully distinct aspects of an underlying CFD con-struct. The CFD scale and subscales had adequate internal consistency reliability coefficients, ranging from .64 to .84.
The CFD scales correlated significantly and positively with the CFI scales, suggesting that curiosity could be mean-ingfully conceptualized as involving feelings of both interest and deprivation and providing evidence of convergent valid-ity for the CFD scales. Positive correlations were also found between the CFD/P and CFD/I subscales with anxiety, de-pression, and anger that were small but significant. The mag-nitude of these correlations provided evidence of divergent validity for the CFD scales, whereas the positive direction in-dicated that these aspects of CFD involve some degree of negative affectivity. Although these findings were generally consistent with the theoretical definition of CFD, they also
suggest that CFD reactions were clearly less aversive than Loewenstein (1994) had hypothesized. This may be due to the fact that the CFD items—particularly the CFD/C items—primarily assess feelings associated with seeking or anticipating a reduction in tension (e.g., relief) as may be contrasted with emotions related to expectations of experi-encing either increased tension (e.g., anxiety) or increased pleasure (e.g., joy).
The structural relationship between the CFD and CFI mea-sures was evaluated with confirmatory factor analyses; a non-standard two-factor (CFI and CFD) model that included a path leading to the EC scale from the CFD factor was found to be the overall best fitting of three alternate models tested. This find-ing provides evidence that CFD and CFI can be empirically differentiated but that the EC scale was less distinct from CFD as compared to the other two measures of CFI, presumably due to the fact that all of the EC items described seeking knowl-edge and solving problems much like the CFD items.
An alternative account for the differentiation between the CFD and CFI factors is that the two factors are an artifact of different response styles by participants who were influenced
TABLE 6
Goodness-of-Fit Indexes for the Three Curiosity Models
GOF Index Null Model
One-Factor Curiosity Model
Two-Factor Model (CFD and CFI)
Nonstandard Two-Factor Model (CFD EC CFI) χ2(df) 733.41 (15)* 67.73 (9)* 52.18 (8)* 34.88 (7)* GFI — .93 .95 .97 CFI — .92 .94 .96 NNI — .86 .88 .92 RMSEA — .14 .13 .11
Note. CFD = curiosity as a feeling of deprivation; GFI = goodness-of-fit index; CFI = comparative fit index; NNI = nonnormed fit index; RMSEA = root mean standard error of approximation.
*p< .01.
FIGURE 2 Maximum likelihood estimates for the interfactor correlation, standardized factor loadings, and error path coefficients for the nonstandard curiosity as a feeling of deprivation (CFD) and curiosity as a feeling of interest (CFI) two-factor model (N= 321). CFD/P = Problem-Solving scale; CFD/C = Competence scale; CFD/I = Intolerance scale; EC = Epistemic Curiosity; PC = Perceptual Curiosity; T–Cur = Trait Curiosity. All factor load-ings were significant atp< .001.
by the negative tone of many of the CFD items (e.g., “frus-trated if can’t figure out solution/work even harder to solve”) and the positive tone of the CFI items (e.g., “I feel stimu-lated”). However, as recently noted by Schimmack, Böckenholt, and Reisenzein (2002), the influence of response styles on self-report measures pertaining to positive and nega-tive affectivity is negligible at best and does not constitute a significant source of measurement error. Moreover, given that the correlations of the CFD measures with the negative affectivity scales (e.g., Trait Anxiety) were rather small, it is unlikely that response tendencies particular to curiosity items that described relatively unpleasant emotions accounted for the differentiation between CFD and CFI.
In keeping with Loewenstein’s (1994) view, there are sev-eral other characteristics of the CFD items besides their neg-ative affective tone that distinguish them from those that make up the CFI scales. Loewenstein suggested that CFD in-volves a powerful motive to obtain knowledge, is not easily satisfied, and is an important determinant of increasing one’s competence. Accordingly, the CFD items describe a preoc-cupation with obtaining knowledge (e.g., “problem/can’t rest without knowing answer”), a demand for information of sub-stantive value (e.g., “critical of ideas and theories”), and be-ing motivated to invest time and effort to obtain knowledge to increase feelings of competence (e.g., “read something that puzzles/keep reading until I understand”). By contrast, the CFI items only refer to feelings of enjoyment or height-ened states of arousal that are associated with encountering novel stimuli and do not address other behavioral or emo-tional expressions related to knowledge acquisition.
Directions for Future Research
CFD and CFI appear to be psychometrically distinguishable constructs but overlap substantially, particularly in relation to epistemic curiosity. To determine whether differentiating be-tween these constructs is practically meaningful, several im-portant differences that were hypothesized between CFD and CFI reactions will need to be investigated in future research. First, as noted previously, exploratory behavior motivated by CFI is assumed to be positively reinforced, whereas explora-tion energized by CFD is theorized to be negatively rein-forced. In previous research, individual differences in per-sonality traits have been found to predict people’s sensitivity to environmental signals for each of these two types of rein-forcement (Collard, 1998; Corr, 2002; Seunath, 1975). With this in mind, a consideration of differential tendencies to per-ceive knowledge acquisition as either positively or negatively reinforcing needs to be investigated and may improve our un-derstanding of the factors that underlie approaching or avoid-ing opportunities for intellectual enrichment.
Second, CFD reactions are hypothesized to be associated with more intense and impulsive behavioral expressions of curiosity as compared to CFI reactions. Therefore, it will be important to examine how individual differences in CFD and CFI differentially predict tendencies to engage in
informa-tion-seeking and problem-solving behavior. Third, it will also be important to evaluate whether knowledge gained fol-lowing a CFD reaction is more likely to increase feelings of competence as compared to information acquisition moti-vated by CFI.
Another important direction for future research will be to further evaluate whether the three aspects of CFD identified in this study represent meaningfully distinct dimensions. This will require an additional examination of the proposed model with a novel sample and also an investigation of whether each CFD dimension predicts individual differences in different types of information-seeking behaviors. For example, it would be expected that scores on the CFD Problem-Solving subscale correspond with differences in puzzle-solving per-sistence, Intolerance subscale scores might be related to the degree of frustration experienced while trying to figure out challenging intellectual problems, and scores on the Compe-tence subscale might predict scholarly performance and aca-demic achievement. Thus, research on CFD offers fertile ground for scientists who are interested in areas such as moti-vation, problem solving, and educational attainment.
ACKNOWLEDGMENTS
We thank Adriana Thomas, Shelley Loadwick, Katheryne Downes, and Jon McMahon for their assistance in conduct-ing this study. We are especially grateful to Ryan Russon, Mark Pezzo, Thomas Joiner, and Daniel Ozer for their valu-able suggestions for this article.
REFERENCES
Berlyne, D. E. (1950). Novelty and curiosity as determinants of exploratory behavior.British Journal of Psychology, 41,68–50.
Berlyne, D. E. (1954). A theory of human curiosity.British Journal of Psy-chology, 45,180–191.
Berlyne, D. E. (1966, July). Curiosity and exploration.Science, 153,25–33. Berlyne, D. E. (1967). Arousal and reinforcement. In D. Levine (Ed.),
Ne-braska symposium on motivation(pp. 1–110). Lincoln: University of Ne-braska Press.
Berlyne, D. E. (1971). What next? Concluding summary. In H. I. Day, D. E. Berlyne, & D. E. Hunt (Eds.),Intrinsic motivation: A new direction in ed-ucation (pp. 186–196). Toronto, Ontario, Canada: Holt, Rinehart & Winston of Canada.
Browne, M. W., & Cudeck, R. (1992). Alternative ways of assessing model fit. In K. A. Bollen & J. S. Long (Eds.),Testing structural equation models
(pp. 136–162). Newbury Park, CA: Sage.
Byrne, B. M. (1998).Structural equation modeling with LISREL, PRELIS, and SIMPLIS: Basic concepts, applications, and programming.Mahwah, NJ: Lawrence Erlbaum Associates, Inc.
Cacciopo, J. T., & Petty, R. E. (1982). The need for cognition.Journal of Personality and Social Psychology, 42,116–131.
Cattell, R. B. (1958). Extracting the correct number of factors in factor anal-ysis.Educational and Psychological Measurement, 18,791–837. Clark, L. A., & Watson, D. (1995). Constructing validity: Basic issues in
ob-jective scale development.Psychological Assessment, 7,309–319. Collard, C. V. (1998). Extraversion/introversion and reward/punishment. In
D. H. Sakolofske & S. B. Eysenck (Eds.),Individual differences in chil-dren and adolescents(pp. 278–290). New Brunswick, NJ: Transaction. Collins, R. P., Litman, J. A., & Spielberger, C. D. (in press). The
Comrey, A. L. (1988). Factor-analytic methods of scale development in per-sonality and clinical psychology.Journal of Consulting and Clinical Psy-chology, 56,754–761.
Corr, P. J. (2002). J. A. Gray’s reinforcement sensitivity theory: Tests of the joint subsystems hypothesis of anxiety and impulsivity.Personality and Individual Differences, 33,511–532.
Cortina, J. M. (1993). What is coefficient alpha? An examination of theory and applications.Journal of Applied Psychology, 78,98–104.
Day, H. I. (1971). The measurement of specific curiosity. In H. I. Day, D. E. Berlyne, & D. E. Hunt (Eds.),Intrinsic motivation: A new direction in ed-ucation.New York: Holt, Rinehart & Winston.
Dember, W. N. (1956). Response by the rat to environmental change. Jour-nal of Comparative Physiological Psychology, 49,93–95.
DeVellis, R. F. (1991). Scale development: Theory and applications.
Newbury Park, CA: Sage.
Fowler, H. (1966).Curiosity and exploratory behavior.New York: Macmillan. Hatcher, L. (1994).A step-by-step approach to using the SAS system for
fac-tor analysis and structural equation modeling.Cary, NC: SAS. Harlow, H. F. (1950). Learning and satiation of response to intrinisically
mo-tivated complex puzzle performance by monkeys.Journal of Compara-tive Physiological Psychology, 40,289–294.
Hays, R. D. (1987). Parallel: A program for performing parallel analysis.
Applied Psychological Measurement, 11,58.
Hebb, D. O. (1955). Drives and the C. N. S. (conceptual nervous system).
Psychological Review, 62,243–254.
James, L. R., Mulaik, S. A., & Brett, J. M. (1982).Causal analysis: Assump-tions, models, and data.Beverly Hills, CA: Sage.
Jarvis, W. B., & Petty, R. E. (1996). The need to evaluate.Journal of Person-ality and Social Psychology, 70,172–194.
Keller, H., Schneider, K., & Henderson, B. (1994). Preface: The study of ex-ploration. In H. Keller, K. Schneider, & B. Henderson (Eds.),Curiosity and exploration(pp. 199–212). Berlin: Springer-Verlag.
Leuba, C. (1955). Toward some integration of learning theories: The concept of optimal stimulation.Psychological Reports, 1,27–33.
Litman, J. A. (2000).Construct and predictive validity of measures of epistemic and perceptual curiosity.Unpublished doctoral dissertation, University of South Florida, Tampa.
Litman, J. A., & Spielberger, C. D. (2003). Measuring epistemic curiosity and its diversive and specific components.Journal of Personality Assess-ment, 80,75–86.
Loewenstein, G. (1994). The psychology of curiosity: A review and reinter-pretation.Psychological Bulletin, 116,75–98.
Loewenstein, G., Adler, D., Behrens, D., & Gillis, J. (1992).Why pandora opened the box: Curiosity as a desire for missing information. Unpub-lished manuscript, Department of Social and Decision Sciences, Carnegie Mellon University, Pittsburgh, PA.
MacCallum, R. C., & Hong, S. (1997). Power analysis in covariance struc-ture modeling using GFI and AGFI.Multivariate Behavioral Research, 32,193–210.
MacDonald, A. P. (1970). Revised scale for ambiguity tolerance: Reliability and Validity.Psychological Reports, 26,791–798.
Mayer, D. J. (1952). The glucostatic theory of regulation of food intake and the problem of obesity.Bulletin of the New England Medical Center, 14,43. Murray, H. A. (1938).Explorations in personality.New York: Oxford
Uni-versity Press.
Naylor, F. D. (1981). A state-trait curiosity inventory.Australian Psycholo-gist, 16,172–183.
Nunnally, J. C. (1967).Psychometric theory.New York: McGraw-Hill. Nunnally, J. C. (1978). Psychometric theory (2nd ed.). New York:
McGraw-Hill.
Peterson, C., & Seligman, M. E. P. (2001).VIA Inventory of Strengths (VIA–IS).
Retrieved from http://www.positivepsychology.org/viastrengthsinventory. htm
Raykov, T. (1998). On the use of confirmatory factor analysis in personality research.Personality and Individual Differences, 24,291–293. Rolls, B. J., Rowe, E. T., & Rolls, E. T. (1980). How sensory properties of
food affect human feeding behavior. Physiology and Behavior, 29,
409–417.
Rummel, R. J. (1970).Applied factor analysis.Evanston, IL: Northwestern University Press.
Schimmack, U., Böckenholt, U., & Reisenzein, R. (2002). Response styles in affect ratings: Making a mountain out of a molehill.Journal of Person-ality Assessment, 78,461–483.
Schumaker, R. E., & Lomax, R. G. (1996).A beginner’s guide to structural equation modeling.Mahwah, NJ: Lawrence Erlbaum Associates, Inc. Seunath, O. M. (1975). Personality, reinforcement, and learning.Perceptual
and Motor Skills, 41,459–463.
Spielberger, C. D. (1979).Preliminary manual for the State–Trait Personality Inventory.Unpublished manuscript, University of South Florida, Tampa. Spielberger, C. D. (1983).Manual for the State–Trait Anxiety Inventory
(Form Y).Palo Alto, CA: Consulting Psychologists Press.
Spielberger, C. D. (1988).Professional manual for the State–Trait Anger Expression Inventory (STAXI)(research ed.). Tampa, FL: Psychological Assessment Resources.
Spielberger, C. D., Peters, R. A., & Frain, F. (1976).The State–Trait Curiosity Inventory.Unpublished manuscript, University of South Florida, Tampa. Spielberger, C. D., & Starr, L. M. (1994). Curiosity and exploratory
behav-ior. In H. F. O’Neil, Jr. & M. Drillings (Eds.),Motivation: Theory and re-search(pp. 221–243). Hillsdale, NJ: Lawrence Erlbaum Associates, Inc. Stevens, J. (1996).Applied multivariate statistics for the social sciences.
Mahwah, NJ: Lawrence Erlbaum Associates, Inc.
Streiner, D. L. (2003). Starting at the beginning: An introduction to coeffi-cient alpha and internal consistency.Journal of Personality Assessment, 80,99–103.
Welker, W. I. (1956). Effects of age and experience on play and exploration of young chimpanzees.Journal of Comparative Physiological Psychol-ogy, 49,223–226.
Jordan A. Litman
Center for Research in Behavioral Medicine and Health Psy-chology
Department of Psychology University of South Florida Tampa, FL 33620–8200
E-mail: [email protected] Received February 14, 2003 Revised July 10, 2003