GRIPS Discussion Paper 15-22
Credit Booms in Developing Countries: Are They Different from
Those in Advanced and Emerging Market Countries?
Channarith Meng
Roberto Leon Gonzalez
January 2016
National Graduate Institute for Policy Studies 7-22-1 Roppongi, Minato-ku,
-1-
Credit Booms in Developing Countries: Are They Different from
Those in Advanced and Emerging Market Countries?
Channarith Meng1 and Roberto Leon Gonzalez2
Abstract
While earlier studies focus on credit booms in advanced and emerging market countries, this paper examines the characteristics and determinants of credit booms in developing countries. The results find that credit booms in developing countries are less likely to be associated with systemic banking crises. Rather, they are more likely to be the result of financial deepening than of dangerous buildups of financial risks; the prevention of credit booms in developing countries may thus be associated with higher opportunity costs in terms of foregone growth opportunities. Random effect probit and tobit regressions find some evidence that size of financial system and favorable macroeconomic conditions are among the determinants of credit booms. Although monetary and fiscal policies do not help in preventing credit booms in developing countries, we find that prudential regulations and supervision can play a much more effective role in preventing “bad” booms, while incurring substantially lower costs. Although “bad” booms are hard to identify ahead of time, the duration and size of booms, as well as the level of credit aggregates, appear to be useful indicators in determining them.
Keywords: credit booms, financial stability, developing countries, macroeconomic policy, financial policy
JEL Classification Codes: E44, E51, G01, G28
1
National Bank of Cambodia, Cambodia. Email: [email protected]. The author is grateful for the research grants provided by the National Bank of Cambodia and research facilities offered by the National Graduate Institute for Policy Studies (GRIPS) during his stay as a visiting scholar.
2
National Graduate Institute for Policy Studies (GRIPS, Japan), and Rimini Center for Economic Analysis (RCEA, Italy). Email: [email protected]
-2-
1. Introduction
Credit or lending plays an important role in supporting economic growth. An insufficient supply of credit to the private sector can constrain economic activities, which ultimately undermines the long-run growth prospects for an economy (Levine, 2005). However, rapid expansion of credit, or so-called credit booms, can be equally damaging to growth, as they are sometimes followed by episodes of financial distress and banking crises. The latter scenario is increasingly documented in recent literature and contributes to the belief that credit booms can be a recipe for financial crises (for example, see Caprio and Klingebiel, 1996, Gourinchas, Valdes, and Landerrtche, 2001, and Borio and Lowe, 2002). These concerns have been heightened since the recent global financial crisis, which in turn has brought a lot of attention for countries and international bodies to develop toolkits to monitor and prevent excessive expansion of credit.
Although some episodes of credit booms can be associated with heightened financial imbalances and risks of financial crises, the importance of credit in financial deepening and growth dynamics as described in other strands of the literature cannot be ignored. History tells us that not every credit boom ends in a crisis; thus, the cost of curtailing credit growth can be quite substantial, particularly in the context of developing countries, which still require a huge expansion of credit to meet their growing consumption and investment needs.
The trade-off arising from allowing or preventing rapid credit growth poses a policy dilemma. Improved policy responses to this trade-off surely require an in-depth
understanding of the characteristics of credit booms. A number of studies have discussed various aspects of credit booms, ranging from the association between credit booms and booms in other macroeconomic variables3 to potential drivers of credit booms and the implications of such booms for financial stability, financial deepening, and long-term economic growth. Among these studies, we focus our attention on investigations of the potential determinants of credit booms, the aims of which are closely associated with the objective of this paper.
Gourinchas, Valdes, and Landerretche (2001), one of the first comprehensive studies focusing on credit booms, uses an event study covering a sample of 91 advanced and emerging countries in Latin America and the rest of the world; they suggest that a number
3
The macroeconomic variables previously studied include domestic investment and consumption booms, housing price booms, real exchange rate appreciation, current account deterioration, and reserve position.
-3-
of macroeconomic variables4 change during the buildup of credit booms, implying that these variables possibly trigger such booms.
Mendoza and Terrones (2008) complement earlier studies by providing an alternative methodology to identify credit boom episodes to which later studies adhere closely, and also use an event analysis method with a sample of 49 countries. They find that credit booms in emerging market economies tend to be preceded by large capital inflows and not by domestic financial reforms or TFP gains, while credit booms in industrial countries are likely to be preceded by high TFP gains or financial reforms. Later, with a sample of 61 emerging and industrial countries and longer time periods, Mendoza and Terrones (2012) revise their conclusion that in both industrial and emerging economies, credit booms often follow surges in capital inflows, TFP gains, and financial reforms, and are far more
common with managed than with flexible exchange rate regimes.
Elekdag and Wu (2013) also use event analysis with 21 advanced and 43 emerging economies and indicate that credit booms are associated with episodes of large capital inflows; and that loose macroeconomic policy stances, especially regarding monetary policy, also appear to be important drivers of real credit growth across emerging economies, including those in Asia.
The above-mentioned papers employ the event analysis approach, which can be useful in terms of discovering and explaining important stylized facts, particularly key non-linear relationships. However, these results cannot be interpreted with any causal implication. Fewer studies attempt to establish causality via econometric approaches. For instance, IMF (2011) applies a panel logit model with 47 advanced and emerging market economies to study the underlying factors leading to credit booms; and finds that financial sector reforms, TFP gains, and in particular, net capital inflows appear to be good predictors of credit booms. Similarly, the study of Arena et al. (2015) on 135 middle- and low-income
countries using event analysis and panel probit regression suggests that capital inflows are important determinants of credit boom episodes in middle- and low-income countries. Particularly with event analysis, countries with less flexible exchange rates may experience significant credit growth at the time of capital inflow surges, while financial openness can also trigger credit booms.
4
The changing macroeconomic variables include output gap, investment, consumption, domestic real interest rate, inflation, real exchange rate, current account balance, private capital inflows, short-term external debt, and terms of trade.
-4-
Calderón and Kubota (2012) examine the role of gross capital inflows in causing credit booms using event and probit regression analyses with quarterly data from a sample of 71 countries and conclude that surges in gross private capital inflows, especially other
investment inflows, are good predictors of credit booms. Dell’Ariccia et al. (2012) employ simple pooled OLS regression to study some policy variables that may trigger credit booms and conclude that credit booms seem to occur more often in countries with fixed exchange rate regimes and expansionary macroeconomic policies. However, their regression results are based on a pool of both industrial and emerging economies sampled together and with relatively few observations in the sample. They further explain that the duration and magnitude of a boom has been a predictor of whether the boom ends up in a banking crisis (“bad” booms), which is in line with results reported in Gourinchas et al. (2001) and Barajas, Dell’Ariccia, and Levchenko (2008). Other macroeconomic variables including larger current account deficits, higher inflation, lower quality banking supervision, and faster growing asset prices may help predict “bad” booms, but they do not find any statistical significance.
In this paper, we will contribute to the existing empirical literature on the determinants of credit booms in a number of ways. First, previous studies focus their analyses on advanced and emerging market economies. Some of them even combine data from such countries together into pooled regression analyses, although these countries share broadly different characteristics and stages of development. Instead, our paper will focus on credit booms in developing countries and compare them with those in advanced and emerging market economies. Second, in addition to a binary response probit model, this paper provides the first attempt with a tobit regression model to provide a robustness check on the findings from the probit model and also to identify which factors may potentially trigger magnitude of the booms. Moreover, our econometric approach will focus on the role of domestic policies in curbing or developing credit booms, which are rarely highlighted in previous studies. Finally, we perform our analysis on a broader set of countries.
The remainder of the paper proceeds as follows: Section 2 presents the methodology for identifying credit boom episodes and empirical approaches to estimate the determinants of credit booms and the ones ending in banking crises. Section 3 offers data sources and variable definitions used in this paper. Section 4 provides some main stylized facts on the characteristics of credit booms, while section 5 presents empirical results from the
-5-
2. Methodology
2.1. Identification of Credit Boom Episodes
Identifying credit booms has been achieved via two types of approaches. A number of studies employ statistical techniques, for example, Mendoza and Terrones (2008, 2012), Gourinchas, Valdes and Landarretch (2001), Barajas, Dell’Ariccia and Levchenko (2009), Tornell and Westermann (2002), IMF (2011), Dell’Ariccia et al. (2012), and Arena et al. (2015). They compare a country’s credit-to-GDP ratio or real credit per capita to its non-linear trend and determine the episodes of credit booms when the positive deviations from trend pass a certain threshold. These studies differ in terms of choices of variable of credit5, choices of thresholds in identifying booms, whether the trend and the thresholds are
country-specific, or whether the credit and GDP series is filtered separately or directly as a ratio. Beside purely statistical approaches, some studies use econometric methods to determine the long-term equilibrium level of credit or credit growth as a function of economic fundamentals across the whole sample of countries; they then identify the boom periods for a country at the points where the level of credit is above the long-run
equilibrium level. For examples, see Calvo-Gonzalez et al. (2006); Cotarelli et al. (2005); Egert et al. (2007); Kiss et al. (2006); and Hansen and Sulla (2013). In this paper, following most recent studies, we employ the statistical approach to capture the credit boom episodes. We follow the widely used threshold method developed by Mendoza and Terrones (2012) to identify credit booms. They define a credit boom episode as occurring when credit to the private sector grows by more than that experienced in a typical business cycle expansion. Specifically, a credit boom occurs when the deviation in the logarithm of real credit per capita from its long-run trend is equal or higher than a certain threshold, defined as 1.65 times of the standard deviation of the cyclical component6. We use the Hodrick-Prescott (HP) filter with the smoothing parameter set at 100, which is typical for annual data, to decompose real credit per capita into its long-run trend and cyclical components. The thresholds are country-specific to ensure that credit booms are unusually large deviations relative to a country’s typical credit cycle. The peak year of the boom is the year of maximum difference between the cyclical component of real credit per capita and the threshold from the set of contiguous years that satisfy the credit boom condition.
5
Some studies use only bank credit, while others stress the importance of using credit by both banks and non-bank financial institutions. Also, some use credit-to-GDP ratio, while others use real credit per capita to proxy credit development.
6
The value 1.65 is chosen because it falls in the 5 percent upper tail of the standardized normal distribution.
-6-
We follow Mendoza and Terrones (2012) and use real credit per capita instead of credit-to-GDP ratio7, since it is well known that the latter has certain limitations. First, there can be situations in which both nominal credit and GDP are falling and yet the ratio increases because GDP falls at a faster rate, which could lead to misleading interpretations. Also, the credit-to-GDP ratio does not allow for the possibility that credit and output could have different trends, which is important if countries are undergoing a process of financial deepening, or if, for other reasons, the trend of GDP and that of credit are progressing at different rates.
One of other main objectives of this study is to analyze credit booms and their determinants in developing countries and compare them with those in advanced and emerging market economies, given the fact that countries share different characteristics and levels of development. To pursue this objective, we split the countries into three main groups: advanced economies, emerging market economies, and developing economies. To classify countries, we follow the IMF in categorizing countries into advanced economies and emerging and developing economies. However, the IMF does not distinguish emerging markets and developing countries. To split them, we then follow the classification systems of the Morgan Stanley Capital International Index, S&P Dow Jones Index and FTSE Emerging Index. As a result, our sample classification comes up with 29 advanced economies, 24 emerging market economies, and 107 developing economies. A list of economies and their classifications is given in appendix 1.
2.2. Determinants of Credit Booms
To examine the determinants of credit booms, we consider two applicable models, namely random effect panel probit models and random effect panel tobit models, with the sample of 160 advanced, emerging market, and developing economies over the period of 1960– 2013. Our general specification is as follows:
( ), (1)
where is the credit boom variable; ( ) stands for the distribution function; is an unobserved time-invariant individual effect; and x contains variables of macroeconomic development and structural characteristics, as well as macroeconomic and financial
policies. Those are credit-to-GDP ratio, GDP growth, inflation, current account balance as a
7
Studies by Gourinchas et al. (2001), Barajas et al. (2007), Dell’Ariccia et al. (2012) use the credit-to-GDP ratio.
-7-
proportion of GDP, capital inflows as a proportion of GDP, trade openness, exchange rate regimes, monetary policy stance, fiscal policy stance, financial reform index, and quality of banking supervision and regulations. All explanatory variables are used in lag form to avoid potential endogeneity problems and thus ensure that the direction of causality is from the explanatory variables to the dependent variable, but not vice versa.
Equation (1) is a probit model when we estimate the model for credit boom incidence,
( ) ( ),
where ( ) denotes the cumulative density function of normal standard distribution and takes value one when there is a credit boom, and zero, otherwise.
Equation (1)is a tobit model when we estimate the model for magnitude of the credit booms:
( )
where is the magnitude of the booms obtained by taking the difference between (log) real credit per capita and its trend value during the credit boom, and zero, otherwise.
The use of random effects probit and tobit models allows us to account for the
heterogeneity with the inclusion of individual country effects in the conditional mean. Also, the tobit models for panel data are usually estimated by random effects rather than by fixed effects, because the fixed effect estimations require a very high number of periods (the so-called incidental parameter problem).
2.3. Determinants of Credit Booms Ending in Banking Crisis (“Bad” Booms)
In similar manner to previous papers, we use a probit regression model to study the drivers of “bad” booms, modelled as follows:
( ) ( );
where ( ) denotes the cumulative density function of the normal standard distribution and takes value one when a credit boom is followed within two years from its end by an episode of banking crisis, and zero, otherwise8. Explanatory variables, in addition to
8
-8-
mentioned variables, also contain variables that capture the duration and magnitude of booms, as we also want to examine if duration and size of a boom matters in predicting a boom ending in a banking crisis.
Given the cross-sectional nature of the boom duration, we examine this section with a sectional probit model. Thus, the panel dataset is collapsed into a simple cross-sectional form; and each observation reflects the mean value of all variables except duration over each boom period.
3. Data and Variable Definitions
The sample in this paper covers 160 countries: 29 advanced economies, 24 emerging market economies, and 107 developing economies. It spans the period from 1960 to 2013, though data for some variables are less due to update availability.
Real credit per capita is calculated as the end-of-year nominal credit per capita deflated by its corresponding GDP deflator. We use credit to private non-financial sector obtained from the IMF’s International Financial Statistics (IFS) and the BIS’s statistics. Measure of credit is the sum of claims on the private sector by deposit money banks and, whenever available for the entire sample period for a country, the claims on private sector by other financial institutions.
Capital inflows are measured as gross liability flows that include foreign direct investment, portfolio flows, and other investment liabilities, as a percentage of GDP, obtained from IFS. Data on inflation (calculated by GDP deflator), GDP growth, current account balance in percent of GDP, and trade openness (measured by the sum of exports and imports as a percent of GDP) are obtained from World Development Indicators, IFS, IMF’s Balance of Payments Statistics, and UNCTAD’s statistics. Exchange rate regimes are taken, with updated data, from Ilzetzki, Reinhart and Rogoff’s (2008) fine classification, in which higher values correspond to more flexibility in exchange rate regimes.
Domestic financial reforms are measured by Abiad, Detragiache, and Tressel (2008). This index takes values between 0 and 21 and captures changes in several financial policy dimensions such as credit controls and reserve requirements, interest rate controls, entry barriers, state ownership in the banking sector, capital account restrictions, prudent regulations and supervision of the banking sector, and securities market policy. Quality of banking supervision and regulation index is taken from the same source. We measure the
-9-
on inflation and GDP growth. Similarly, fiscal policy stances are calculated as the error terms obtained from a simple regression of general government balance as a percentage of GDP on GDP growth. Data on policy rates and general government balance are obtained from the IFS. We also use data on banking crises from Laeven and Valencia (2012)9.
4. Episodes of Credit Booms: Stylized Facts
4.1. Credit Boom Incidence
Following Mendoza and Terrones (2012), we calculate the incidence, duration and magnitude of credit boom episodes based on our sample of 29 advanced economies, 24 emerging market economies, and 107 developing economies over the 1960-2013 period. In total, we identify 159 episodes of credit boom in our sample. The list of those credit booms and their peak years is in appendix 2.
Table 1: Frequency of Credit Boom Episodes Based on Real Credit Per Capita
(Boom Parameter = 1.65) Advanced Economies Emerging Market Economies Developing Economies Whole Sample Countries Number Percent Number Percent Number Percent Number Full sample periods 45 28.3 26 16.4 88 55.3 159
1990s 8 18.6 10 23.3 25 58.1 43
2000s 15 31.3 7 14.6 26 54.2 48
Source: Authors’ calculations following the methodology of Mendoza and Terrones (2012).
Table 1 shows the frequency of boom episodes across groups of countries. Of 159 credit boom episodes, the most booms (55.3 percent) occur in developing countries, followed by advanced economies (28.3 percent), and emerging market economies (16.4 percent). Across time, more credit booms are found in the 2000s than in the 1990s, specifically in advanced economies. However, the frequency of boom incidence is lower in developing and
emerging market economies.
9
A country is considered to have experienced a systemic banking crisis if its banking system experienced significant signs of financial stress (indicated by significant bank runs, losses, and bank liquidations); and also if significant policy interventions can be observed in response to losses in the banking system. Policy interventions are considered to significant if the following forms of interventions have been used: significant guarantees are put in place, extensive liquidity support (5 percent of deposits and liabilities to
nonresidents), bank restructuring costs (at least 3 percent of GDP), or significant bank nationalizations took place.
-10-
Table 2: Probability of a Boom Occurring in a Country in a Year, Average
Parameter for Boom Start/End: 0.25 Parameter for Boom Start/End: 0.75
Parameter for Boom Episode: 1.65 Parameter for Boom Episode: 1.65
Advanced Economies Emerging Market Economies Developing Economies Whole Sample Countries Advanced Economies Emerging Market Economies Developing Economies Whole Sample Countries
Full sample periods 0.166 0.136 0.102 0.121 0.122 0.102 0.068 0.084
1990s 0.188 0.210 0.117 0.144 0.116 0.169 0.079 0.100
2000s 0.203 0.142 0.110 0.132 0.169 0.113 0.078 0.100
Source: Authors’ calculations.
Note: The beginnings and ends of boom episodes are defined as occurring when the deviation from trend is a certain value of parameter times the standard deviation of the cyclical component.
Table 3: Duration of Credit Boom Episodes, Average
Parameter for Boom Start/End: 0.25 Parameter for Boom Start/End: 0.75
Parameter for Boom Episode: 1.65 Parameter for Boom Episode: 1.65
Advanced Economies Emerging Market Economies Developing Economies Whole Sample Countries Advanced Economies Emerging Market Economies Developing Economies Whole Sample Countries
Full sample periods 4.82 4.96 4.51 4.67 3.51 3.73 2.98 3.25
1990s 6.00 4.60 4.52 4.81 3.50 3.80 2.80 3.16
2000s 4.60 5.14 4.54 4.65 3.71 3.71 3.14 3.39
Note: See note in Table 2
Table 4: Magnitude of Credit Boom Episodes
Deviation of Real Credit per Capita from Trend at Peak
Average Growth Rate of Real Credit per Capita
Average Growth Rate of Credit-to-GDP Ratio Advanced Economies Emerging Market Economies Developing Economies Whole Sample Countries Advanced Economies Emerging Market Economies Developing Economies Whole Sample Countries Advanced Economies Emerging Market Economies Developing Economies Whole Sample Countries Full sample periods 14.7 26.5 32.7 26.6 12.6 17.3 23.3 19.2 10.5 16.0 22.8 18.2 1990s 12.3 34.0 30.5 27.9 13.2 20.2 22.5 19.8 11.3 19.4 24.4 20.3 2000s 18.6 18.1 35.8 27.8 16.5 12.1 26.9 22.3 16.6 10.9 25.9 21.5
-11-
To account for different sample periods across country groups, we calculate the average probability that a country experiences a boom in a year. Table 2 shows that over the whole sample period, developing countries experience the least likelihood of a credit boom. This is true across time, while emerging market economies in the 1990s had the highest
probability of experiencing a boom. The likelihood of experiencing a boom in both developing and emerging market economies decreases over time, in contrast with that in advanced economies.
Table 3 indicates the duration of credit booms. Across all groups, we find that the average duration of credit booms is roughly 5 years10. Booms in developing countries are shorter compared with booms in advanced and emerging market countries. Across time, there is no clear distinguishing feature of boom durations in developing economies. However, the duration of booms is shorter in advanced economies.
If we look at the magnitude of credit booms in Table 4, we see that developing economies experience a greater size of credit booms. For example, at the peak of the booms, the average expansion of real credit per capita reaches more than 30 percent above trend in the developing economies, twice as much as in advanced economies. We further proxy
magnitude of credit booms by using average growth rate of real credit per capita and average growth rate of credit-to-GDP ratio from the start to the peak of booms; the results give the same conclusion. Larger booms in developing countries may result from the fact that level of credit aggregates in those countries are still at a relatively low base.
4.2. Credit Booms and Systemic Banking Crises
Table 5: Credit Booms and Banking Crises
Percent of Credit Booms Associated with Banking Crises
Percent of Banking Crises Associated with Credit Booms
Advanced Economies Emerging Market Economies Developing Economies Whole Sample Countries Advanced Economies Emerging Market Economies Developing Economies Whole Sample Countries
Full sample periods 24.4 42.3 12.5 20.8 50.0 45.8 16.7 29.8
1990s 37.5 70.0 8.0 30.6 60.0 58.3 11.1 26.4
2000s 46.7 28.6 15.4 27.1 50.0 50.0 62.5 53.6
Source: Authors’ calculations.
10 Our results are mainly based on the parameter value of 0.25 for boom start/end. Using a higher parameter
-12-
Table 5 shows an important result regarding the relationship between credit booms and systemic banking crises. Not all credit boom episodes end in a banking crisis. With the whole sample of countries, not more than 20 percent of credit booms are followed by a banking crisis. If we divide countries in groups, we see that credit booms in developing economies are less prone to banking crises, given that only around 12 percent of the booms end in a banking crisis. This implies that most of the booms in developing countries may rather reflect financial deepening than risks of financial crises. However, booms in emerging market economies more often (more than 40 percent) end in banking crises. Classification by time period also gives us interesting findings. A greater percentage of booms in developing countries in the 2000s ends in crisis, relative to the case in the 1990s, giving an important implication that, as developing countries move up to emerging market status, they should be more careful regarding credit boom incidence. Surprisingly, booms in emerging market countries become less prone to banking crises over time, implying more resilience and a greater ability of their economies to handle the situation of booms turning bad, following the lessons from the 1990s. Looking at the advanced countries, the
associated risks of credit booms are more concerning, as almost half of the booms in the past decade are followed by banking crises.
Our results in Table 5 also show that while not many credit booms end in crisis, many crises are preceded by episodes of credit booms, particularly in emerging market countries and advanced economies. Specifically, almost half of the crises in emerging market and advanced economies are preceded by credit booms, with fewer cases in developing
countries. However, if we concentrate on the crises in the last decade, half or more of them follow credit booms. Overall, our results suggest that credit boom episodes have become a major variable behind the financial crises in the past decade.
Table 6 goes further to check whether there are different characteristics identifiable between credit booms ending in banking crises and those that are not. Our descriptive statistics suggest that booms ending in banking crises, on average, last longer, are larger in size, and start at higher levels of credit than those ending softly without a crisis. Even if we classify the data into groups of countries, the results are generally the same for developing, emerging market, and advanced economies. It is thus worth noting that the duration and size of credit booms might help explain and predict the possible consequence of these booms.
-13-
Table 6: Characteristics of Credit Booms Associated with Banking Crises
Booms Ending in Banking Crises Booms Not Ending in Banking Crises
Advanced Economies Emerging Market Economies Developing Economies Whole Sample Countries Advanced Economies Emerging Market Economies Developing Economies Whole Sample Countries Duration 6.3 5.1 5.0 5.4 4.4 4.9 4.4 4.5 Deviation of Real Credit per Capita
from Trend 9.4 20.2 24.7 18.3 9.4 12.1 18.5 15.3 Credit-to-GDP
ratio at the start
of credit booms 147.5 57.7 23.0 74.0 104.3 34.9 22.1 46.1
Source: Authors’ calculations.
5. Econometric Results
5.1. What Are the Determinants of Credit Booms?
In this section, we use the random effect panel probit regression model to study the main factors that trigger credit booms. Table 7 provides the regression results from the entire sample, classified into different groups of countries. The results show that the size of
private sector credit relative to GDP (which to some extent can reflect the size of a financial system) is positively associated with the probability of credit booms. This is generally true across country groups, implying that the more developing and emerging market countries expand their financial systems, the greater the expected likelihood of credit booms. We also find that credit booms may start during or following buoyant economic growth, as we can see some evidence that lagged GDP growth positively increases the probability of credit boom occurrence. At the same time, inflation seems to play a clear role in explaining the booms in developing countries, but not in other groups of countries; which suggests that low inflation will contribute to a higher probability of credit booms in developing countries. Looking at current account balance, we find that an improved current account balance can often be favorable for the occurrence of credit booms across groups of our sample
countries. Overall, our results above suggest that favorable domestic macroeconomic developments will broadly correlate with more incidences of credit booms; and this is specifically true in the case of developing countries.
-14-
Surges in capital inflows, an important factor in triggering credit booms, are in general not statistically significant, except for emerging market economies. However, in sub-samples including additional control variables, none is statistically significant. Similarly, exchange rate arrangements and trade openness, which to an extent capture the countries’ structural characteristics and levels of liberalization, are frequently not statistically significant, indicating their limited importance in explaining the episodes of credit booms across countries in our sample.
Table 7: Determinants of Credit Booms by Groups of Countries
Dependent variable: Dummy = 1 when there is a credit boom Whole Sample Countries Advanced Economies Emerging Market Economies Developing Economies Whole Sample Countries Advanced Economies Emerging Market Economies Developing Economies
Explanatory Variables are Lagged
Credit to GDP 0.0119*** 0.0138*** 0.0233*** 0.0209*** 0.0245*** 0.0493*** 0.0770*** 0.0309** (0.00130) (0.00185) (0.00547) (0.00395) (0.00738) (0.0113) (0.0242) (0.0124) GDP Growth 0.0363*** 0.0638*** 0.0821*** 0.0218** 0.0396 0.110 0.137* -0.0248 (0.00741) (0.0244) (0.0217) (0.00895) (0.0246) (0.0790) (0.0727) (0.0319) Inflation -0.00146 0.00570** -0.000818 -0.00793*** -0.0144* -0.0406 0.000118 -0.0201* (0.00158) (0.00285) (0.00316) (0.00304) (0.00770) (0.0885) (0.00508) (0.0110) Current Account Balance 0.000316*** 0.000867*** 0.000839*** 0.000142*** 0.000355* 0.000836 0.00212*** -0.000372 (4.32e-05) (0.000149) (0.000173) (5.08e-05) (0.000191) (0.000639) (0.000665) (0.000295) Capital Inflows 0.00154 0.00155 0.0283* 0.00166 0.00252 -0.00386 -0.0848 0.0104 (0.00134) (0.00285) (0.0167) (0.00161) (0.00647) (0.00781) (0.0521) (0.0276) Exchange Rate Arrangements -0.00455 0.0267 0.0225 -0.00741 -0.0647*** -0.0967* -0.337*** -0.0111 (0.0112) (0.0212) (0.0327) (0.0164) (0.0243) (0.0533) (0.131) (0.0362) Trade Openness -0.00106 -0.000332 -0.00225 0.00131 -0.00499 -0.00499 -0.00708 0.00412 (0.00126) (0.00181) (0.00505) (0.00198) (0.00389) (0.00634) (0.0186) (0.0104) Monetary Policy Stance -0.00959** -0.195** -0.00400 -0.00337 (0.00483) (0.0945) (0.00737) (0.00517) Fiscal Policy Stance -0.0789*** -0.221*** -0.0530 0.0268
(0.0271) (0.0628) (0.0635) (0.0481)
Financial Reforms 2.266*** 7.425* 0.0149 2.766***
(0.704) (4.220) (1.749) (1.041) Quality of Bank Supervision -0.920*** -1.525*** 0.123 -1.039***
(0.175) (0.499) (0.411) (0.338)
Observations 3,701 803 577 2,321 848 276 228 344
# of Countries 156 29 23 104 68 22 18 28
Note: Panel probits are estimated with random effects. Coefficient estimates refer to marginal effects. Standard errors are in parentheses. ***, **, * signify statistical significance at the 1%, 5%, and 10% levels, respectively.
-15-
Interestingly, looking at the variables reflecting domestic macroeconomic policy stances, the statistical significances in the regression results vary across groups of countries. Theoretically, loose monetary and fiscal policy stances also contribute to a higher probability of credit booms by stimulating domestic aggregate demand and building up asset price booms. In particular, lower policy rates will bring down the cost of borrowing throughout the economy and increase demand for credit. Lower interest rates can also boost asset prices, which then increases their collateral value and thus increases borrowing
ability. Conversely, tighter policies can bring the reverse impact and can be used as policy tools to contain credit booms if the existing booms may have disastrous consequences. However, in our results, we only see such significant evidence in the case of advanced economies, while in developing and emerging market economies, we do not see any statistical significance.
The main reason for the insignificant impacts of macroeconomic policies on credit booms in developing countries may be related to the ineffectiveness of these policies, particularly monetary policies, in stimulating aggregate demand. Mishra, Montiel, and Spilimbergo (2010) confirm that in contrast to advanced economies, the monetary transmission
mechanism in developing countries may be significantly weak and unreliable. Especially, monetary transmission in developing countries is dominated by the bank lending channel, as the absence of well-functioning financial markets and heavy central bank intervention in foreign exchange markets leave limited scope for the functioning of the conventional interest rate channel, asset channel, or exchange rate channel. Unfortunately, the bank lending channel also becomes problematic as a result of institutional deficiencies, structural issues in financial systems (for example, high level of bank concentration or high level of liquidity), and intrinsic instabilities in the domestic macroeconomic environment. Other studies on developing countries across various regions also report a limited effectiveness of monetary policy due to issues of independence and credibility of the central bank, shallow and illiquid financial markets, fiscal dominance, and exchange rate inflexibility; see, for example, Christensen, (2011); Anzuini and Levy (2007); and Egert and Macdonald (2009). Our finding on the limited role of fiscal policy in developing countries is also supported by Ilzetzki, Mendoza, and Vegh (2013), who stress that the degree of development of an economy is a critical determinant of the size of its fiscal multiplier effects. They find that an increase in government spending has a negative impact on output and is not statistically significant in the case of developing countries, whereas in contrast, the impact is positive and statistically significant in industrial countries. Apart from that, Tornell and Lane (1999), Kaminsky, Reinhart, and Végh (2004), and IMF (2008) find evidence that fiscal policy has been procyclical in developing countries, which commonly results from
-16-
particular underlying fundamental challenges11. The procyclical nature of fiscal policy in those countries may thus give limited scope for fiscal policy to curb possible credit booms, especially under tranquil macroeconomic conditions.
Looking at financial policies, another potential driver of credit booms is financial reforms. Financial reforms generally aim to promote financial deepening and development, which are then supposed to sharply boost available amounts of credit. Our paper finds such a positive association in both advanced and developing countries, suggesting that financial reforms spur high credit growth. This variable, however, is not statistically significant for the emerging market countries in our sample, though the sign of coefficient points in the right direction. On the other hand, we find statistically significant and negative
relationships for the variable capturing the quality of banking supervision and prudential regulations in both advanced and developing countries. This suggests that credit booms are more likely to occur in countries with weak supervision and regulations. From a policy perspective, improving supervision and regulations can help reduce the likelihood of credit booms.
The findings above also imply that in the context of developing countries, while the
effectiveness of macroeconomic policies is questionable, regulatory and prudential policies should be placed in the front line to deal with credit booms if it appears that these booms will likely cause undesirable consequences. More targeted and direct approaches, like macroprudential and microprudential regulations and supervision, can be more effective and incur substantially lower costs, compared with monetary and fiscal policies.
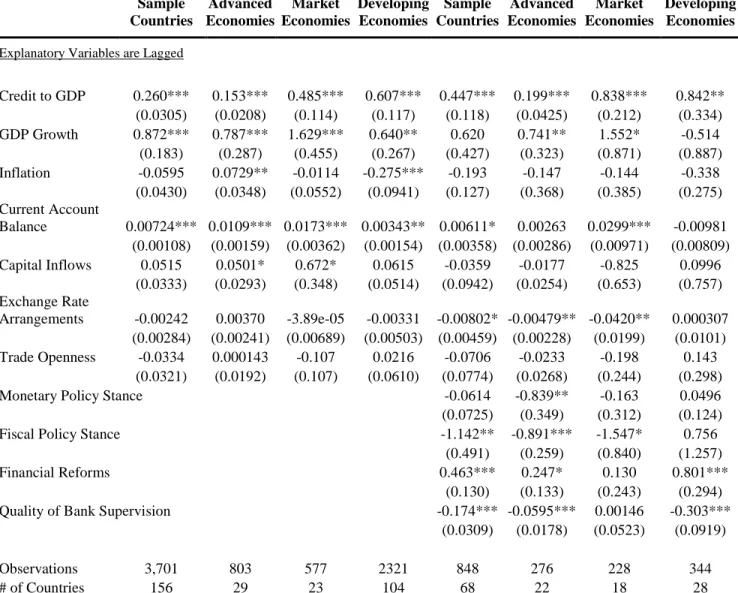
Table 8 provides the panel tobit regression results explaining which factors potentially influence the magnitude of credit booms. Our tobit regressions, in many cases, show similar results and confirm the same identified factors in determining not only the incidence, but also the magnitude of credit booms. For instance, expansion of financial system and favorable macroeconomic developments have a positive association with the size of credit booms, but we find less evidence with surges in capital inflows, exchange rate regimes, and trade openness. Again, we do not find any significant relationship between monetary and fiscal policies and credit booms in developing countries, unlike the case of developed countries. On the other hand, financial policies such as financial reforms and improving the quality of banking supervision and regulations are more strongly linked to credit booms
11 There are at least two main challenges, including (1) political economy biases that contribute to
overspending when revenues are abundant in good times, and (2) the inability of developing countries to access external finance to pay for fiscal expansion during downturns.
-17-
both in developed and developing countries. Overall, our tobit results provide robust support for our previous findings.
Table 8: Determinants of the Magnitude of Credit Booms
Dependent variable is deviation of real credit per capita from trend during the boom periods Whole Sample Countries Advanced Economies Emerging Market Economies Developing Economies Whole Sample Countries Advanced Economies Emerging Market Economies Developing Economies
Explanatory Variables are Lagged
Credit to GDP 0.260*** 0.153*** 0.485*** 0.607*** 0.447*** 0.199*** 0.838*** 0.842** (0.0305) (0.0208) (0.114) (0.117) (0.118) (0.0425) (0.212) (0.334) GDP Growth 0.872*** 0.787*** 1.629*** 0.640** 0.620 0.741** 1.552* -0.514 (0.183) (0.287) (0.455) (0.267) (0.427) (0.323) (0.871) (0.887) Inflation -0.0595 0.0729** -0.0114 -0.275*** -0.193 -0.147 -0.144 -0.338 (0.0430) (0.0348) (0.0552) (0.0941) (0.127) (0.368) (0.385) (0.275) Current Account Balance 0.00724*** 0.0109*** 0.0173*** 0.00343** 0.00611* 0.00263 0.0299*** -0.00981 (0.00108) (0.00159) (0.00362) (0.00154) (0.00358) (0.00286) (0.00971) (0.00809) Capital Inflows 0.0515 0.0501* 0.672* 0.0615 -0.0359 -0.0177 -0.825 0.0996 (0.0333) (0.0293) (0.348) (0.0514) (0.0942) (0.0254) (0.653) (0.757) Exchange Rate Arrangements -0.00242 0.00370 -3.89e-05 -0.00331 -0.00802* -0.00479** -0.0420** 0.000307 (0.00284) (0.00241) (0.00689) (0.00503) (0.00459) (0.00228) (0.0199) (0.0101) Trade Openness -0.0334 0.000143 -0.107 0.0216 -0.0706 -0.0233 -0.198 0.143 (0.0321) (0.0192) (0.107) (0.0610) (0.0774) (0.0268) (0.244) (0.298)
Monetary Policy Stance -0.0614 -0.839** -0.163 0.0496
(0.0725) (0.349) (0.312) (0.124)
Fiscal Policy Stance -1.142** -0.891*** -1.547* 0.756
(0.491) (0.259) (0.840) (1.257)
Financial Reforms 0.463*** 0.247* 0.130 0.801***
(0.130) (0.133) (0.243) (0.294) Quality of Bank Supervision -0.174*** -0.0595*** 0.00146 -0.303***
(0.0309) (0.0178) (0.0523) (0.0919)
Observations 3,701 803 577 2321 848 276 228 344
# of Countries 156 29 23 104 68 22 18 28
Note: Panel tobits are estimated with random effects. Coefficient estimates refer to marginal effects. Standard errors are in parentheses. ***, **, * signify statistical significance at the 1%, 5%, and 10% levels, respectively.
-18-
5.2. What Are the Determinants of “Bad” Credit Booms?
Stylized facts have shown us that not all credit booms end in banking crises and not all banking crises are preceded by episodes of credit booms. In this context, for policy makers, it creates a trade-off. Constraining rapid credit growth to prevent banking crises will
obstruct the process of financial deepening and undermine economic development needs, which can overall create substantial costs for developing countries. However, credit booms might also build up financial imbalances and jeopardize financial stability and development as a whole. Therefore, a very important policy question arises: whether we can mitigate this trade-off by distinguishing ahead of time between credit booms ending in crises (“bad” booms) and ones ending smoothly (“good” booms).
Results from probit regressions in Table 9 provide some answers to this question12. We find that both duration and magnitude of credit booms are positively associated with “bad” booms with statistically significant coefficients. The longer and bigger a credit boom episode is, the more likely it is to end in a banking crisis. The level of credit aggregates also matters in identifying whether or not the booms are bad. This suggests that rapid credit growth from a low base reflects more of financial deepening than financial instability. This is particularly applicable in developing countries where credit aggregates are generally still at low levels. However, as the size of their financial sector grows, particularly above the level consistent with macroeconomic fundamentals, more attention should be placed on consequence of credit booms.
If we look at macroeconomic variables, we find less clear evidence that these variables help distinguish “bad” booms from “good” ones. To some extent, our results suggest that credit booms in high inflation environments are more likely to end in disaster. Also, we do not witness any significant role of macroeconomic and financial policies in identifying the “bad” or “good” booms, except for the quality of banking supervision and regulations. This suggests that improved quality of banking supervision and prudential regulations clearly help reduce the incidence of credit booms turning into financial crises.
Country group dummies are only statistically significant and positive for emerging market countries, implying that credit booms in emerging market countries are more likely to end
12
Given the cross-sectional nature of the variable Duration, we collapse our panel data into cross-sectional form and estimate probit models, where the dependent variable takes value of 1 if a credit boom episode is followed within two years by a banking crisis episode and 0 if the credit boom ends softly without a crisis. Each observation reflects the mean value of all variables except Duration over each boom period.
-19-
in a banking crisis when compared with advanced economies. However, we do not find such difference for the developing countries.
Table 9: Determinants of “Bad” Credit Booms
Dependent variable: Dummy = 1 when there is a credit boom
(1) (2) (3) (4) (5) Boom Duration 0.0712*** 0.0640*** 0.0640*** 0.0934** 0.103** (0.0201) (0.0195) (0.0243) (0.0414) (0.0527) Boom Magnitude 0.00584** 0.00933*** 0.00993*** 0.0115* 0.0371*** (0.00297) (0.00316) (0.00344) (0.00629) (0.0141) Credit to GDP 0.00575*** 0.00863*** 0.0120*** (0.00118) (0.00232) (0.00290) GDP Growth -0.0177 -0.0205 -0.00453 (0.0113) (0.0205) (0.0238) Inflation 0.00291*** 0.0178* 0.00462 (0.00104) (0.0108) (0.00286) Current Account Balance 6.87e-05 0.000160 8.65e-05 (6.04e-05) (0.000102) (0.000165)
Capital Inflows -0.00368 -0.00576 -0.0152
(0.00275) (0.00459) (0.0131)
Trade Openness -0.00323 -0.00153 -0.00782
(0.00316) (0.00143) (0.00639)
Monetary Policy Stance -0.0113
(0.00787)
Fiscal Policy Stance -0.000265
(0.0152)
Financial Reforms 0.383
(0.408)
Quality of Bank Supervision -0.187*
(0.110) Emerging Market Country
Dummy 0.0768 0.547* 0.667** 1.013* (0.0864) (0.299) (0.306) (0.558) Developing Country Dummy -0.199** 0.521 0.690 1.310 (0. 776) (0.543) (0.535) (0.969) Observations 159 159 143 75 71
Notes: Coefficient estimates refer to marginal effects. Standard errors are in parentheses. ***, **, * signify statistical significance at the 1%, 5%, and 10% levels, respectively.
-20-
Overall, our findings suggest that it is very hard to predict “bad” or “good” booms based on macroeconomic and policy variables. However, the duration and magnitude of the booms, as well as the level of credit aggregates, have important implications for the consequences of these booms. At the same time, enhancing the quality of banking supervision and regulations can help reduce the incidence of “bad” credit booms.
6. Conclusions and Policy Implications
Previous studies on credit boom episodes have provided analysis of the experiences of advanced and emerging market countries. However, to what degree are these findings relevant for developing countries, given that we all know there are different characteristics across groups of countries? This study further classifies countries into groups from a large data sample and focuses on credit booms in developing economies, with a comparison with those in advanced and emerging market economies.
Our analysis finds that developing countries are less likely to experience episodes of credit booms, compared with emerging and advanced economies. In the case of booms, the duration is also relatively shorter, but with greater magnitude. This is intuitive if we consider more financial and economic fluctuations that developing countries have always experienced at their relatively low base of financial development. Credit booms in
developing countries are less associated with systemic banking crises, implying that rapid credit growth in these countries is more reflective of financial deepening than of a buildup of financial risks. Therefore, for developing countries, preventing credit booms may come with a substantial cost of scarifying benefits from possible financial deepening. However, as developing countries grow, episodes of credit booms can be an increasing concern. From probit and tobit regression results, there is some evidence that size of financial system and favorable macroeconomic conditions are among the drivers of credit booms; this is true across groups of countries. However, the link between macroeconomic policies, namely monetary and fiscal policies, and episodes of credit booms is not evident in developing countries, in contrast to what we witness in advanced economies. This also suggests that the effectiveness of monetary and fiscal policies in developing countries is questionable in containing credit booms or ensuring that the booms are healthy.
On the other hand, financial policies are significantly associated with credit booms; this is evident for both developed and developing countries. Our findings suggest that for
-21-
developing countries to deal with unhealthy credit booms, financial policies should be placed in the front line. Particularly, prudential supervision and regulations can be more effective and incur substantially lower costs, compared with monetary and fiscal policies. Although certain macroeconomic and policy variables can explain the incidence of credit booms, we find that it is difficult to distinguish in advance between “bad” and “good” credit booms from these variables. However, longer and larger credit booms tend to be strongly associated with financial disasters. The likelihood of “bad” credit booms can be exacerbated when the level of credit to the private sector is large, after controlling
macroeconomic variables. Therefore, credit booms can be more dangerous when financial deepening is at levels above macroeconomic fundamentals.
References
Abiad, A., Detragiache, E., & Tressel, T. (2008). A new database of financial reforms (No. 2008-2266).International Monetary Fund.
Anzuini, A., & Levy, A. (2007). Monetary policy shocks in the new EU members: A VAR approach. Applied Economics, 39(9), 1147-1161.
Arena, M., Bouza, S., Dabla-Norris, M. E., Gerling, M. K., & Njie, L. (2015). Credit Booms and Macroeconomic Dynamics: Stylized Facts and Lessons for Low-Income Countries (IMF Working Paper 15/11). International Monetary Fund.
Backé, P., & Égert, B. (2006). Credit growth in central and eastern Europe: new (over) shooting stars? Focus on European Economic Integration, (1), 112-139.
Bakker, M. B. B., Dell'Ariccia, M. G., Laeven, M. L., Vandenbussche, J., Igan, D., & Tong, H. (2012). Policies for macrofinancial stability: How to deal with credit booms (IMF Staff Discussion Note 12/06). International Monetary Fund.
Barajas, A., Dell’Ariccia, G., & Levchenko, A. (2007). Credit booms: The good, the bad, and the ugly. unpublished: International Monetary Fund.
Borio, C. E., & Lowe, P. W. (2002). Asset prices, financial and monetary stability: exploring the nexus (BIS Working Paper No 114). Bank for International Settlements. Calderon, C., & Kubota, M. (2012). Gross inflows gone wild: gross capital inflows, credit
booms and crises. World Bank Policy Research Working Paper, (6270).
Calvo-Gonzalez, O., & Kozluk, T. (2006). Is Lending in Central and Eastern Europe Developing Too Fast? Chapters.
-22-
Caprio, G., & Klingebiel, D. (1996, April). Bank insolvency: bad luck, bad policy, or bad banking?.In Annual World Bank conference on development economics (Vol. 79). Washington, DC, World Bank.
Christensen, B. V. (2011). Have monetary transmission mechanisms in Africa changed? CH-4002 Basel, Switzerland, 37.
Cottarelli, C., Dell’Ariccia, G., & Vladkova-Hollar, I. (2005). Early birds, late risers, and sleeping beauties: Bank credit growth to the private sector in Central and Eastern Europe and in the Balkans. Journal of Banking & Finance, 29(1), 83-104.
Égert, B., Backé, P., & Zumer, T. (2007). Private-Sector Credit in Central and Eastern Europe: New (Over) Shooting Stars? Comparative Economic Studies, 49(2), 201-231. Égert, B., & MacDonald, R. (2009). Monetary transmission mechanism in Central and
Eastern Europe: Surveying the surveyable. Journal of Economic Surveys, 23(2), 277-327.
Elekdag, S., & Wu, Y. (2013). Rapid Credit Growth in Emerging Markets: Boon or Boom-Bust? Emerging Markets Finance and Trade, 49(5), 45-62.
Gourinchas, P. O., Valdes, R., & Landerretche, O. (2001). Lending booms: Latin America and the world (No. w8249). National Bureau of Economic Research.
Hansen, N. J. H., & Sulla, M. O. (2013). Credit Growth in Latin America: Financial Development or Credit Boom? (IMF Working Paper 13/106). International Monetary Fund.
Ilzetzki, E., Mendoza, E. G., & Végh, C. A. (2013). How big (small?) are fiscal multipliers?
Journal of Monetary Economics, 60(2), 239-254.
Ilzetzki, E., Reinhart, C., & Rogoff, K. (2008). The country chronologies and background material to exchange rate arrangements in the 21st century: which anchor will hold.
International Monetary Fund (2008). "World Economic Outlook". Chapter 5. International Monetary Fund (2011). "World Economic Outlook". Chapter 1.
Kaminsky, G. L., Reinhart, C. M., & Végh, C. A. (2005). When it rains, it pours: procyclical capital flows and macroeconomic policies. In NBER Macroeconomics Annual 2004, Volume 19 (pp. 11-82). MIT Press.
Kiss, G., Nagy, M., & Vonnák, B. (2006). Credit growth in Central and Eastern Europe: convergence or boom? (No. 2006/10). MNB working papers.
Laeven, L., & Valencia, F. (2012). Systemic banking crises database: An update.
Lane, P., & Tornell, A. (1999). The voracity effect. American Economic Review, 89(1), 22-46.
Levine, R. (2005). Finance and growth: theory and evidence. Handbook of economic growth, 1, 865-934.
Mendoza, E. G., & Terrones, M. E. (2008). An anatomy of credit booms: evidence from macro aggregates and micro data (No. w14049). National Bureau of Economic Research.
-23-
Mendoza, E. G., & Terrones, M. E. (2012). An anatomy of credit booms and their demise (No. w18379).National Bureau of Economic Research.
Mishra, P., Montiel, P. J., & Spilimbergo, A. (2012). Monetary transmission in low-income countries: Effectiveness and policy implications. IMF Economic Review, 60(2), 270-302. Tornell, A., & Westermann, F. (2002). Boom-bust cycles in middle income countries: Facts
-24-
Appendix 1: Sample of Economies
29 Advanced Economies 24 Emerging Market Economies 107 Developing Economies
Australia Brazil Albania Eritrea Panama
Austria Chile Algeria Ethiopia Papua New Guinea
Belgium China Angola Fiji Paraguay
Canada Colombia Antigua and Barbuda Gabon Romania Cyprus Czech Republic Argentina Gambia, The Rwanda
Denmark Egypt Armenia Georgia Samoa
Estonia Greece Aruba Ghana Senegal
Finland Hungary Azerbaijan Grenada Seychelles
France India Bahamas, The Guatemala Sierra Leone
Germany Indonesia Bahrain Guinea-Bissau Solomon Islands
Hong Kong Korea, Rep. Bangladesh Guyana Sri Lanka
Iceland Malaysia Barbados Haiti St. Kitts and Nevis
Ireland Mexico Belarus Honduras St. Lucia
Israel Morocco Belize Iran, Islamic Rep. St. Vincent and the Gren.
Italy Pakistan Benin Jamaica Sudan
Japan Peru Bhutan Jordan Suriname
Malta Philippines Bolivia Kazakhstan Swaziland
Netherlands Poland Bosnia and Herzegovina Kenya Syrian Arab Republic
New Zealand Russia Botswana Kuwait Tajikistan
Norway Saudi Arabia Bulgaria Kyrgyz Republic Tanzania Portugal South Africa Burkina Faso Lao PDR Togo
Singapore Thailand Burundi Latvia Tonga
Slovak Republic Turkey Cabo Verde Lebanon Trinidad and Tobago
Slovenia U.E.A Cambodia Lesotho Tunisia
Spain Cameroon Macedonia, FYR Uganda
Sweden Central African Republic Madagascar Uruguay
Switzerland Chad Malawi Vanuatu
United Kingdom Comoros Maldives Venezuela, RB
United States Congo, Rep. Mali Vietnam
Costa Rica Mauritius Yemen, Rep. Cote d'Ivoire Moldova Zambia
Croatia Mongolia
Djibouti Namibia
Dominica Nepal
Dominican Republic Nicaragua
Ecuador Niger
El Salvador Nigeria Equatorial Guinea Oman
Note: Among advanced economies, Korea and Czech Republic are typically considered as emerging markets, because they still share many macroeconomic features with other emerging economies. Greece was reclassified from being a developed market to emerging market status in November 2013 by MSCI Index.
-25-
Appendix 2: List of Credit Boom Episodes and Peak Years
29 Advanced Economies 24 Emerging Market Economies 107 Developing Economies
Australia 1988 Chile 1982 Albania 2008 Madagascar 1971 Australia 2008 China 1986 Angola 2009 Madagascar 1993 Austria 1980 Colombia 1997 Bahrain 1999 Madagascar 2008
Austria 2000 Egypt 1986 Bangladesh 1984 Malawi 1992
Belgium 1979 Greece 1972 Barbados 1972 Maldives 2008
Canada 1981 Greece 2008 Barbados 1989 Mali 1975
Cyprus 1999 India 2008 Belarus 2010 Moldova 2007
Denmark 1987 Indonesia 1997 Belize 1982 Namibia 1995
Denmark 2007 Korea, Rep. 1969 Belize 1991 Nepal 1981
Estonia 2007 Korea, Rep. 1997 Bhutan 1994 Nepal 2009
Finland 1992 Malaysia 1997 Botswana 1976 Nicaragua 2000
France 1973 Mexico 1992 Botswana 1992 Niger 1979
France 1990 Morocco 1997 Bulgaria 1996 Nigeria 2009
Germany 2000 Pakistan 1966 Burkina Faso 1977 Oman 1977 Hong Kong 1982 Pakistan 2008 Burkina Faso 1990 Oman 1998
Hong Kong 1990 Peru 1998 Burundi 1974 Panama 1974
Hong Kong 1997 Philippines 1983 Burundi 1981 Panama 2001 Iceland 2006 Philippines 1997 Cabo Verde 1999 Papua New Guinea 2009
Ireland 1999 Russia 2008 Cambodia 1997 Romania 2008
Ireland 2008 Saudi Arabia 2009 Cambodia 2008 Samoa 1990 Israel 1979 South Africa 1985 Central African Rep 2012 Sierra Leone 2009 Israel 1984 South Africa 2008 Chad 1987 Solomon Islands 2008
Italy 1973 Thailand 1997 Comoros 1992 Sri Lanka 1995
Italy 1992 Turkey 1997 Comoros 2010 St. Lucia 2008
Japan 1973 U.A.E 1978 Congo, Rep. 1986 St. Vincent and the Gren. 1981 Japan 1992 U.A.E 2009 Congo, Rep. 1999 St. Vincent and the Gren. 1999
Malta 2007 Costa Rica 1979 Sudan 2006
Netherlands 1979 Costa Rica 2008 Swaziland 1981
Netherlands 2000 Dominican Rep. 2003 Swaziland 1991
Norway 1987 Ecuador 1994 Syrian Arab Republic 1966
Portugal 1973 Eritrea 1998 Togo 1978
Portugal 1983 Gabon 1963 Tonga 1981
Singapore 1973 Gabon 1986 Trinidad and Tobago 1972
Singapore 1983 Georgia 2007 Tunisia 1985
Singapore 1997 Ghana 1989 Uruguay 1965
Spain 2007 Grenada 1999 Uruguay 1982
Sweden 1990 Guatemala 1984 Uruguay 2002
Sweden 2008 Guyana 1988 Vanuatu 2009
Switzerland 1980 Honduras 1999 Venezuela, RB 2007
Switzerland 1990 Honduras 2007 Vietnam 2010
United Kingdom 1973 Jordan 2007 Zambia 1975
United Kingdom 1990 Kazakhstan 2007 Zambia 1982
United Kingdom 2008 Kyrgyz Republic 2007 Zambia 1996
United States 1988 Lesotho 1997