Fatigue Lifetime Design Method and Program
Development of Pantograph V500 Based on
Reliability
Dongli SongState Key Laboratory of Traction Power,Southwest Jiaotong University,Chengdu, China [email protected]
Weihua Zhang
State Key Laboratory of Traction Power,Southwest Jiaotong University,Chengdu, China [email protected]
Ning Zhou
State Key Laboratory of Traction Power,Southwest Jiaotong University,Chengdu, China [email protected]
Guiming Mei
State Key Laboratory of Traction Power,Southwest Jiaotong University,Chengdu, China [email protected]
Abstract—Reliability analysis of fatigue lifetime design has two assignments: a. To forecast fatigue lifetime of the structure on given reliability level, b. To evaluate reliability level of the structure on given service conditions, material features and designing dimensions. It aims at evaluating the structure’s designing quality and providing a basis for designing improvement or manufacturing. At mean time, it provides instruction to updating management by parameter of failure rate under given fatigue lifetime.Lastly, this paper presents rain-flow program, lifetime-forcast program and reliability-forcast program, predicting the results of fatigue lifetime of pantograph V500 based on different reliability levels at 500km/h and the results of reliability level of Pantograph V500 under lifetime of 1,200,000km which provide direction of design, manufacturing and general management for Pantograph V500.
Index Terms—Fatigue lifetime, Reliability, Pantograph V500
I. INTRODUCTION
The pantograph of high-speed train is subjected to a complicated dynamic loading process. The contact force in pantograph-catenary system oscillates inspired by the non-smooth catenary and track[1,3], and it is a random variable.
The material characters of pantograph V500 is effected
by many factors such as size,enviroment and temperature[4,5] and they are random variables.
Therefore, fatigue lifetime of pantograph V500 are determined by reliability method. this paper presents the predicting results of fatigue lifetime of pantograph V500 , and the predicting results of reliability level of Pantograph V500 under lifetime of 1,200,000km.
II. PROBABLISTIC FATIGUE FEATURE OF PANTOGRAPH
P-S-N Curve of probablistic fatigue is important basis for analysis of fatigue reliability design. Alloy steel 410 and Aluminum alloy 6061 are materials for key parts of Pantograph and their P-S-N Curves.
A. P-S-N Curve at short or middle lifetime stage
Referring to Regulation TB/T1335-199 and based on Equation Basquin[6]. The two materials’ mean will be got by looking up the material manual. Set 0.08 of the mean as variance when there is lack of distributed data. The material’s P-S-N Curve is indicated as:
(lg )N p = Ap+BplgS (1) In which,
( ,A A) (36.1736, 2.893888)
A∼ N u σ ∼ N
( ,B B) (-11.349, 0.90792)
B∼ N u σ ∼ N
p A p A
A =u − ⋅z σ ,Bp =uB− ⋅zp σB.
Table 1 presents P-S-N Curve parameters of alloy steel at preliminary stage, table2 presents P-S-N Curve parameters of aluminum alloy at preliminary stage; S4 stands for stress of lifetime 10000 times circulation, S5-6 stands for stress of lifetime 5000000 times circulation. Manuscript received March 1, 2011; revised April 1, 2011; accepted
May 15, 2011.
TABLE I.
TABLE 1P-S-NCURVE PARAMETERS OF ALLOY STEEL AT PRELIMINARY
STAGE
P A B S4 S5-6
0.5 36.1736 -11.349 683.7592 395.4482
0.9 34.12312 -10.644 676.0683 377.0762
0.99 32.45144 -10.07 669.0777 360.9486
0.999 31.22923 -9.6495 663.4925 348.4454
0.9999 30.22317 -9.3036 658.5559 337.6715
TABLE II. P-S-NCURVE PARAMETERS OF ALUMINUM ALLOY AT PRELIMINARY STAGE
P A B S4 S5-6
0.5 27.52429 -10.8323 105.4723 148.4841
0.9 25.6371 -10.1018 74.94202 138.6443
0.99 24.09855 -9.50628 67.65886 130.0885
0.999 22.97367 -9.07087 62.25472 123.5137
0.9999 22.04773 -8.71246 57.77001 117.8922
B. long-lifetime P-S-N Curve
Because, under normal operating conditions,the structure functions under random stress amplitude generally, it still will have fatigue crack initiation and growth to make fatigue damage even the stress amplitude is under “fatigue limitation”. So S-N Curve of probablistic fatigue at range of long lifetime is needed for analysis of fatigue reliability. According to criterion of European ECCS and Sweden BSK, extrapolate S-N Curve by index method 2m-1 after N≥5*106cycles.
Index method 2m-1 refers to, beginning with N=5*106cycles, turning index m 2m-1 of S-N Curve at
preliminary stage into smoothed extrapolation for long-lifetime S-N Curve[6].
1) Fatigue intensity of turning point: According to basic
datas uA,σA,uB,σB of S-N Curve at preliminary stage to get
fatigue intensity of turning point
6 [lg(5 10 ) ] / 10 uA uB
t
S = × − (2)
2) Parameter of probablistic curve:Confirm basic
parameter of probablistic curve at range of long-lifetime based on equations (3) as follows
2 1
F B
u = ⋅ −u ,uE =uA−(uB − ⋅1) lgSt
2 2 2 1/ 2
[ (lg ) ]
E A B St
σ
=σ
+σ
⋅ ,2 4 2
F B
σ
= ⋅σ
(3) 3) Extrapolated P-S-N equation:It is defined in equation (4):(lg )N p =Ep +FplgS (4)
in which
p E p E
E
=
u
− ⋅
z
σ
,F
p=
u
F− ⋅
z
pσ
F.Table 3 presents extrapolated P-S-N Curve parameters of alloy steel, table 4 presents extrapolated P-S-N Curve parameters of aluminum alloy. S8 stands for stress of
lifetime 100000000 times circulation, S5-6 stands for
stress of lifetime 5000000 times circulation.
TABLE III. EXTRAPOLATED P-S-NCURVE PARAMETERS OF ALLOY
STEEL (INDEX METHOD 2M-1)
P E F S5-6 S8
0.5 68.24532 -23.698 395.4482 348.4895
0.9 64.1237 -22.288 377.0765 329.6531
0.99 60.7614 -21.139 360.9518 313.2588
0.999 58.3016 -20.299 348.449 300.6392
0.9999 56.2759 -19.607 337.6708 289.8272
TABLE IV. EXTRAPOLATED P-S-NCURVE PARAMETERS OF
ALUMINUM ALLOY (INDEX METHOD 2M-1)
P E F S5-6 S8
0.5 52.55199 -22.665 105.4658 92.40771
0.9 48.89063 -21.204 97.68591 84.81508
0.99 45.90243 -20.013 90.97929 78.33068
0.999 43.7151 -19.142 85.86013 73.42151
0.9999 41.91272 -18.425 81.50841 69.27713
III. EQUIVALENT STRESS FEATURE OF PANTOGRAPH V500
A. Finite element analysis
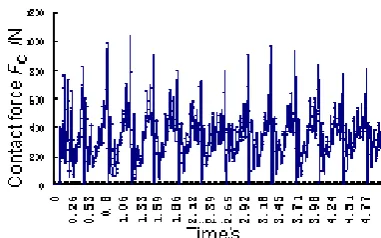
Loads on pantograph V500 is shown in Figure.1, which are Fc,Fair, Fc is contact force, it is shown is Figure.2, Fair is air resistance, it is shown in Figure.3. And the boundary condition is that baseframe is fixed.
Figure.1 Loads on Pantograph V500
Figure.3 Air Resistance on Pantograph
By finite element analysis, stress-time of pantograph V500 is shown in Figure 4.
下臂杆应力时间历程 0 10 20 30 40 50 60 5.00 E-0 3 2.50 E-02 4.50 E-0 2 6.50E -02 8.50
E-020.1050.1250.14 5
0.1650.18 5
0.2050.2 25
0.24 5
0.2650.28 5 0.30
5 0.3250.34
5 时间 应力 上臂杆应力时间历程 0 5 10 15 20 25 30 35 40 45 50 5.00 E-03 2.50 E-02 4.50 E-02 6.50 E-02 8.50 E-020.10
5 0.12
5 0.14
5 0.1650.18
5 0.20 5 0.22 5 0.24 5 0.26 5 0.28 5 0.30 5 0.32 5 0.34 5 时间 应力 平衡臂应力时间历程 0 2 4 6 8 10 12 5 .00 E-03 2 .00 E-02 3 .50 E-02 5 .00 E-02 6 .50 E-02 8 .00 E-02 9 .50
E-02 0.11 0.125 0.14 0.155 0.17 0.185 0.2 0.215 0.23 0.245 0.26 0.275 0.29 0.305 0.32 0.335 0.35
时间 应力 底架应力时间历程 0 50 100 150 200 250 5. 00E-03 2. 50E-02 4. 50E-02 6. 50E-02 8. 50E-02 0.1 05 0.1 25 0.1 45 0.1 65 0.1 85 0.2 05 0.2 25 0.2 45 0.2 65 0.2 85 0.3 05 0.3 25 0.3 45 时间 应力 拉杆应力时间历程 0 5 10 15 20 25 5.0 0E-03 2.5 0E-02 4.5 0E-02 6.5 0E-02 8.5
0E-02 0.105 0.125 0.145 0.165 0.185 0.205 0.225 0.245 0.265 0.285 0.305 0.325 0.345
时间 应力 平衡杆应力时间历程 0.00E+00 1.00E-01 2.00E-01 3.00E-01 4.00E-01 5.00E-01 6.00E-01 5.00 E-03 2.50 E-02 4.50 E-02 6.50 E-02 8.50 E-020.1050.12
5 0.1450.16
5
0.1850.2050.2250.2450.2650.2850.30 5
0.3250.34 5 时间 应力 弓头托架应力时间历程 0 2 4 6 8 10 12 5.00E-0 3 2.00E-0 2 3.50E-0 2 5.00E-0 2 6.50E-0 2 8.00E-0 2 9.50E-0 2 0.11 0.12 5 0.14 0.15 5 0.17 0.18 5 0. 2 0.21 5 0.23 0.24 5 0.26 0.27 5 0.29 0.30 5 0.32 0.33 5 0.35 时间 应力
Figure.4 Stress-time of Pantograph V500 Running One Span
B. Rain flow method
The flowchart of rain-flow and Goodman correction programs is shown in figure 5.
The operating windows of rain-flow program is shown in figure 6.
Discrete stresss-time into a series peak values, and then gather statistic of the peak value, amplitude and mean value or the frequency through a certain load level to get the dissymmetrical fatigue stress table on condition of running 1,200,000km ,as Table5.
Figure 5. Flowchart of rain-flow program
Stress-time of Lower arm
Stress-time of Upper arm
Stress-time of Balance arm time time time stress stress stress
Stress-time of Baseframe
time stress
Stress-time of Drag rod
time stress
Stress-time of Balance rod
time stress
Stress-time of Pantograph head
Figure 6. Windows of rain-flow program
TABLE V. DISSYMMETRICAL FATIGUE STRESS SPECTRUM FOR PANTOGRAPH V500 RUNNING 1,200,000KM Stress
Mean
σ
amiDissymmetri cal stress ampletude
ai
σ
Recurri ng count
i
n
Stress
Mean
σ
amiDissymmetric al stress ampletude
ai
σ
Recurring
count
n
iStress Mean
ami
σ
Dissymme trical stress ampletude
ai
σ
Recurring
count
n
iBase Frame Balance Rod Pantograph Head
102.415 184.89 1.2e8 0.210105 0.02515 2.4e8 5.07735 0.8057 2.4e8
119.174 151.372 1.2e8 0.09545 0.0017 2.4e8 3.11365 0.9889 2.4e8
80.889 74.802 1.2e8 0.12633 0.07066 1.2e8 3.3209 0.0316 2.4e8
下臂杆 0.11158 0.10016 1.2e8 3.32065 0.6847 2.4e8
28.603 55.456 1.2e8 0.275375 0.42775 1.2e8 2.655 0.0114 2.4e8
31.8703 48.9213 1.2e8 0.282675 0.41315 1.2e8 2.6446 0.0774 2.4e8
22.1523 29.4853 1.2e8 0.16546 0.17872 1.2e8 3.88375 0.0397 2.4e8
Drag Bar Balance Arm 2.94875 0.0611 2.4e8
5.51495 0.3811 2.4e8 1.5183 0.7698 1.2e8 5.46885 0.0872998 2.4e8
12.0234 22.0592 1.2e8 1.19517 1.41607 1.2e8 2.66555 0.2027 2.4e8
14.5327 17.0405 1.2e8 5.62607 10.2779 1.2e8 3.37485 1.1465 2.4e8
10.6377 9.2505 1.2e8 6.6073 8.3154 1.2e8 5.49185 0.1917 2.4e8
Upper Arm 6.09225 7.2853 1.2e8 3.32215 1.6043 2.4e8
1.20772 1.38437 1.2e8 9.69775 0.0743008 1.2e8 4.9282 1.8884 2.4e8
1.19333 1.41315 1.2e8 2.7836 0.2578 1.2e8
22.1274 43.2813 1.2e8 4.33305 3.3567 1.2e8
24.2757 38.9846 1.2e8 4.21735 3.5881 1.2e8
16.5947 23.6226 1.2e8 6.71165 8.5767 1.2e8
7.3337 7.3326 1.2e8
4.91035 2.4859 1.2e8
C. Goodman Correction
S-N Curve is to express the regular pattern of symmetrical circulation stress. As for dissymmetrical circulation stress, the impact of failure by dissymmetrical coefficient r to fatigue should be considered. To get different fatigue limitation value under value r, dissymmetrical stress ampletude should be corrected into
symmetrical stress ampletude by Goodman Correction. Equation below can convert dissymmetrical stress ampletude into symmetrical stress ampletude[6]:
Goodman Average Stress Correction Equation(5)
1
1
/
ai ai
ami S
σ
σ
σ
σ
−
=
−
(
σ
ai, ,
n i
i=
1, 2, ,
n
L)。 (5)ampletude, σm is stress mean value;σb is tensile strength,σs yield limit,σ-1ai is relevant symmetrical stress amplitude converted into symmetrical circulation.
The symmetrical circulating fatigue stress table for Pantograph V500 running 1,200,000km is got by usage of the equation, as Table 6
Figure 7. Window of Goodman correction TABLE VI.
THE SYMMETRICAL CIRCULATING FATIGUE STRESS TABLE FOR PANTOGRAPH V500 RUNNING 1,200,000KM
Stress Ampletude
σ
−1aiRecurring
No.
n
iStress
Ampletude
σ
−1aiRecurringN
o
n
i tress Ampletude1ai
σ
− RecurringNo
n
iBase Frame Balance rod Pantograph Head
215.50101 1.2e8 0.0251584 2.4e8 0.819116 2.4e8
181.34679 1.2e8 0.0017003 2.4e8 0.998933 2.4e8
84.254515 1.2e8 0.0706742 1.2e8 0.031942 2.4e8
Lower Arm 0.1001777 1.2e8 0.692114 2.4e8
58.050399 1.2e8 0.4279371 1.2e8 0.011498 2.4e8
51.485122 1.2e8 0.4133355 1.2e8 0.078066 2.4e8
30.542465 1.2e8 0.178767 1.2e8 0.040204 2.4e8
Drag rod Balance Arm 0.061687 2.4e8
0.3844125 2.4e8 0.7716597 1.2e8 0.088868 2.4e8
22.481551 1.2e8 1.4187615 1.2e8 0.204458 2.4e8
17.436435 1.2e8 10.370511 1.2e8 1.159119 2.4e8
9.4068552 1.2e8 8.4035344 1.2e8 0.195157 2.4e8
Upper Arm 7.3564385 1.2e8 1.621679 2.4e8
1.3897844 1.2e8 0.0754624 1.2e8 1.918906 2.4e8
1.4186109 1.2e8 0.260136 1.2e8
46.608128 1.2e8 3.404284 1.2e8
42.296808 1.2e8 3.637587 1.2e8
24.95867 1.2e8 8.766499 1.2e8
7.510271 1.2e8
2.52591 1.2e8
IV. A LIFETIME FORECAST OF PANTOGRAPH V500 UNDER
GIVEN RELIABILITY
When Pantograph V500 is under non-stable stress, Miner Linearing Accumulated Damage Theory should be adopted to estimate the fatigue lifetime of V500. This theory is to deem: when the testing sample is on the process of load, every load circulation will lose certain valid lifetime component of the testing sample; And fatigue damage is directly proportional to the work absorbed during the test, this work is proportional to the ratio of action circulating number of stress and damaged circulation times under this stress value; In addition, the total damage (total work) of the testing sample being damaged is a constant; The damage is doing nothing with the action sequence of the load; Finally,when the total number added by all the damage yeilded by every circulating stress is 1, the testing sample will have fatigue damage. To sum them up to the basic relation below[6]:
1 2
1
k
k i
i
d d d d D
=
+ + + =
∑
=i i
i
d n
D = N
i i
i
n
d D
N =
1 2
1 2
k k n
n n
D D D D
N +N + +N =
1 2
1
1 2
1
k
k i
i
k i
n n
n n
N N N = N
+ + + =
∑
=Set NL as the fatigue lifetime of parts under non-stable stress action, to make
1
i i
i k
L i i
n n
n n
α
=
= =
∑
Then n1=α1NL, n2=α2NL ,···, nk=αkNL
1
1
k i L
i i
N
N
α
=
=
∑
1 1
m i
i
S
N
N
S
⎛
⎞
=
⎜
⎟
⎝
⎠
1
1 1 1
1
L k k m
i i
i i i i
N
N
S
N
S
α
α
= =
=
=
⎛
⎞
⎜
⎟
⎝
⎠
∑
∑
(6) Hai Bahe Fatigue Curve is another kind of deformed
S-N fatigue curve of slope m and fatigue curve below the diagonal of slope 2m-1,beginning from 5*106. Apparently, these two curves are presented as straight in double logarithmic coordinate system, and their curvilinear equations (7) seperately is: Sim·Ni=const; Si2m-1·Ni=const.
1 2
1
2 1
1
1 1 1 0
1
L k k m k m
i i i
i i
i i i i
N
N
S
S
N
S
S
α
α
α
−
= = =
=
=
⎛
⎞
⎛
⎞
+
⎜
⎟
⎜
⎟
⎝
⎠
⎝
⎠
∑
∑
∑
1
1 1 1
1
L k k d
i i
i i i i
N
N
S
N
S
α
α
= =
=
=
⎛
⎞
⎜
⎟
⎝
⎠
∑
∑
(7)
In which d=(0.8~0.9)*m This correction way is adopted when there are many
circulations under fatigue limilation.
Adopting Hai Bahe Fatigue Curve is correction theory.
[ ] 1 [ ]
1 [ ] 1 1
1
( ) R
L R k k
m
i i
i
i i R i
N N
S
N S
α
α
= =
= =
∑
∑
(8)In equation (8), NL[R] is lifetime of parts under reliability of R, Ni[R] is lifetime under reliability of R and relevant stress level of Si, in P-S-N Curve.αl,m[R] are the curve’s material constant under reliability of R, in P-S-N Curve.
The flowchart of a lifetime-forcast programs is shown in figure 8.
Begin
read stress spectrum as array S, read parameters as M Input stress spectrum file and parameters
file of S-N curve under reliability
i<=length of S
sum=sum+S(i,1) Define i=1,k=1,LIFE=0
i=i+1 Y
END N
LIFE=LIFE+ S(k)/sum*(S(k)/S(1)))^M
k<=length of S
Output S(1,2)/LIFE Y
k=k+1
N Begin
read stress spectrum as array S, read parameters as M Input stress spectrum file and parameters
file of S-N curve under reliability
i<=length of S
sum=sum+S(i,1) Define i=1,k=1,LIFE=0
i=i+1 Y
END N
LIFE=LIFE+ S(k)/sum*(S(k)/S(1)))^M
k<=length of S
Output S(1,2)/LIFE Y
k=k+1
N
Figure 8. Flowchart of a lifetime-forecast program
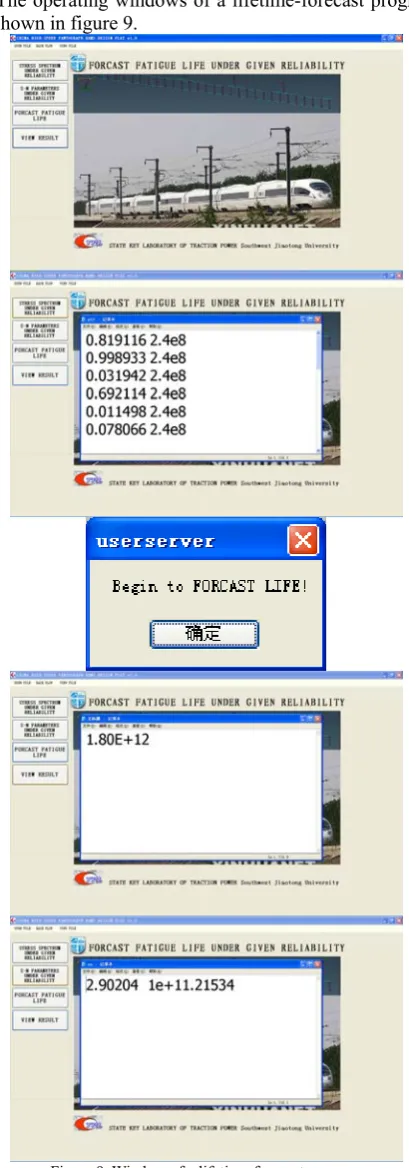
The operating windows of a lifetime-forecast program is shown in figure 9.
Figure 9. Window of a lifetime-forecast program
TABLE VII. FATIGUE LIFETIME FORECAST OF EVERY PARTS OF PANTOGRAPH V500 AT SPEED OF 500KM/H
R=0.5lifetime (km)
R=0.9lifetim e(km)
R=0.95lifetime (km)
R=0.99lifetime (km)
R=0.999lifetim e (km)
R=0.9999lifetime (km)
Base Frame 8.70E+11 1.27E+11 2.65E+10 2.65E+10 8.36E+09 3226757758
Lower arm 2.64E+25 6.06E+23 2.77E+22 2.77E+22 2.90E+21 4.50E+20
Drag rod 2.63E+11 3.86E+10 8.05E+09 8.05E+09 2.55E+09 984178006
Upper arm 4.37E+13 2.61E+12 1.17E+12 2.60E+11 4.80E+10 1.19E+10
Balance Arm 1.48E+43 3.01E+40 1.92E+38 1.92E+38 4.74E+36 2.28E+35
Pan- Head 1.80E+12 2.51E+11 1.44E+11 5.05E+10 1.56E+10 5.96E+09
V. PREDICTING RELIABILITY OF PANTOGRAPH V500
UNDER GIVEN LIFETIME N
According to Miner Accumulated Damage Theory, limited lifetime design is proceeded.
n1,n2,…,nL is the circulating times under stress level
of σ-1a1σ-1a2,…,σ-1aL;uN1,uN2,…,uNL is mean value of
relevant logarithmic lifetime;σN1,σN2,…,σNL is standard
deviation of relevant logarithmic lifetime normally distribution;nie under σi+1 is equal to ni under σi.The
rest may be deduced by analogy till the last stress level. The calculation steps are as follows[6]:
For z1
1
1
1 1
ln
NN
n
u
z
σ
−
=
For n1e
2 2
1
1e
ln (
N 1 N)
n
=
−u
+ ⋅
z
σ
For z2
2
2
1 2 2
ln(
e)
NN
n
n
u
z
σ
+
−
=
The rest may be deduced by analogy till the last stress level zL
( 1)
ln(
)
L
L
L e L N L
N
n
n
u
z
σ
−
+
−
=
(9)Looking up normal distribution form by zL, and making zRL=-zL,to get the reliability R of this part
The flowchart of a lifetime-forcast programs is shown in figure 10.
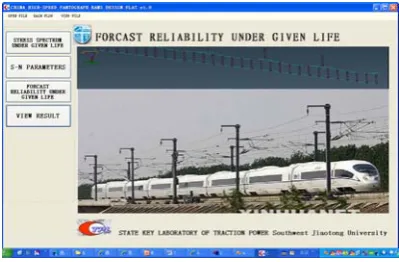
The operating windows of a reliability-forecast program is shown in figure 11.
When R≤[R], the part’s fatigue lifetime is not reliable in given lifetime; when,R>[R],the part’s fatigue lifetime is reliable in given lifetime. Now, based on The Weakest Theory, set [R]=0.95, table8 is the reliability of PantographV500 running1,200,000km at speed of 500km/h
Figure 10. Flowchart of a reliability-forecast program Begin
Input stress spectrum file. Input parameters mean and variance of A and B
i<=length of S
Life(i,1)=Aave+Bave*log(S(i,1))
Life09=norminv(0.9,Aave,Asd)+norminv(0.9,Bave,Bsd)*S(i,1) Life(i,2)=Z09/(Life09-Life(i,1))
Define variable i=1,k=1,LIFE=0, Life09=0,Ne=0,Z=0,array life
i=i+1 Y
End
N
Z=(log(S(k,1))+Ne-Life(k,1))/Life(k,2) Ne=10^(Life(k+1,1)+Z*Life(k+1,2))
k<=length of S
Output normal distribution function Φ(Z)
Y
k=k+1
N Begin
Input stress spectrum file. Input parameters mean and variance of A and B
i<=length of S
Life(i,1)=Aave+Bave*log(S(i,1))
Life09=norminv(0.9,Aave,Asd)+norminv(0.9,Bave,Bsd)*S(i,1) Life(i,2)=Z09/(Life09-Life(i,1))
Define variable i=1,k=1,LIFE=0, Life09=0,Ne=0,Z=0,array life
i=i+1 Y
End
N
Z=(log(S(k,1))+Ne-Life(k,1))/Life(k,2) Ne=10^(Life(k+1,1)+Z*Life(k+1,2))
k<=length of S
Output normal distribution function Φ(Z)
Y
k=k+1
Figure 11. Flowchart of a reliability-forecast program
TABLE VIII. RELIABILITY FORECAST OF PANTOGRAPH
V500 RUNNING 1,200,000KM AT SPEED OF 500KM/H
Parts Name The Reliability of Pantograph V500 running12* 106 at
500km/h
Reliability judgement (R>[R])
Base Frame 0.93853188 Yes
Lower Arm 0.95456666 Yes
Drag Rod 0.96541052 Yes
Upper Arm 0.9224154 Yes
Balance Arm 0.9826166 Yes
Pantograph Head
0.94766937 Yes
VI. CONCLUSION
This paper developments rain-flow program, lifetime-forcast program and reliability-forcast program.
Spreaded material’s basic probablistic S-N relationship to long lifetime probablistic S-N relationship;
compounded Pantograph V500’s operating stress spectrum in elastic-plastic model, an fatigue reliability analysis of Pantograph V500 at designed speed 500km/h has been completed.
Pantograph V500 has long- lifetime fatigue reliability, all the predicting results of key parts’lifetime under different reliability level excess the standard regulation of Pantograph design, 1,200,000km.
Pantograph V500 has high reliability level under condition of 1,200,000km lifetime and given crack length, it excesses the reliability distributed in the weakestness theory .
ACKNOWLEDGMENT
The present research is supported by China 973 Program (2007CB714703), Key Projects in the National Science & Technology Pillar Program during the Eleventh Five-Year Plan Period(2009BAG12A05) and National Natural Science Fund for Creative Research Groups(50821063).
References
[1] Weihua Zhang, Guiming Mei,Xuejie Wu and Zhiyun Shen. Hybrid simulation of dynamics for the pantograph-catenary system, Vehicle System Dynamics,2002,38:393-414.
[2] W. Zhang, G. Mei and J. Zeng. A study of Pantograph/Catenary System Dynamics with influence of presag and irregularity of contact wire. Vehicl System Dynamics Supplement,2002,37:593-604.
[3] W H Zhang, G M Mei, X J Wu and L Q Chen. A study on dynamic behaviour of pantographs by using hybrid simulation method. Rail and Rapid Transit,2005 219 Part F:
[4] Paradl wrter H J, PellissettiM F . Realistic and efficient reliability estimation for aerospace structures [ J ]. Computer Methods in Applied Mechanics and Engineering, 2005, 194: 1597~1617
[5] Jose E R M, DavidW C. A Monte2 Carl o simulation approach for approximating multi-terminal reliability [ J ]. Reli ab ility Engineer i ng and System Safety, 2005, 87: 253~264
[6] Liu WeiXin. Mechanical reliability design [M]. Beijing: Tsinghua University Press, 2006: : 188-220(In Chinese)
Weihua Zhang was born in 1959, is a Changjiang Scholar, Doctor, Professor in State Key Laboratory of Traction Power, Southwest Jiaotong University. The major research is railway vehicle dynamics and pantograph dynamic behaviour study.
Ning Zhou was born in 1978, is a PHD in State Key Laboratory of Traction Power, Southwest Jiaotong University. The major research is pantograph dynamic behaviour study.