ISSN (e): 2250-3021, ISSN (p): 2278-8719 Vol. 04, Issue 05 (May. 2014), ||V3|| PP 27-35
Mathematical Modelling of Corrosion Processes of Zinc/Iron
roofing sheet in Coastal/Industrial Environment
Awajiogak A. Ujile
1and Ehirim O. Emmanuel
2Department of Chemical/Petrochemical and Petroleum Engineering Rivers State university of Science and Technology
Nkpolu-Oroworukwo, Port Harcourt, Nigeria P.M.B. 5080
Abstract: - Mathematical correlation was developed to predict the behaviour of iron roofing sheets on exposure to different environmental conditions. The analytical results from Atomic Absorption Spectroscopy (AAS) of chromium, iron and zinc contents for the locations considered were fed into the developed equation. Corrosion rates were determined by weight loss method and model, and the results from the two methods were in agreement. The predicted rate constants for location A is 0.036/hr, for location B is 0.0174/hr, while location C is 0.000013. The corrosion rates by weight loss method were 0.51mpy and 0.221mpy for locations A and B respectively, within the first five years of operations, while the corrosion rate at location C from 5 – 10 years, was 0.0068mpy. These results clearly indicate that corrosion is heavier on locations close to the industrial areas. This also shows the negative impact of industrial activities on the corrodible materials and consequently on the plants and environment.
Keywords: -Corrosionrate, Corrosion kinetics and Mathematical modelling
I. INTRODUCTION
Corrosion is the degradation of material through environmental interactions. Thermodynamics and kinetics form the basic fundamentals of corrosion. Thermodynamics indicates whether a specific corrosion process is possible while kinetics determine the actual rates of corrosion.
A significant amount of energy is put into a metal when it is extracted from its ores placing it in high energy state. One principle of thermodynamic is that a material seeks the lowest energy state. In other words most metals are thermodynamically unstable and would tend to react with something in their environment (e.g. oxygen, water), in order to reach more stable energy state such as oxide. The process by which metals convert to the lower energy oxides is called corrosion.
been carried out [8]. Their work did not consider the effects of industrial pollutants exuded from flare on zinc sheet [9].
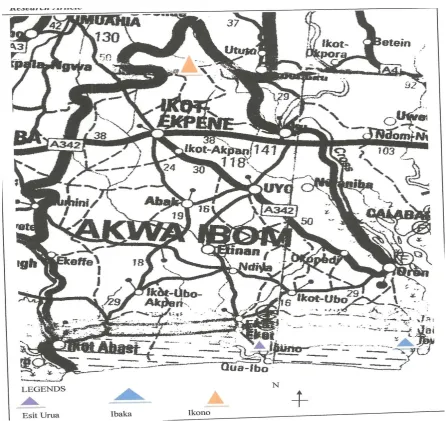
Coastal areas are known to have very high salt loadings in the air because of ions that emanate from the sea[10]. The investigation is to develop model equations that could describe the deterioration of active ingredients and formation of corrosion products on iron roofing sheets at the three locations, as shown in figure 1.
The aim of this study is to present a mathematical model that predicts the depreciation of the active ingredients and the rate of corrosion of the roofing sheet on buildings located in industrial/coastal environment. Three locations in Akwa Ibom state of Nigeria were considered in this study: Location A – Industrial/coastal environment, (where flares from oil/gas and salt laden air are predominant); Location B – Only coastal environment; Location C – Hinterland (where there is no effect of the industrial/coastal impact). This work therefore is to incorporate the industrial activities of oil and gas on zinc roofing sheet.
II. KINETICS OF THE CORROSION PROCESSES ON IRON ROOFING SHEETS:
MATHEMATICAL FORMULATION.
Air moving across the earth’s surface picks up additional loads of substances. In the troposphere, potential air pollutants mix vertically and horizontally and often react with each other or with the components (pollutants) of the atmosphere.
Let us assume ideal mixing of the reaction components and the active protective ingredients in the composition of the zinc roofing sheet. If the reaction components from the atmosphere come into contact with iron roofing sheets (by bulk flow, wind effect or rain effects) whose thickness, T can be changed at a mass rate of flow M, and is removed from the iron sheet at a mass flow rate M2, then the number of moles of any
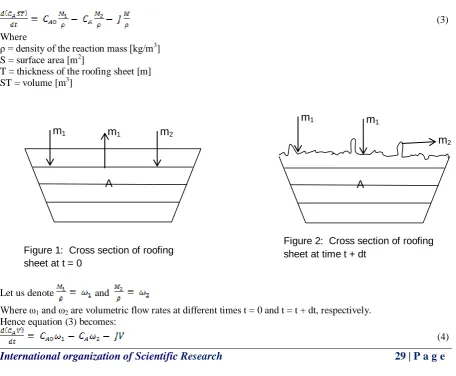
substance (active protective ingredient) in the roofing sheet will change with time. This change in concentration of the active protective ingredient will result in change in volume (thickness), corrosion and hence deterioration of the roofing sheet, see Figures 1 and 2. Fig 2 shows that at time t + dt the surfaces of the roofing sheet is no longer smooth.
Let the initial concentration of the substance A in the iron roofing sheet be CA0. If the ideal mixing of all
components is assumed and achieved on the roofing sheet (taking an elemental cross- section), then the concentration of the substance as it is disposed by rain or wind effect will decrease. Let it be denoted by CA.
The true rate of chemical reaction relative to the substance A could be denoted by J mathematically as follows: The kinetic process can be represented mathematically by:
J = KCAn (1)
Where J = the rate of chemical reaction [gmol/cm3.sec] CA = the concentration of the reactants [gmol/cm3.sec]
K = reaction rate constant [sec-1] n = order of reaction = 1
time
unit
per
sheet
roofing
the
in
A
substance
of
moles
of
number
in
nge
cha
=time
unit
er
sheet
roofing
the
into
introduced
)
ingredient
(active
A
substance
moles
of
Number
p
-time
unit
per
effect
or wind
rain
by
sheet
roofing
the
eaving
substance
moles
of
Number
l
-unit time
per
atosmphere
in
complexes
other
with
surface
sheet
roofing
on the
reacted
have
that
substance
moles
of
Number
A
(2)Equation (2) can be represented in mathematical form by inserting the values of the corresponding quantities as follows:
(3)
Where
ρ = density of the reaction mass [kg/m3
] S = surface area [m2]
T = thickness of the roofing sheet [m] ST = volume [m3]
m1 m1 m2
m1 m1
Equation (4) is the general process model of the dynamic behaviour of components in the iron roofing sheet when in contact with atmospheric pollutants.
Combining equations (3) and (4) for a first order reaction yields:
(5)
Where CAV = number of moles of components A.
(6)
Assuming, , because of the wind effect on contaminants that affect corrosion complexes. Then equation (6) becomes:
(7)
Assuming negligible change in volume, dv/dt = 0; Equation (7) becomes:
(8)
Or
(9)
Equation (9) is the general model of the kinetic corrosion of iron roofing sheet. Using Euler method, the solution of equation (9) becomes:
(10)
If a natural logarithm is taken on both sides of equation (10), we have:
(11)
A plot of the natural logarithm of concentration of the active ingredients against time gave a straight line. The
values of and K were determined from the intercepts and slope, respectively.
III. METHODOLOGY
Figure 1 shows the map of Akwa Ibom state with the location of Esit Urua-A, Ibaka-B, and Ikono-C. The Environmental conditions of these areas, relative humility, ambient temperature, dew point were determined with whirling hydrometer and results obtain as 88%-100%, 28oC – 35oC, 26oC – 30oC, respectively for locations A and C. For location C, the relative humidity, ambient temperature and dew point were 60% - 90%, 28oC – 37oC, 25oC – 38oC.
Fig. 3. Map of Akwa Ibom Nigeria showing the locations under consideration
IV. RESULTS AND DISCUSSION
Table1. Concentration levels of active ingredient considered in roofing sheets in the study locations
g/100g gm/kg
Sample Location
Sample Identification
Zinc Chromium Ferrous Oxide
Table2.0: Estimated Corrosion on Samples of Zinc Coated Steel from the study areas Surface Sample Location Sample Identific ation Area (cm2)
Surface Area (inch2)
Initial Weig ht (g) Final Weight (g) Weight Loss(g) Duratio n (years) Corrosion
rate (mpy)
(wt loss x 22300)/a.d..t
A11 407 65.12 48 35 13 1-5 0.514
A21 38 60.8 50 48 2 5-10 0.034
Esit Urua A31 220.73 35.32 55 48 7 10-15 0.1225
A41 364.64 58.34 50 37 13 15-30 0.091
A51 385.2 61.63 50 48 2 <1 0.501
B11 363.5 58.16 40 35 5 1-5 0.2214
B21 208.52 33.36 30 25 5 5-10 0.1544
Ibaka B31 208.52 33.36 30 25 5 10-15 0.093
B41 284.2 45.47 37.5 25 12.5 15-30 0.0965
B51 418 66.88 50 48 2 <1 0.462
C11 440 70.4 50 50 0 1-5 0
C21 473 75.68 50 49.5 0.5 5-10 0.0068
Ikono C31 404 64.64 75 74 1.0 10-15 0.00543
C41 409 65.5 62.5 62 0.5 15-30 0.00268
C51 517.5 82.8 55 55 0 <1 0
0 5 10 15 20 25
0.005 0.01 0.015 0.02 0.025 0.03 0.035
Time (yrs)
C
o
n
ce
n
tr
a
ti
o
n
o
f
C
h
ro
m
iu
m
,(
g
/1
0
0
g
)
CHROMIUM
ESIT URUA IBAKA IKONO MODEL0 5 10 15 20 25 0
2 4 6 8 10 12
Time (yrs)
C
o
n
ce
n
tr
a
ti
o
n
o
f
Z
IN
C
,(
g
/1
0
0
g
)
ZINC
ESIT URUA IBAKA IKONO MODEL
Fig. 5 Zinc depreciation in the three locations: Experimental and Model
15 20 25 30 35 40 45
ce
n
tr
a
ti
o
n
o
f
IR
O
N
O
X
ID
E
,(
g
/1
0
0
g
)
IRON OXIDE
0 2 4 6 8 10 12 14 16 18 20 0
0.1 0.2 0.3 0.4 0.5 0.6 0.7
C
o
rr
o
si
o
n
R
a
te
(M
P
Y
)
Time(yrs)
ESIT URUA IBAKA IKONO
Fig.7 Rates of Corrosion of Zinc coated steel in locations A, B and C
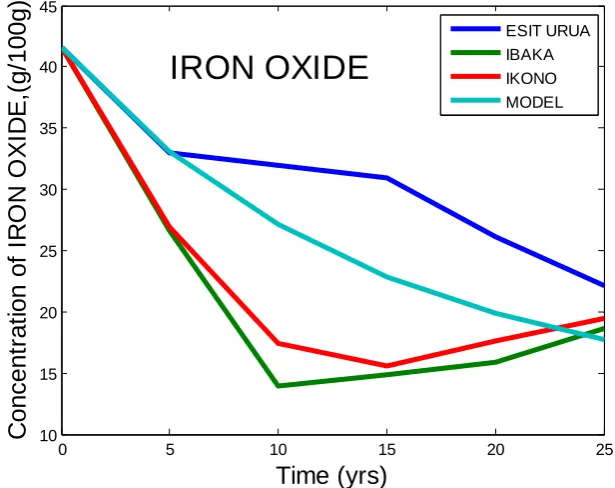
Table 4 shows the depreciation of the active ingredients in the iron roofing sheet. Figures 5-7 are plotted from this table. The results of the simulated model equations for each location are also plotted together with the experimental data. The rates of corrosion in the three different locations are plotted in figure 7.
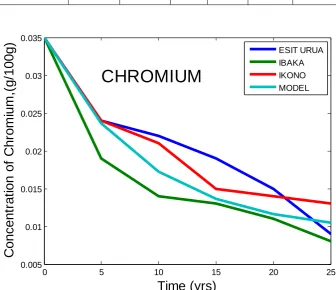
Fig. 4 shows the depreciation of chromium in the three locations. It can be generally observed that the rate of depreciation is highest within the first five years and decreases gradually with time. This trend is also observed in the model result. This behaviour is due to the fact the material exposed to the industrial flare and coastal factors depreciate faster initially and decreases due to the formation of probably the oxides which retard corrosion rate as the time progressed. From this figure it can be inferred that Ibaka, coastal region, registered the highest corrosion impact while Ikono (hinterland) registered the least. This could be due to the variation in intensities of climatic events and pollutant concentrations from the industries.
Figs. 5 and 6 describe the depreciation of zinc and iron oxide from the roofing sheet in the studied three locations, respectively. As illustrated, the graphs show the same trend as in figure 4. Depreciation rates were high within the first 5 years and decreased with time. The model also shows the same behaviour. The impact of climatic factors was more pronounced on location B, Ibaka. This could be due to the increased pollutant concentrations brought by the wind from industrial flares and also the effect of the heavy rain fall in this region. Another important observation is that Esit Urua, a city situated closet to the plant experienced the most depreciation (globally) in the active elements than Ikono located farthest from the plant. This clearly shows that areas closest to the plants suffer a lot of material damage by corrosion. The above observation is reinforced by the values of the calculated rate constants K, within the first 5 year-period, for the three locations: Esit Urua, K =0.036/hr; Ibaka, K = 0.0174/hr; and Ikono K = 0.0000137/hr. It is important to note that corrosion impacts on the roofing sheet were noticed to be 0.0068m.p.y at Ikono from 5-10 years.
Fig. 7 illustrates the estimated corrosion rates on samples of zinc coated steel from the study areas. It can also be observed that corrosion rates are greatest at Esit Urua, closest to the plant location as compared to Ibaka and Ikono farther away from plant operations. This could be the impact of both the climatic factors and industrial activities associated with this region.
V. CONCLUSION
The corrosion impact within the first five years of operation was heavier in all the locations under investigation. This investigation has shown clearly that both industrial activities and climatic conditions impact strongly on corrosion of roofing sheets. Statistically, the mathematical model agrees very well with the experimental results, since the coefficient of determination r2 was more than 80%.
REFERENCES
[1] Johnson, E. And Linder, M. (1993). The influence of Industrial acidification in the atmospheric corrosion
of zinc. Cape Town: Proceedings of 12th International Corrosion Congress 2, 249-560
[2] Cole IS, Neufeld AK, Kao P, Ganther W, Chitomongkol L Barmornsut C, Hue NV, Bernado S and
Purwadaria A (1999). Development of performance verification methods for the durability of metallic
components in Tropical Countries. Proceedings of the 11th Asian- Pacific Corrosion Control Conference
92 55-57.
[3] Graedel TE and McGill W (2011). Degradation of materials in the Atmosphere. Environmental Science
Technology 1093 – 1100.
[4] Cole I.S., Paterson D. A. and Ganther W. D. (2003). Holistic model for atmospheric corrosion Part – 1
theoretical frame work for production, transportation and deposition of marine salts. Corrosion, Engineering, Science and Technology, 38(2), 129-134.
[5] Kearny NJ (No Date). Corrosion Resistance to Atmospheric Corrosion.
http://www.corrosion-doctors.org/Corrosion-Atmospheric/Corrosion-resistance.htm, accessed 14 December 2013.
[6] Obia and Obot (2010). Atmospheric corrosion of metallic roofing sheet in building construction in the
Niger Delta region of Nigeria; Journal of Environmental Issues and Agriculture in Developing Countries
(2& 3).
[7] Deans SW and Lee TS (1987). Degradation of metals in the Atmosphere. Philadelphia P. A. American
Society for Testing and Materials.
[8] Zheng Y, Wang Z and Zhang F (1991). Influence of acid deposition on atmospheric corrosion of zinc. Journal of Environmental Science, China 3(2) 53-60
[9] Ovri JEO and Iroh M (2013). Corrosion Effect of Gas Flaring On Galvanized Roofing Sheet in Imo State,
Nigeria, The International Journal of Engineering and Science (IJES) 2(1) 339-345.
[10] Ujile AA and Ehirim E (2009). Evaluating a technique for solving corrosion process models on oil and
gas facilities. Conference Proceedings 4th Annual Corrosion Management Summit. 11- 14 October,