A Multimodal Biometric Authentication System Using Ear
and Face
Mostafa Akhavansaffar
*, Ali Nakhaei
, Mostafa Mokhtari Ardakan
Department of ICT Engineering, Payame Noor Universtiy(PNU), Tehran, I. R of Iran.
* Corresponding author. Tel.: +989133567433; email: [email protected] Manuscript submitted August 2, 2017; accepted November 5, 2017.
doi: 10.17706/jcp.13.7.876-888
Abstract: The user confirmation systems witch using a biometric method are mostly encounter noisy data and infinite orders of error. To improve special matching in such situations, hybrid biometric systems are utilized. In this study we combined two biometric systems of ears and face to propose a multimodal biometric authentication system which is secure and reliable. To perform desired experiments three face databases including Cohen-Canad, Indian Institute of Technology and FEI new database are considered. We combined these databases separately with ear images database from PNU. Then, we tried to recognize people and evaluate the proposed system. Experimental results revealed that proposed hybrid biometric system is more reliable and more precise comparing to systems using a single biometric method. Owing to its fast recognition it is absolutely suitable for real-time systems.
Key words: Biometric, authentication, era, face, recognition.
1.
Introduction
For authentication purposes, ear recognition biometric scheme has been utilized less than other techniques such as face, finger print and iris. Ear recognition based authentication has unique and interesting characteristics as it is immune to harassment. It is also independent of person's mood, health, hygiene and dressing. Moreover, appearance of outer ear will not change by aging so it is proper choice for long-term authentications.
Image of ear might be obtained easily and from long distant; thus, ear recognition biometric system is a proper choice for surveillance, security, access control and monitoring. Thousands of ear prints found in crime scenes and used as a sign for detecting the criminals have been reported in counties such as Netherland and United States. This article aims to improve performance and reliability of authentication systems by combining ear and face biometrics.
2.
Ear Biometrics
specially were sensible in auricle and cochlea.
According to medical literature [2] the growth of ear is proportional to four months after birth. Therefore, one may conclude that though the growth of ear is relative, gravity may cause ear to be longer in vertical direction. The result of this elongation will appear in auricle. The measurements have demonstrated that this change is nonlinear. The speed of elongation in 8-year-old children is almost 5 times of its speed in four months after birth. After this age, the ear size will remain constant until 70s when it starts to grow again.
The essential problem of ear biometric is that it would be useless when the ear is covered say with hair. In active authentication systems this would not be prominent as the subject can remove his/her hair and perform the authentication process. Nevertheless in case of passive authentication this issue would be problematic. When the ear is partially covered by hair it is feasible to separate and detect hair.
3.
Related Work
3.1.
Ear Biometrics
One of the primary methods for detecting edges of ear was utilized by Kenedi [3]. Additionally, in research conducted in 2003, ear recognition was compared to face recognition by Principal Component Analysis (PCA) techniques. Recognition rate for face and ear were 70.5% and 71.6%, respectively. Based on reported results the performance of the system was improved using PCA methods in subsequent studies.
In another research performed in 2007, it was proposed that a sector from tip of nose can be taken to detect ear region [4]. In this method the irrelevant part of the image (the area which is not ear) is removed by skin detection. Then, ear cavity is detected using Gaussian blur and curvature estimation. Afterwards, an active perimeter algorithm was exploited to extract perimeter of ear. This ear biometric detection system was tested over a large database of images belonging to 415 people. Utilizing optimized version of ICP algorithm a 95.7% and 97.8% precision was achieved in supervised and unsupervised modes, respectively (Error rate equals to 1.2%).
The proposed system was automatic but when the ear cavity was not visible it would encounter error and stop working.
Subsequently in 2007, modified CAMSHIFT algorithm was proposed to take profile image as Region of Interest (ROI). Then, using information of ear perimeter, it applied proper perimeter to ROI to obtain precise detection of features.
In 2004 a set of ear images were tested using feature extraction and image classification techniques. The range of accuracy and precision of image classification in experiments was between 76.5% and 94.1%.
Recently in 2008 a novel method were proposed for ear recognition which used AdaBoost algorithm. The system was tested by rectangular Haar like features and using a database of images with various gender, appearance, rotation angle and resolution. The images were gathered through cropping and combining images of several face databases. This was a fully automatic system which achieved 100% success in recognizing 201 uncovered images. Moreover, it succeeded in recognizing some images which were partially covered.
In studies which have been conducted since 2004, ICP or PCA are utilized for matching in most of ear recognition methods. Furthermore, in 2005 a different automatic geometric technique was proposed for matching. This method was tested using 240 images from 12 people (20 images were taken from each person from different views). The success rate was 100 %.
3.2.
Face Biometrics
Research of face recognition will open up new studies challenging scientists and engineers in future years. For instance, providing a powerful face recognition system can be exploited in projects regarding national security, human-machine interactions and so many other applications. Research on automatic recognition using face started in 1960 [5]. In a study performed in 2003 face recognition techniques were explained. General speaking, face recognition techniques can be divided into two groups based on face display:
Appearance based; where general characteristics of fabric are utilized. It is used for whole face or a specific region of face.
Feature based; where detection is performed according to geometric features of face such as mouth, eyes, eyebrows, forehead, chick, lips and so on.
The first step should be taken in an automatic face recognition system is discovering face in an image. When the face is detected, pattern extraction section derives information which can be transferred to face classification system. Considering the type of classification system these features and patterns may include either regional characteristics such as fabric or face components such as eye, nose and mouth.
One of the most common as well as most powerful algorithms for face recognition is designed by Bell Viola and Michael Johns. They introduced a machine learning based method for object identification where lots of weak learners contribute to train a powerful classification system. For a problem which only needs two classes and includes tagged training samples, an Adaptive Boost learning algorithm is able to choose few numbers of visual features to provide the highest level of precision in classification. Fig. 1 depicts a sample of common algorithm for face and feature detection.
Fig. 1. An example of face recognition system and feature extraction.
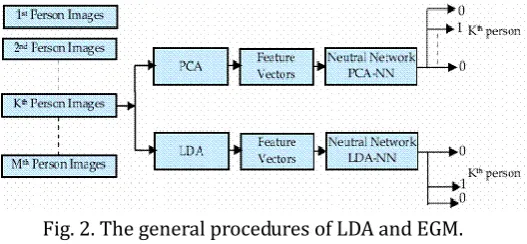
In the late 1980s and the beginning of 1990s, applying different methods of Still-face recognition such as PCA, Linear Discriminant Analysis (LDA)and an structure oriented procedure called Elastic Graph Matching (EGM) triggered research in the field of face recognition. Since then a great number of studies have been performed to develop and improve these algorithms. Linear distinction analysis and Fischer linear distinction are examples of statistical approaches used for machine learning to find a linear combination of features which divide different classes of objects most properly.
In the Fig. 2 the general procedures of both methods are illustrated:
vectors of subspace for face image database (which was called Eigenspace). The images were planned in the compressed subspace. Afterwards, new test images were put in the form of basis vectors and it was matched with existing images in database to find the most similar compressed image from the Eigensubspace.
Fig. 2. The general procedures of LDA and EGM.
Since then, researchers established new studies to discover subspaces which are capable to improve system performance. One of these methods is Fischer LDA. The purpose of LDA in each n-class classification problem is finding n-1 basis vectors which minimize intra-class distance while maximizing inter-class distance. Same level PCA and LDA are totally different. LDA is a supervised learning technique whereas PCA is an unsupervised one. A common characteristic of PCA and LDA is that they generate target eigenvectors in spatial manner. In other words, basis vectors generated by LDA and PCA are non-zero for all dimensions. In face recognition technology test (FRET) applied to face recognition algorithms at the end of 1996 and the beginning of 1997, the best performance belonged to LDA and EGM; that is to say, algorithms which were derived from probability subspaces. The most difficult test of FRET was recognizing person's face based on images taken in 18-month time intervals.
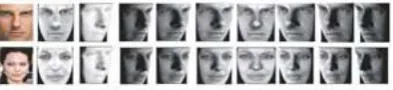
Researchers have solved the problem of face recognition in different poses, illumination conditions and expressions. Previous efforts included Eigenface expansion method (a version of image to which Eigenvectors and Eigenspaces equations are applied). In this method various eigenspaces are generated and each of them records different information about face from various angles. In order to solve problem of different poses a 3D model is constructed and 2D views are extracted for each pose. A variable 3D model was proposed by researchers so that they could control different conditions of poses and illumination. In this 3D model a linear combination of a set of face samples provides necessary parameters for fabric and form of face. These parameters are estimated through pairing the 3D model on the input image.
self-divided image which is derived from dividing main image into its moderated version (a copy which has less contrast). As a result this copy is not sensitive to illumination variations. This method is a kind of public photometric stereo algorithm which facilitates intra-group deformations. In recent studies, researchers have developed accidental and non-stationary filters which are utilized to estimate reflection maps of face recognition which is insensitive to illumination. Fig. 3 demonstrates an example of estimating these maps and 3D models derived from a unique image. Yet most of researchers agree that these methods are more efficient in recognition of face with different illuminations in comparison with eigensubspace methods and etc. However, all of them are tested on set of controlled data such as B set in Yale University or PIE set collected in Carnegie Mellon University. Designing methods which are resistant to illumination variations in uncontrolled environments is still an open question. Analysis and recognition of face expressions are widely investigated in studies concerning human-machine interactions. Identity and expression of the face may be processed via separate systems.
There are several techniques for automatic recognition of face expressions. Most of them are effective for general and large scale expressions such as happiness, anger, wonder and fear.
Fig. 3. Examples of illumination insensitive reflection maps and 3D models extracted from downloaded images are shown. In each row the most left side image is downloaded from internet. The next two images are reconstructed 3D model from two different angles. The last set of images is obtained by combining new images which are derived from 3D model based on various poses.
3.3.
Face and Ear Biometrics
Although face biometrics have been vastly investigated during the last two decades, issues in images (e.g. illumination, shadow, size and motion) have challenged generation of unconstrained face authentication system. Besides, it is difficult to collect constant features of a face specially when there are variations due to expression and make-up [7].
Color distribution in ear is uniform comparing to face. Hence, working with black and white or binary images, we will not miss a considerable amount of information. Also, ear is smaller than face which results in faster and more effective operation. It can be seen particularly in images with lower precision. In contrast to face, ear image does not change by wearing glasses or beard and make up. Nevertheless it might be covered by hair and earrings.
3.4.
Multimodal Biometrics
Since most of biometric systems utilized in real life are single mode ones, they rely on information achieved from one source to authenticate people. Consequently, they might encounter several problems including noise in received data, variation of data classes, similarity between classes, lack of comprehensiveness and manipulation attacks. One of the solutions to address these problems is using more than one source to perform authentication. In such systems two or more biometric systems are employed. Using multiple biometric systems considerably increase performance of authentication system [8].
4.
Classification Using Wavelet Probability Neural Networks
data. N is the dimension of data set. Wavelet layer is a linear combination of several multi-dimensional wavelets. Each wavelet neuron is equivalent to a multi-dimensional wavelet and each wavelet is in the following form:
a
b
x
a
x
b a
, a,bR (1)
x
is referred to as mother wavelet and its parameters, a and b, are scalability and translating factor, respectively. In Gaussian layer probability density function which is applied to each Gaussian neuron is as follows:
na
i i j i p p i S X n X f 1 2 2 2 ) 2 ) ( exp( ) 1 ( ) 2 ( 1 ) ( (2)
where X is the eigenvector, p is the dimension of training set, n is the dimension of input data, j is the jth
data set, i j
S
is training set and
is Gaussian smoothing factor.Scalability, shifting and smoothing factors are initially assigned randomly and they are trained through particle swarm optimization algorithm. As soon as training is performed, structure of neural network and parameters will remain constant in further investigations [9].
5.
Particle Swarm Optimization Algorithm
Particle swarm optimization algorithm is a social search algorithm which is modeled based on social behavior of bird groups. At first this algorithm was utilized in order to discover pattern which govern simultaneous flight of birds and their sudden redirecting and optimum deformation of groups [10].
In this method particles stream in search space. The displacement of particles in the search space is affected by either their own experience and knowledge or their neighbors'. Thus, location of other particles influence on searching for one particle. The result of modeling this social behavior is a search process where particles tend to successful regions. The particles in the group learn from each other and based on obtained knowledge they go to their best neighbors. The working principal of this algorithm is that each particle at each moment chooses its location considering the best location it has ever placed and the best location which is available in whole neighborhood.
Assume that we aim to derive
(
x
,
y
)
ordered pair so that function in equation (3):F
(
x
,
y
)
x
2
y
2 (3) is minimized. First of all, we randomly choose some points in search space on the x-y plane. Say that we divide this group into three neighborhoods. In each neighborhood existing points interact each other. In each neighborhood all points move toward the best point in that neighborhood and the best point where it has located before. To solve a multi variable optimization problem we may use multiple groups which perform specific tasks. This is the same idea which inspired ant colony optimization algorithm [10], [11].In this article we used particle swarm optimization algorithm to train neurons so that we can optimize probability neural network model. As mentioned before the basis of the algorithm is starting from a distributed population called particles. These particles tend to move toward the best solution in the search space. The particles will remember the best solution with which they come up and the best solution for population swarm. In each iteration each particle sets its vector velocity according to its motion value (its instantaneous motion), effectiveness of the best person and solution to the best population. The location of
unit. Vi is a function of the best location of p which is detected by particle. It is also a function of the best
location g which is detected considering all particles in the group. The displacement and motion can be shown using the following equations [11]:
1
1
1
2 2
1 1
t
x
g
u
c
t
x
p
u
c
t
v
t
w
v
i
i i
i (3)
t
x
t
v
t
x
i
1
i
i (4)where w(t) is inertial weight, c is the acceleration constant and μ(which is a number between zero and one) are random numbers with uniform distribution. We encrypted the wavelet neuron by scalability factor, shifting factor and Gaussian neuron smoothing factor. Particle swarm optimization algorithm is able to search the best set of factors in 3D space and in offline mode.
5.1.
Decision Rule
In the decision layer of probability neural network model, five probabilistic values
P
1,P
2,
,
P
5 arederived for ear features. The average of these probabilistic values is the output
P
I. For face features there isjust one output probability value
P
f . We generate a linear combination of these extracted probabilisticvalues which is denoted by
P
av. It is, in fact the average ofP
I andP
f . In Fig. 4 False Acceptance Rateand False Rejection Rate are illustrated while
P
av threshold is applied. The horizontal axis shows thethreshold value
P
av for recognition of multimodal biometrics and vertical one demonstrates error rate.When the output
P
av for a non-registered sample is less than chosen threshold value, false acceptance occurs. FAR is calculated by counting the sequence of accepted errors. In other words, when the outputav
P
for a stable sample is more than chosen threshold value, the sample is false rejection. FRR is calculated by counting the sequence of false rejections.Fig. 4 . Diagram of FAR and FRR.
6.
Experiment Databases
group contained 40 samples of Indian Institute of Technology face database and PNUDB ear database. Finally, the third one consisted of 200 samples of FEI face database and PNUDB ear database.
Cohen-Canad database includes 2300 images from 100 people and Indian Institute of Technology database consists of 440 images from 40 people. The number of images in FEI database was 2800 ones for 200 people; while PNUDB includes 608 ear images from 76 people. The multimodal biometric authentication system was evaluated using three groups of data samples.
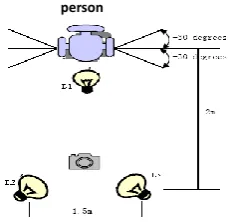
Ear images of this database belong to 76 students and professors of PNU University. The images are taken from the right ear using a digital camera. The distance between ear and camera is considered constant and equal to 2 meters. The image is obtained in different illumination conditions and from different angles as depicted in Fig. 5 and Fig. 6. In these figures Lx denote the lamps (L1 is directly on top of person's head and L2 and L3 are placed in different locations so that images can be obtained from various angles)
Fig. 5. Lamp locations in different illumination conditions.
Fig. 6. Taking samples from different angles.
Fig. 7. Some of existing images in the ear database.
Eight profile photos are taken from each person; two photos from forward, four from different angles and two photos with two different illumination conditions. The size of images is 300×400 pixels. The second and fifth photos are both profile ones but taken in different illumination conditions. The third and fourth
person
photos are taken in identical illumination conditions but different angles; the former is taken from +30 and the latter taken from -30. Hence, images of this database are proper to perform recognition in various illumination and angular conditions. Some of existing images in this database are shown in Fig. 7.
7.
Image Quality
Quality of biometric samples plays a significant role in system performance. One of the matching errors in biometric systems is due to low quality of images. Assessing the quality of images in automatic biometric systems may result in improvement of system performance.
In this study we used normalized mutual correlation to evaluate the input image. The main principle encouraging us to use correlation is determining similarity between one image and the main one. Similarity degree is a simple measure which might be basis of deciding about an object [12]. As mentioned earlier, normalized mutual correlation method is a matching measurement method which is vastly used in correlation based on pattern recognition. If the input image f and middle image are in a training set g, the value of normalized mutual correlation in matching situation is calculated as follows:
ij ij ij ij g j i f j i g f j i g f 2 2 ) , ( . ) , ( . ) , ( ) ,( (5)
8.
Experimental Results
8.1.
Evaluating Multimodal Biometric Authentication Systems over Cohen-Canad Face
Database and PNU Ear Databases
First off, we evaluated multimodal biometric authentication system over Cohen-Canad face database and PNU ear database. This database which is one of the most perfect sets of face expression images includes face images of 100 students of the university who are between 18 and 30 years old. It consists of people's images from different ethnics and various ages. Men constitute 45 percent of these people [13]. These images demonstrate six main feelings including happiness, sadness, fear, anger, wonder and hate. In this collection 23 photos are taken from each person in different conditions and the size of each image is 640×480 pixel [13]. For each person 8 images, which were chosen randomly, were considered as training samples and 15 remained images were utilized as test samples. PNU ear database includes 608 images belonging to 76 people (8 photos for each person). 60 people are chosen randomly from this database. For each of them 4 images are chosen randomly to be used as training samples; while the remained ones (4 images) were exploited as test samples. Each person from ear database was randomly paired with a person in face database. This is done 100 times. Fig. 8 shows ROC diagram in three states. Moreover, experiment results are presented in Table 1.
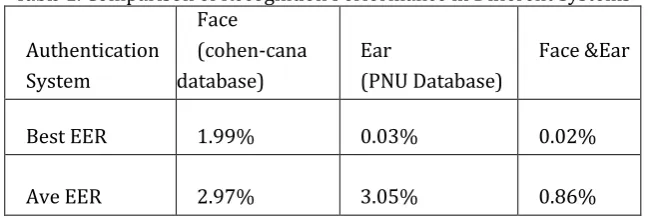
Table 1. Comparison of Recognition Performance in Different Systems
Authentication System Face (cohen-cana database) Ear (PNU Database) Face &Ear
Best EER 1.99% 0.03% 0.02%
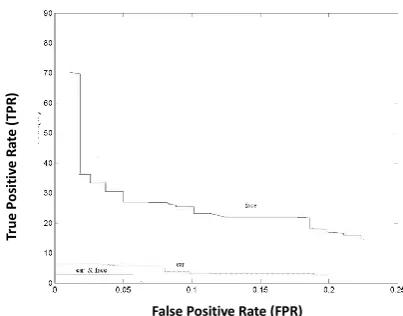
Fig. 8. ROC diagram in different biometric authentication systems.
The obtained results in Fig. 8 and Table 1, illustrate performance of authentication system in different situations. Fig. 8 shows the ROC diagram in three conditions; face, ear and hybrid face and ear. As can be seen in figure the multimodal biometric authentication system has better performance comparing to single mode systems such as ear and face. From Table 1 it is evident that multimodal biometric authentication system has the best EER , 0.02%. Thus, multimodal biometric system is more reliable and more valid in comparison with single mode ones.
8.2.
Evaluating
Proposed Multi-Modal Biometric Authentication Systems over Indian
Institute of Technology Kanpur Face Database and PNU Ear Databases
In the next step we evaluated the proposed multimodal biometric authentication systems over Indian Institute of Technology Kanpur face database and PNU ear database. This face database includes face images of 40 people which are taken in 11 different conditions. Occasionally, some extra photos are taken from some of these people as well. All images have bright background and photos are taken from forward view and while the people were standing. For each person images are provided in different conditions e.g. while they are looking forward, right, left, up or down (Fig. 9). In addition to different angles image of each person is taken in case of four expressions; normal, smile, sadness and laughter. The size of main photos is 640×480 pixels.
Fig. 9. An example of existing images in Indian institute of technology kanpur databases.
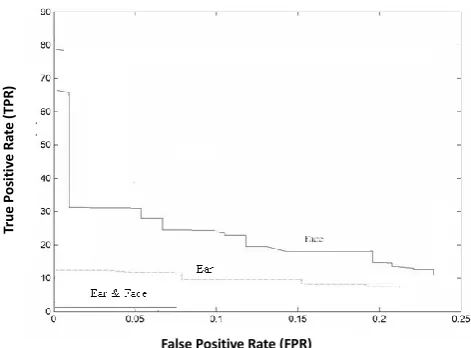
For each person four images are chosen randomly and utilized as training samples. The seven remained images are utilized as test samples. In ear database 60 people are chosen randomly. Similar to previous experiment four images of each person's ear are considered as training samples and four remained ones are used as test samples. Each person from ear database is randomly paired with a person in face database. This procedure is repeated 100 times and the results may be found in Table 2 and Fig. 10.
According to results shown in Table 2, it might be concluded that multimodal biometric authentication system has the best performance regarding recognition and verification in comparison with single mode biometric systems. The best EER and average EER in multimodal biometric system are 0.01% and 0.93
False Positive Rate (FPR)
Tr
ue
P
os
it
iv
e
R
at
e
(
TP
R
respectively.
Fig. 10. ROC diagram in different biometric authentication systems.
Table 2. Comparison of Recognition Performance in Different Systems Authentication
System
Face
(IITK database) Ear
(PNU Database)
Face &Ear
Best EER 2.99% 0.8% 0.01%
Ave EER 2.98% 3.13% 093%
8.3.
Evaluating Proposed Multimodal Biometric Authentication Systems over FEI Face
Database and PNU Ear Databases
In the last experiment we evaluated proposed multimodal biometric authentication systems over FEI face database and PNU ear databases. FEI database includes a set of face images which are taken in FEI artificial intelligence lab in Sao Paulo Brazil between 2005 and 2007. It consists of 2800 images from 200 people, 14 images for each person(Fig. 11). Almost 10% of images have different scale but the size of main image is 640×480 pixels. Images belong to students and staff of the university who were between 19 and 40 years old and they were different considering hair style, appearance and make up. 100 people are men and 100 people are women [14].
Fig. 11. An example of images which exist in FEI databases.
For each person 6 photos are randomly selected as training samples and 8 remained photos are considered as test sample. In ear database 100 people are chosen as well. Similar to previous experiment, for each person four images are selected as training samples and four remained ones are considered as test samples. Each person in ear database is randomly paired with one person in face database. This procedure will repeated 100 times and the experiment results are shown in Table 3.
Tr
ue
P
os
it
iv
e
R
at
e
(
TP
R
)
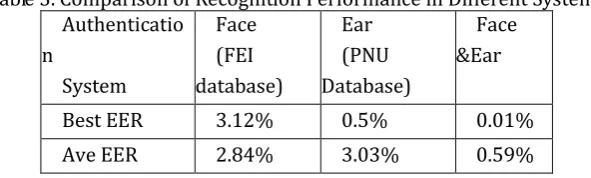
Table 3. Comparison of Recognition Performance in Different Systems Authenticatio
n
System
Face (FEI database)
Ear (PNU Database)
Face &Ear
Best EER 3.12% 0.5% 0.01% Ave EER 2.84% 3.03% 0.59%
Considering obtained results presented in Table 3, it can be concluded that multi-modal biometric system has the best performance regarding recognition and verification comparing to single mode biometric systems. The best EER and average EER in multimodal biometric systems are 0.01% and 0.59, respectively.
9.
Conclusion
In this article a multimodal biometric authentication system is proposed which use ear and face features to recognize people. The features of ear and face are extracted separately and wavelet probability neural network is exploited for multi factor decision making. In this study we combined three face databases Cohen-Canad, Indian Institute of Technology and FEI with PNU ear database to generate an experimental biometric database. Using these databases we investigated reliability of proposed method and performance of multimodal biometric systems. The experimental results have revealed that multimodal biometric authentication system is much more reliable and precise than single mode biometric systems. It might be used in real-time authentication systems. The authors plan to use their proposals in passport issuing systems to identify individuals and identify them if their passports are lost anywhere in the world, as well as banks' payment systems.
References
[1] Iannarelli, A.(1989). Ear Identification. Paramont Publishing Company.
[2] Wildes, R. P. Iris recognition: An emerging biometric technology. Proceedings of the IEEE.
[3] Jafar, M. H., & Ali, A. E. (2006). An iris recognition system to enhance e-security environment based on wavelet theory. AMO -Advanced Modeling and Optimization.
[4] Rabab, M. R., & Rehab, F. A. (2009). Face recognition using particle swarm optimization-based selected features. International Journal of Signal Processing, Image Processing and Pattern Recognition,2(2).
[5] Kim, H. S., & Kim, J. H. A two step circle detection algorithm from the intersecting chords. Pattern
Recognition Letters, 22(7), 787-798.
[6] Camus, T. A., & Wildes, R. Reliable and fast eye finding in close-up images. Proceedings of the 16th
International Conference on Pattern Recognition (pp. 389-394).
[7] Zhou, H., Mian, A., Wei, L., Creighton, D., Hossny, M., & Nahavandi, S. (2014). Recent advances on singlemodal and multimodal face recognition: A survey. IEEE Transactions on Human-Machine Systems,
44(6).
[8] Ruiz-del-Solar, J., & Navarrete, P. (2005). Eigenspacebased face recognition: A comparative study of different approaches. IEEE Transactions on Systems, Man and Cybernetics, Part C, 35(3), 315-325. [9] Kim, H. S., & Kim, J. H. (2005). A two step circle detection algorithm from the intersecting chords.
Pattern Recognition Letters, 22(7), 787-798.
[10]Meng, J. E., Chen, W., & Shiqian, W. (2005). Highspeed face recognition based on discrete cosine transform and RBF neural networks. IEEE Transactions on Neural Networks,16(3), 679–691.
[12]Ronny, T., Wanquan, L., & Svetha, V. (2004). Application of the DCT energy histogram for face recognition. Proceedings of the 2nd International Conference on Information Technology for Application.
[13]Du, S., & Ward, R. (2006). Face recognition under pose variations. Journal of the Franklin Institute,
343(6), 596-613.
[14]Rabab, M. R., & Rehab, F. A. (2009). Face recognition using particle swarm optimization-based selected features. International Journal of Signal Processing, Image Processing and Pattern Recognition, 2(2).
Mostafa Akhavansaffar received B.Sc degree in computer engineering-hardware and received his M.Sc degree in information technology-secure communication from Iran University of Science and Technology. He has been working as a lecturer and a faculty member with the department of ICT, Payame Noor University. He has also published many papers on international conferences and journals. His research interests mobile security, information systems, social network and bigdata.
Ali Nakhaei received his B.Sc degree in computer software engineering from Payame Noor
University (PNU), Iran in 2007, and the M.Sc degree in computer system architecture engineering in Faculty of Electrical and Computer Engineering from Islamic Azad University, Dezful Branch, Iran in 2011. He is working as a faculty member in Department of Computer Engineering at Payame Noor University of Iran since 2014. His research interest includes e learning, artificial intelligence and mobile app developing.