362
International Journal of Pharmaceutical Sciences and Drug Research 2018; 10(5): 362-371
Research Article
ISSN: 0975-248X
CODEN (USA): IJPSPP
Preparation and
in vivo
Evaluation of Solid Dispersions Using
Repaglinide
I. Srinivas, D.V.R.N Bhikshapathi
*Mewar University, NH-79, Gangrar, Chhitorgarh-312901, Rajasthan, India
Copyright © 2018 I. Srinivas et al. This is an open access article distributed under the terms of the Creative Commons
Attribution-NonCommercial-ShareAlike 4.0 International License which allows others to remix, tweak, and build upon the work non-commercially, as long as the author is credited and the new creations are licensed under the identical terms.
ABSTRACT
In the present study, immediate release solid dispersion of Repaglinide was formulated by solvent evaporation technique. Repaglinide solid dispersions were prepared using PEG 8000, Pluronic F 127 and Gelucire 44/14 by solvent evaporation method. A 3-factor, 3-level central composite design employed to study the effect of each independent variable on dependent variables. FTIR studies revealed that no drug excipient interaction takes place. From powder X-ray diffraction (p-XRD) and by scanning electron microscopy (SEM) studies it was evident that polymorphic form of Repaglinide has been converted into an amorphous form from crystalline within the solid dispersion formulation. The correlation coefficient showed that the release profile followed Higuchi model anomalous behavior and hence release mechanism was indicative of diffusion. From in vivo studies, the AUC0→24 h and peak plasma concentration (Cmax) was doubled when compared with pure drug. In
addition, in vitro dissolution efficiency was well correlated with in vivo pharmacokinetic parameters. The obtained results suggested that developed solid dispersion might be an efficacious approach for enhancing the solubility and bioavailability of Repaglinide.
Keywords: Repaglinide, Diabetes mellitus, Solid dispersion, Solvent evaporation method, Bioavailability studies.
DOI: 10.25004/IJPSDR.2018.100502 Int. J. Pharm. Sci. Drug Res. 2018; 10(5): 362-371
*Corresponding author: Dr. D.V.R.N Bhikshapathi
Address: Mewar University, NH-79, Gangrar, Chhitorgarh-312901, Rajasthan, India Tel.: +91-9848514228
E-mail: [email protected]
Relevant conflicts of interest/financial disclosures: The authors declare that the research was conducted in the absence of any commercial or financial relationships that could be construed as a potential conflict of interest.
Received: 07 July, 2018; Revised: 10 August, 2018; Accepted: 14 August, 2018; Published: 23 September, 2018
INTRODUCTION
Drugs with poor aqueous solubility [1] are an important
problem for pharmaceutical scientists. Poor aqueous solubility hinders the in vivo efficacy of the drugs, causing low bioavailability, abnormal pharmacokinetic profile, and inter-subject, inter-species variation leading
to expensive and prolonged development. [2] With the
advent of combinatorial chemistry and high
throughput screening, the number of poorly
water-soluble compounds has dramatically increased. [3] There
Int. J. Pharm. Sci. Drug Res. September-October, 2018, Vol 10, Issue 5 (362-371) technique from the dispersion in carrier more specially
define the system has the dispersion of the one or more active ingredient in an inert matrix at solid state perform by melting method, solvent evaporation
method and melting solvent. [4] Solid dispersions are
one of the most successful strategies to improve the
drug release of poorly soluble drugs. [5] Solid dispersion
of drug in a water-soluble polymer has been shown to be one of the most promising strategies to improve
solubility. [6]
Most poorly water-soluble APIs exist in an amorphous form within the solid dispersion, thereby enhancing their dissolution and oral absorption by attaining a highly supersaturated state above their equilibrium
solubility. [7] Although there was a great interest in solid
dispersion systems during the past four decades to increase dissolution rate and bioavailability of poorly water-soluble drugs, their commercial use has been very limited, primarily because of manufacturing
difficulties and stability problems. [8] The mechanisms
for the enhancement of the dissolution rate of solid dispersions have been proposed by several investigators. Drugs molecularly dispersed in polymeric carriers may achieve the highest levels of particle size reduction and surface area enhancements, which result in improved dissolution rates and drug solubility and wettability, may be increased by
surrounding hydrophilic carriers. [9] Repaglinide (RPG),
a member from meglitinide class, is a post prandial glucose regulator used in management of type II diabetes. It stimulates the release of insulin by binding to a receptor that is distinct from sulfonylurea receptor.
[10-11]
The present study involves the enhancement of solubility and bioavailability of Repaglinide by using solid dispersion technique with solvent evaporation method with different hydrophilic novel carriers.
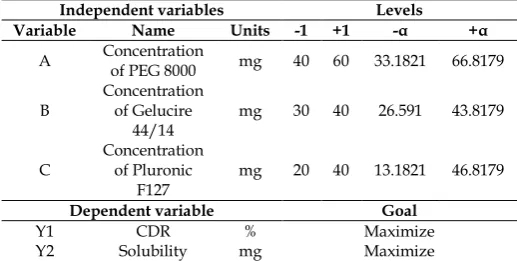
Table 1: List of dependent and independent variables in central composite design
Independent variables Levels
Variable Name Units -1 +1 -α +α
A Concentration of PEG 8000 mg 40 60 33.1821 66.8179
B Concentration of Gelucire
44/14 mg 30 40 26.591 43.8179
C Concentration of Pluronic
F127 mg 20 40 13.1821 46.8179
Dependent variable Goal
Y1 CDR % Maximize
Y2 Solubility mg Maximize
MATERIALS AND METHODS Materials
Repaglinide was generous gift from Aurobindo Pharma Ltd., Hyderabad, India. Pluronic F127, Oleic acid, Gelucire 44/14, Labrasol, Labrafac PG and Transcutol P were also obtained from Aurobindo Pharma Ltd. Kolliwax GMS II was procured from Signet Chemical
Corp. Pvt. Ltd, Mumbai. Ethanol, HCl, Labrafil M 1944, Propylene glycol, PEG 8000 and PEG 6000 were obtained from SDFCL, Mumbai. Kolliphor RH-40 and Captex were given by BASF, Mumbai. All other excipients used were of analytical grade.
Preliminary Solubility Studies
Drug solubility studies were performed in triplicate by adding excess amounts of repaglinide to water soluble carriers mentioned in Table 4 with 1:1 ratio and solutions containing flasks were kept on a rotary shaker at constant speed at 25°C ± 2°C for 24 h. The saturated solutions after equilibration for 24 h were filtered through a membrane filter having pore size of 0.45µm. Filtrates were suitably diluted and estimated using UV spectrophotometer at 237 nm. Filtered solution
analyzed for the Repaglinide using UV method. [12]
Phase Solubility Studies
The aqueous solubility of repaglinide in water was determined at increasing concentrations of different carriers. The solubility method of Higuchi and Connors was used. An excess amount of repaglinide was added into the screw capped amber vials of aqueous solutions of each carrier in Phosphate buffer pH 6.8 containing increasing concentrations of the individual carrier (i.e., 0.1%, 0.25%, 0.5%, 0.75% and 1% w/v). The vials were rotated at 60 rpm while being kept at 37°C. After equilibrium was reached (24 h), the solutions were filtered through 0.45μm cellulose acetate filters and analyzed spectrophotometrically (Shimadzu 1800,
Japan) at 237 nm. [13-14]
Drug-excipient compatibility study
The Drug-Excipients Compatibility Studies were
performed according to the reported method. [15-16]
Design of experiments
Initially, preliminary experiments (one factor at a time approach) were performed to determine the main factors and the appropriate ranges in which the optima lie. From the preliminary studies, it was observed that the concentration of polymers affects the formulations of solid dispersion. Based upon this, three factors were selected: Further, the effects of three factors (Concentrations of PEG 8000, Gelucire 44/14 and Pluronic F127) on % Cumulative drug release (%CDR) and solubility were tested. Through preliminary screening the concentrations of PEG 8000, Gelucire 44/14 and Pluronic F127 were identified as the most significant variables within the range of 40-60 mg, 30-40 mg, and 20-40 mg, respectively. On the basis of the preliminary trials a 3-factor, 3-level Central composite design was employed to study the effect of each independent variable on dependent variables (% CDR, and solubility). The range of level of each independent variable was set according to the preliminary experiments and is listed in Table 1. On the basis of the central composite design model provided by Stat-Ease
Design Expert® software V8.0.1, 20 model experiments
Int. J. Pharm. Sci. Drug Res. September-October, 2018, Vol 10, Issue 5 (362-371) model experiments are summarized. The experiments
were conducted as for the design and the obtained responses for the dependent variables (% CDR, and solubility).
Regression analysis
The targeted response parameters were statistically
analyzed using Stat-Ease Design Expert® software
V8.0.1 by applying one-way ANOVA at 0.05 levels. The individual parameters were evaluated using the F test
and quadratic models of the form Y = β + β1X1 + β2X2 +
β3X1X2 + β4X12 + β5X22 were generated for each response
parameter using multiple linear regression analysis (MLRA), where Y is the level of the measured response;
β is the intercept β1 to β2 are the regression coefficients.
X1 and X2 stand for the main effects; X1X2is the
interaction between the main effects; X12 and X22 are the
quadratic terms of the independent variables that were used to simulate the curvature of the designed sample space. The value of coefficients reflected the effect of independent variables and their interaction on the dependent variables. A positive coefficient indicates a synergistic effect; meanwhile, a negative one reflects an antagonistic effect. The significance of individual coefficients was determined by ANOVA test, and one
was considered significant if the p value was < 0.05.A
backward elimination procedure was adopted to fit the data into different predictor equations. The quadratic models generated by regression analysis were used to construct the 3-dimensional graphs in which response parameter Y was represented by a curvature surface as a function of X.
Desirability function
For the purpose of finding the best compromising formulation for all responses, the multi criteria problem can be treated as a single criterion problem by using the desirability function approach. The desirability function combines all the responses into one variable to predict the optimum levels for the independent variables. A desirability value of 0 represents an unacceptable value for the responses, and a value of 1
represents the most desired value for the responses. [17]
The optimized formulation was obtained which have the maximum % CDR and solubility, constraints for responses and factors.
Preparation of Repaglinide solid dispersions
Solid dispersions containing repaglinide were prepared by solvent evaporation method. The polymer mixture consisting of PEG 8000, Gelucire 44/14 and Pluronic F127 was accurately weighed and dissolved in absolute ethanol to get a clear solution. Accurately weighed amount of drug was dissolved in the polymer solution and stirred on a magnetic stirrer (model 2 MLH, Remi motors, Mumbai) at room temperature for duration of 4 to 6 h. The solvent was removed under reduced pressure (100 mm Hg) in a rotary flash evaporator (Buchi type, Serve well instruments Inc., Bangalore) at an external maximum temperature of 40°C. The solid residue obtained was dried in a vacuum oven (Lab model, Serve well instruments Inc., Bangalore) at 30°C
for 24 h. The powder was passed through #44 mesh and stored in closed glass container. Twenty batches of solid dispersions (F1 to F20) were prepared as per experimental design by varying the polymer concentrations and maintaining the other experimental conditions constant
Determination of solubility
The saturation solubility studies were carried out to determine the solubility of pure drug and solid dispersions. Weighed amount of solid dispersions were added to 250 ml conical flasks containing 25 ml of distilled water. The sealed flasks were shaken for 24 hours at 37 ± 0.5ºC. Then aliquots were filtered through Whatman filter paper. The concentration of Repaglinide was determined by UV spectrophotometer at 237 nm.
Drug content of solid dispersions
Solid dispersions equivalent to 2 mg drug were taken and dissolved in minimum quantity of methanol and volume was made up to 50 ml. From this solution, 5 ml was taken and again diluted with methanol up to 50 ml. The samples were filtered through Whatman filter paper 0.45μm. The filtrate was analyzed using a UV spectrophotometer at 237 nm against a blank after appropriate dilutions (Model UV-1700, UV Visible spectrophotometer, Shimadzu, Kyoto, Japan). The polymers did not interfere with the drug extraction and determination at the specified wavelength.
In vitro dissolution studies of solid dispersions
In vitro release studies of repaglinide solid dispersions (equivalent to 2 mg repaglinide filled in hard gelatin capsule) were performed using USP XXII tablet dissolution test apparatus at the basket rotation speed of 75 rpm in 900 ml Phosphate buffer pH 6.8 at 37ºC. At the specified time intervals, 5 ml of samples were withdrawn, filtered and assayed for repaglinide using spectrophotometry method by measuring the absorbance at 237 nm. An equal volume of dissolution medium kept at the same temperature was added to maintain the sink conditions. Dissolution profiles of the formulations were analyzed by plotting drug release versus time.
Drug release kinetics
To elucidate the mode and mechanism of drug release, the data from the in-vitro release study were fitted into various kinetic models, like zero order, first order, Higuchi’s and Korsmeyer Peppas model.
FTIR Spectroscopy
FTIR Spectroscopy of Repaglinide was done by using FTIR Spectrophotometer (Schimadzu FTIR 8400S, Japan). The samples were scanned over wave number
region of 4000 to 400 cm-1 at resolution of 4 cm-1.
Samples were prepared using KBr (spectroscopic grade) disks with hydraulic pellet press at pressure of 7-10 tons.
X-Ray powder diffraction Studies (XRPD)
Int. J. Pharm. Sci. Drug Res. September-October, 2018, Vol 10, Issue 5 (362-371) diffractometer (Bruker D8 Advance) at a scan rate of 5
°/ min in the 2θ range from 2.5° to 60°.
Scanning electron microscopy
SEM (Jeol JSM 5600 LV, Jeol, Tokyo, Japan) was used to visualize the external and surface morphology of plain repaglinide and optimized SD formulation. The samples were coated with the platinum sputter coater 208 HR (Cressington Scientific Instruments Ltd., Watford, UK) to assure conductivity.
Stability Studies
Stability testing is an integral part of formulation development. It provides evidence on how the quality of a drug substance or a drug product varies with time under the influence of a variety of environmental factors. It establishes a re-test period for the drug substance or a shelf-life for the drug product and is used to recommend storage condition. The selected optimized formulations were packed in amber colored bottles, which were tightly plugged with cotton and capped with aluminum. They were then stored at 25ºC/ 60% RH, 30ºC/ 65% RH, & 40ºC/ 75% RH for 6 months and evaluated for their drug content and dissolution study.
Data analysis
Data are expressed as the means ± standard deviation (SD) of the mean and statistical analysis was carried out employing the one-way analysis of variance (ANOVA).
A value of p<0.05 was considered statistically
significant.
Pharmacokinetic study Animals
Healthy Wistar rats were (weighing 150-180 g) selected for this study, all the animals were healthy during the period of the experiment. All efforts were made to maintain the animals under controlled environmental conditions (Temperature 25°C, Relative Humidity 45% and 12 h alternate light and dark cycle) with 100% fresh air exchange in animal rooms, uninterrupted power and water supply and rabbits were fed with standard
diet and water ad libitum. The protocol of animal study
was approved by the institutional animal ethics committee (IAEC NO: IAEC/1657/CMRCP/T2/Ph D-16/64).
Study design
Rats were divided in to two groups at random and each group contains 6 rats. The rats were fasted for 24 hours prior to the experiments. After 4 hours of dosing, foods were reoffered. First group was administered with pure Repaglinide (as such) made suspension with 0.5% methocel and second group was administered optimized solid dispersions diluted in 0.5% methocel by oral route. Then, 500µL blood samples were collected from the femoral artery at certain times 0, 0.50, 1, 1.50, 2, 2.50, 3, 4, 5, 6, 8, 12, 16, 20, 24 hours post dose and transferred into Eppendorf tubes containing heparin in order to prevent blood clotting. Plasma was separated by centrifugation of the blood at 5000 rpm in cooling centrifuge for 5min to 10 minutes and stored
frozen at −20°C until analysis. [18]
Determination of Repaglinide in Rat plasma by HPLC method
Determination of Repaglinide and internal standard
Metformin by high performance liquid
chromatography using a RP-C18 chromatographic column, Phenomenex Kinetex (150 mm × 4.6 mm i.d) and the mobile phase consists of acetonitrile: phosphate buffer pH 4.0 at 60:40% v/v with 1% triethylamine at flow rate of 0.8ml/min and at fixed wavelength of 254 nm. On ten minutes of run time, Metformin was
retention at 5.1 and Repaglinide for 7.4 min. [19]
Pharmacokinetic analysis
The pharmacokinetic parameters employed to evaluate
were maximum plasma concentration (Cmax), time to
attain Cmaxi.e., Tmax and t½ values, area under plasma
concentration–time curve from zero to the last
sampling time (AUC0-t), area under plasma
concentration–time curve from zero to infinity (AUC
0-∞). AUC0-twas calculated by the linear trapezoidal rule
and AUC0-∞ from the following formula.
AUC0-∞ = AUC0-t + Ct / KE
The pharmacokinetic parameters were performed by a
non compartmental analysis using Win Nonlin 3.3®
pharmacokinetic software (Pharsight Mountain View, CA USA). All values are expressed as the mean ± SD. Statistical analysis was performed with Graph Pad InStat software (version 3.00, Graph Pad Software, San Diego, CA, USA) using one-way analysis of variance (ANOVA) followed by Tukey–Kramer multiple
comparison test. Difference with p<0.05 was
statistically significant.
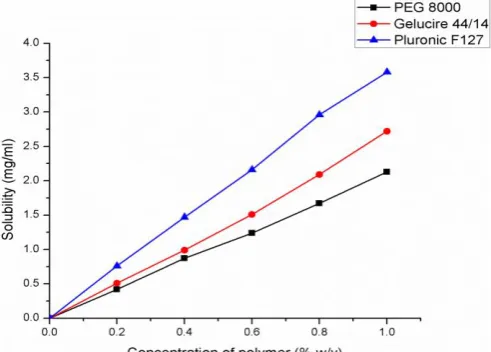
Fig. 1: Phase Solubility Diagrams of Repaglinide
RESULTS AND DISCUSSION
Preliminary solubility studies of Repaglinide
Int. J. Pharm. Sci. Drug Res. September-October, 2018, Vol 10, Issue 5 (362-371) all the carriers PEG 8000, Gelucire 44/14 and Pluronic F
127 have shown maximum increase in solubility.
Phase Solubility Studies
Phase-solubility diagrams (Figure 1) show that the concentration of repaglinide in pH 4.5 buffer increases as a function of increase in the concentration of PEG 8000, Gelucire 44/14 and Pluronic F127. All the curves obtained in the present studies are AL type because of
linear increase in solubility with the value of R2 closed
to unity. The solubility enhancement of repaglinide with various carries was found to be in the order of Pluronic F127> Gelucire 44/14> PEG 8000. At 1% w/v concentration of the polymer, Pluronic F127 showed 100-fold enhancements in the solubility of pure drug, attributable to be the micellar solubilization of drug.
Optimization of formulation variables
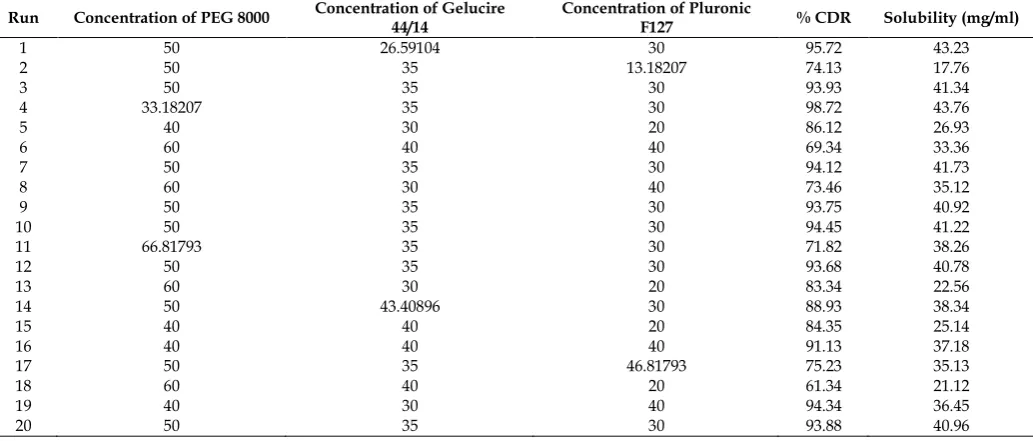
Through preliminary experiments the Concentration of PEG 8000 (A), Concentration of Gelucire 44/14 (B) and Concentration of Pluronic F127 (C) were identified as the most significant variables influence the % Cumulative drug release and solubility. The formulations were further optimized by considering the parameters like maximum CDR, and maximum solubility (Table 3). Twenty experiments were required for the response surface methodology based on the Central composite design. Based on the experimental design, the factor combinations yielded different responses as presented in Table 2. The polynomial equation, describing the % CDR as a simultaneous function of Concentration of PEG 8000 (A), Concentration of Gelucire 44/14 (B) and Concentration of Pluronic F127 (C). The equation represents the quantitative effect of process variables (A, B and C) and their interaction on the response Y1. The values of the coefficient A, B and C are related to the effect of these variables on the response Y1. Coefficients with more than one factor term and those with higher order terms represent interaction terms and quadratic relationship respectively.
The quadratic model generated revealed that A and B have significant negative effect on % CDR, where as C has a significant positive influence on the %CDR. Figure 2 shows the main effects, interaction effects and quadratic effects of Concentration of PEG 8000 (A), Concentration of Gelucire 44/14 (B) and Concentration of Pluronic F127 (C) on percent cumulative drug release (Y1). The Figure clearly shows that the Concentration of PEG 8000 (A), and Concentration of Gelucire 44/14 (B) have the main and the major effect on Y1. The Concentration of Pluronic F127 (C) has a moderate effect on Y1. A careful looking at the figure we can see that the concentration of PEG 8000 and Concentration of Gelucire 44/14 (B) have the negative effect on % CDR. The % CDR was found to increase from 71.82 to 98.72 as the concentration of PEG 8000 decreases from 66.8179 mg to 33.1821 mg. Similarly, the % CDR was found to increase from 88.93 to 95.72 as the concentration of Gelucire 44/14 decreases from 43.409 mg to 26.591 mg on the other hand the concentration of Pluronic F127 has the positive effect on % CDR. The % CDR was found to increase from 74.13 to 98.72 as the concentration of Pluronic F127 increases from 13.18207 mg to 30 mg. But at higher concentrations Pluronic F127 was found to have negative effect on % CDR. The Concentration of PEG 8000 (A) and Concentration of Gelucire 44/14 (B) were found to have significant negative interactive effect on % CDR.
The polynomial equation, describing the solubility as a simultaneous function of Concentration of PEG 8000 (A), Concentration of Gelucire 44/14 (B) and Concentration of Pluronic F127 (C).
Figure 3 shows the main effects, interaction effects and quadratic effects of Concentration of PEG 8000 (A), Concentration of Gelucire 44/14 (B) and Concentration of Pluronic F127 (C) on solubility (Y2).
Table 2: Factor combinations and response parameters of solid dispersions of Repaglinide prepared as per central composite design Run Concentration of PEG 8000 Concentration of Gelucire 44/14 Concentration of Pluronic F127 % CDR Solubility (mg/ml)
1 50 26.59104 30 95.72 43.23
2 50 35 13.18207 74.13 17.76
3 50 35 30 93.93 41.34
4 33.18207 35 30 98.72 43.76
5 40 30 20 86.12 26.93
6 60 40 40 69.34 33.36
7 50 35 30 94.12 41.73
8 60 30 40 73.46 35.12
9 50 35 30 93.75 40.92
10 50 35 30 94.45 41.22
11 66.81793 35 30 71.82 38.26
12 50 35 30 93.68 40.78
13 60 30 20 83.34 22.56
14 50 43.40896 30 88.93 38.34
15 40 40 20 84.35 25.14
16 40 40 40 91.13 37.18
17 50 35 46.81793 75.23 35.13
18 60 40 20 61.34 21.12
19 40 30 40 94.34 36.45
Int. J. Pharm. Sci. Drug Res. September-October, 2018, Vol 10, Issue 5 (362-371)
Design-Expert® Software % CDR
Design points above predicted value 98.72
61.34
X1 = A: Concentration of PEG 8000 X2 = B: Concentration of Gelucire 44/14 Actual Factor
C: Concentration of Pluronic F127 = 30.00
40.00 45.00
50.00 55.00
60.00 30.00 32.00
34.00 36.00
38.00 40.00 75
80 85 90 95 100
%
C
D
R
A: Concentration of PEG 8000
B: Concentration of Gelucire 44/14
Fig. 2: 3D-Response surface plot showing the influence of Concentration of PEG 8000 (A), Concentration of Gelucire 44/14 (B) on % CDR at constant level of C
Design-Expert® Software Solubility
Design points above predicted value 43.76
17.76
X1 = A: Concentration of PEG 8000 X2 = B: Concentration of Gelucire 44/14 Actual Factor
C: Concentration of Pluronic F127 = 30.00
40.00 45.00 50.00 55.00 60.00 30.00
32.00 34.00
36.00 38.00
40.00 37
38 39 40 41 42
S
o
lu
b
il
it
y
A: Concentration of PEG 8000 B: Concentration of Gelucire 44/14
Fig. 3: 3D-Response surface plot showing the influence of Concentration of PEG 8000 (A), Concentration of Gelucire 44/14 (B) on solubility at constant level of C
Design-Expert® Software Desirability
1
0
X1 = A: Concentration of PEG 8000 X2 = B: Concentration of Gelucire 44/14 Actual Factor
C: Concentration of Pluronic F127 = 32.80
40.00 45.00
50.00 55.00
60.00 30.00 32.00
34.00 36.00
38.00 40.00 0.5
0.6 0.7 0.8 0.9 1
D
e
s
ir
a
b
il
it
y
A: Concentration of PEG 8000
B: Concentration of Gelucire 44/14
0.957 0.957
Fig. 4: Response surface for overall desirability as a function of Concentration of PEG 8000 and Concentration of Gelucire 44/14 Repaglinide solid dispersions
The figure clearly shows that Concentration of PEG 8000 (A), and Concentration of Pluronic F127 (C) have the main and the major effect on Y2. The Concentration of Gelucire 44/14 (B) has a not having any effect on Y2. A careful looking at the figure we can see that the concentration of PEG 8000 has the negative effect on solubility. The solubility was found to increase from 38.26 mg/ml to 43.76 mg/ml as the concentration of PEG 8000 decreases from 66.8179 mg to 33.1821 mg. On the other hand the concentration of Pluronic F127 has the positive effect on solubility. The solubility was found to increase from 17.76 mg/ml to 41.34 as the
concentration of Pluronic F127 increases from 13.18207 mg to 30 mg. But at higher concentrations Pluronic F127 was found to have negative effect on % CDR. The relationship between solubility and independent variables was further elucidated using 3d response surface plots.
Numerical Optimization
Int. J. Pharm. Sci. Drug Res. September-October, 2018, Vol 10, Issue 5 (362-371) optimum solubility (%). depicts the constraints set and
the solution provided by the software with desirability value of 0.957. To verify these values, three confirmation batches were prepared according to the predicted levels of A, B and C. Obtained Y1 and Y2 values were in a close agreement with the predicted values (Table 5). This demonstrated the reliability of the optimization procedure in predicting the concentration of polymers for the formulation of solid dispersions. All the three batches of obtained repaglinide solid dispersions were subjected to further characterization (Figure 4).
Table 3: Optimization of Repaglinide solid dispersion Constraints
Name Goal Lower limit Upper Limit
Concentration of PEG 8000 In range 33.18207 66.81793
Concentration of Gelucire
44/14 In range 26.59104 43.40896
Concentration of Pluronic
F127 In range 13.18207 46.81793
% CDR Maximize
Solubility Maximize
Solution (Desirability value 0.957)
Concentratio n of PEG
8000
Concentratio n of Gelucire
44/14
Concentratio n of Pluronic
F127
% CDR Solubility (mg/ml)
40.00 30.00 32.80 97.9893 42.0483
Table 4: Solubility studies of Repaglinide in different polymers Sample
(Physical mixtures)
Drug &
Polymer ratios Solubility (mg/ml)
Pure Drug - 0.0354 ± 0.072
Drug: Pluronic F 127 1:1 3.587±0.21
Drug: Oleic acid 1:1 1.556±0.019
Drug: Captex 1:1 1.161±0.011
Drug : Gelucire 44/14 1:1 2.725±0.089
Drug : Kolliphor RH 40 1:1 1.215±0.023
Drug : Kolliwax GMS 2 1:1 1.067±0.067
Drug : PEG 6000 1:1 1.172 ±0.045
Drug: PEG 8000 1:1 2.131±0.056
Drug: Transcutol P 1:1 1.382±0.078
Drug: Propylene Glycol 1:1 1.536±0.081
Drug : Labrasol 1:1 1.872 ± 0.081
Drug : Labrafac PG 1:1 1.632 ± 0.0132
Drug : Labrafil M 1944 1:1 1.934 ± 0.027
Table 5: Optimized values obtained by the constraints applies on Y1 and Y2
Independent variable Nomi
nal value
s
Predicted
values Observed values %
CD R (Y1)
Solu bilit y (Y2)
Ba tch
Practi cal yield
(Y1) Parti
cle size (Y2)
Concentration of PEG
8000 40
97.9
893 42.0483
F1 98.12 41.732
Concentration of
Gelucire 44/14 30 F2 97.63 41.93
Concentration of
Pluronic F127 32.80 F3 97.91 41.262
Drug Content
The drug content ranged between 95.52 ± 0.1154% and 99.0 ± 0.938%. The results indicate that the processes
employed to prepare solid dispersions in this study were capable of producing formulation with uniform drug content.
Drug release study
Dissolution rates of repaglinide pure drug and solid
dispersion formulations were evaluated. All
formulations showed an increase in dissolution over pure drug repaglinide, which showed only ≈ 42% release after 60 min. The Relatively higher dissolution enhancement could be credited to more intimate drug carrier interaction during formulation of solid
dispersions. The In vitro drug release pattern of drug
from the optimized batches is as shown in Figure 5.
Fig. 5: In-vitro release of Repaglinide from solid dispersions
Release kinetics
Drug release data for optimized formulation was fitted into various kinetic equations to find out the order and mechanism of drug release. The correlation coefficient showed that the release profile followed the Korsmeyer
peppas model (R2= 0.98598), the release exponent, n
was found to be 0.563 indicating non Fickian (anomalous) transport.
Release data for optimized formulation (F1) was fitted into various kinetic equations to find out the order and mechanism of drug release. Kinetic analysis of drug release profiles showed that the systems predominantly released repaglinide in a non Fickian (anomalous) with
a strong correlation coefficient (R2= 0.98598) of
Korsmeyer peppas model.
From the above results it is apparent that the regression coefficient value closer to unity in case of Korsmeyer peppas model; indicates that the drug release exponentially to the elapsed time. This data indicates a lesser amount of linearity when plotted by the first order equation. Hence it can be concluded that the major mechanism of drug release follows zero order kinetics. Further, the translation of the data from the
dissolution studies suggested possibility of
Int. J. Pharm. Sci. Drug Res. September-October, 2018, Vol 10, Issue 5 (362-371) it is shown in Table 6. Further the n value obtained
from the Korsmeyer-Peppas plots i.e. 0.563 indicating non Fickian (anomalous) transport thus it projected that delivered its active ingredient by coupled diffusion and erosion.
Table 6: Release kinetics of optimized formulation of repaglinide solid dispersions (F1)
Formula tion Code
Zero Order First Order Higuchi Korsmeyer -Peppas
R2 n R2 N R2 n R2 n
F1 0.91306 1.6191 0.90812 0.025 0.96126 13.9388 0.98598 0.563
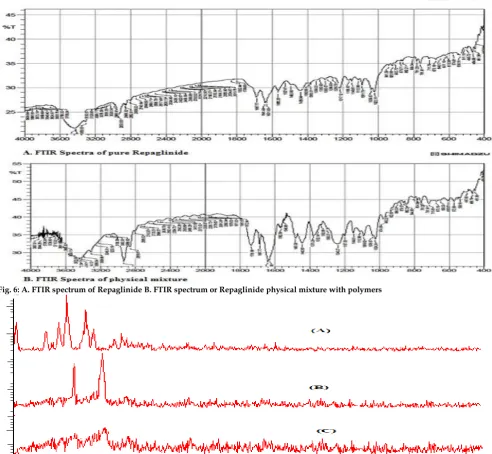
FT-IR studies
There is no significant change in the absorption bands, hence no interaction was observed between them. However, some additional peaks were observed with physical mixtures, which could be due to the presence of polymers (Figure 6).
Powder X-ray diffraction pattern
The X-ray diffraction patterns of the pure drug, physical mixture and final optimized formulation are shown in Figure 7 (a, b & c) respectively. The X-ray pattern of pure repaglinide revealed a drug fingerprint with intense and sharp peaks, indicating its crystalline nature as demonstrated by sharp peaks observed at 2, 12, 14, 17, 18, 19, 21, 23, 25, 26, 28, and 29°. There is a significant difference between the 2θ values of the pure drug and final optimized PSD formulation. A reduction in crystallinity was observed in the optimized formulation.
These data are indicative of the transformation of repaglinide from the crystalline to the amorphous state by formation of solid dispersion. The formation of an amorphous state proves that the drug was dispersed in
a molecular state with the polymers.
Fig. 6: A. FTIR spectrum of Repaglinide B. FTIR spectrum or Repaglinide physical mixture with polymers
Int. J. Pharm. Sci. Drug Res. September-October, 2018, Vol 10, Issue 5 (362-371)
Fig. 8: SEM of Repaglinide pure drug Fig. 9: Optimized formulation F1
Scanning electron microscopy
SEM studies were carried out on final optimized formulation to determine the surface morphology and intactness of the drug was observed. The solid dispersions were uniform size and spherical in shape with small porous and little rough surface was observed in optimized formulation. The rough surface is caused due to the rapid loss of moisture from the wet mass with the high liquid content that results in a porous surface structure (Figure 8 & 9).
Stability studies
There were no physical changes in appearance and flexibility. After subjecting the optimized formulation (F1) to the Accelerated Stability Studies, the results were shown that there were no major changes in Drug
Content, In vitro Drug Release and solubility studies.
Hence the formulation was found to be stable.
Pharmacokinetic study
Pharmacokinetic parameters comparison for pure drug suspension and solid dispersions
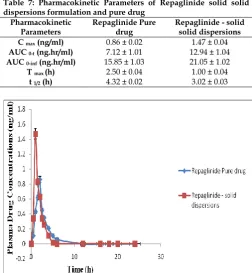
Figure 10 shows the plasma concentration–time curve in Wistar rats after a single oral dose of Repaglinide solid dispersions formulation as compared to Repaglinide pure suspension. At all the indicated time points, the Repaglinide plasma concentrations in rats treated with solid dispersions formulation were significantly higher than those treated with pure drug suspension. Plasma pharmacokinetic parameters of Repaglinide after oral administration of the two formulations to Wistar rats are shown in Table 7.
As can be seen from the above table, the test
preparation shows the increased AUC and Cmax. Cmax of
the solid dispersions formulation 1.47 ± 0.04 ng/ml was
significant (p<0.05) as compared to the pure drug
suspension formulation 0.86 ± 0.02 ng/ml. Tmax of both
solid dispersions formulation and pure drug suspension was 2.00 ± 0.04 and 1.00 ± 0.04 h, respectively. AUC is an important parameter in evaluating bioavailability of drug from dosage form, as it represents the total integrated area under the blood concentration time profile and represents the total amount of drug reaching the systemic circulation after
oral administration. AUC0-∞ inf for solid dispersions
formulation was higher (21.05 ± 1.02 ng hmL−1) than the
pure drug suspension formulation 15.85 ± 1.03 ng
hmL−1. Statistically, AUC0-t of the solid dispersions
formulation was significantly higher (p<0.05) as
compared to pure drug suspension formulation. Higher amount of drug concentration in blood indicated better systemic absorption of Repaglinide from solid dispersions formulation as compared to the pure drug suspension formulation.
Table 7: Pharmacokinetic Parameters of Repaglinide solid solid dispersions formulation and pure drug
Pharmacokinetic Parameters
Repaglinide Pure drug
Repaglinide - solid solid dispersions C max (ng/ml) 0.86 ± 0.02 1.47 ± 0.04 AUC 0-t (ng.hr/ml) 7.12 ± 1.01 12.94 ± 1.04 AUC 0-inf (ng.hr/ml) 15.85 ± 1.03 21.05 ± 1.02
T max (h) 2.50 ± 0.04 1.00 ± 0.04
t 1/2 (h) 4.32 ± 0.02 3.02 ± 0.03
Fig. 10: Plasma concentration profiles of Repaglinide solid dispersions and pure drug
Int. J. Pharm. Sci. Drug Res. September-October, 2018, Vol 10, Issue 5 (362-371) consisting of a 3-factor, 3-level rotatable central
composite design (CCD) was employed to study the effect of each independent variable on dependent variables which are percent CDR and solubility and formulation F1 was found to be optimized which has
shown enhanced solubility and significant
improvement in the rate of drug release. From powder X-ray diffraction (p-XRD) and by scanning electron microscopy (SEM) studies it was evident that polymorphic form of Repaglinide has been converted into an amorphous form from crystalline within the solid dispersion formulation. The correlation coefficient showed that the release profile followed Higuchi model anomalous behavior and hence release mechanism was indicative of diffusion. From in vivo studies, the
AUC0→24 h and peak plasma concentration (Cmax) was
doubled when compared with pure drug. Finally, it could be concluded that solid dispersion of Repaglinide using novel carriers would improved the aqueous solubility, dissolution rate and thereby enhancing its systemic availability.
REFERENCES
1. Verma S, Rawat A, Kaul M, Saini S. Solid dispersion a
strategy for solubility enhancement. Int J Pharm Tech. 2011; 3: 1062–99.
2. Van de Waterbeemd H. The fundamental variables of the bio
pharmaceutics classification system a commentary. Eur J Pharm Sci. 1998; 7:1–3.
3. Leuner C, DressmanJ. Improving drug solubility for oral
delivery using solid dispersions. Eur. J. Pharm. Biopharm. 2000; 50 (1): 47 – 60.
4. Wagh VT, Jagtap VA, Shaikh TJ, Nandedkar SY. Formulation
and Evaluation of Glimepiride Solid Dispersion Tablets for Their Solubility Enhancement. J. Adv. Sci. Res. 2012; 3(4): 36-41.
5. Pouton CW. Formulation of Poorly water-soluble drugs for
oral administration Physicochemical and physiological issues and the lipid formulation classification systems. Eur. J. Pharm. Sci. 2006; 29: 278-87.
6. Koh PT, Chuah JN, Talekar M, Gorajana A, Garg S.
Formulation development and dissolution rate enhancement
of efavirenz by solid dispersion systems. Indian. J. Pharm. Sci. 2013; 75(3): 291-301.
7. Ha ES, Choo GH, Baek IH, Min-Soo, Kim. Formulation
Characterization and In Vivo Evaluation of Celecoxib-PVP Solid Dispersion Nano particles Using Supercritical Antisolvent Process Molecules. 2014; 19:20325-20339.
8. Serajuddin ATM. Solid Dispersion of Poorly Water-Soluble
Drugs Early Promises Subsequent Problems and Recent Breakthroughs. J. Pharm. Sci. 1999; 88 (10): 1058-1066.
9. Manvi P, Narendra P, Bhaskar VH. Preparation
Characterization and In Vitro Evaluation of Repaglinide
Binary Solid Dispersions with Hydrophilic Polymers. Int. J. Drug. Devel. Res. 2011; 3 (2):111-121.
10. Culy C, Jarvis B. Repaglinide a review of its therapeutic use
in type 2 diabetes mellitus. Drugs. 2001; 61:1625–1660
11. Malaisse W, Repaglinide. A new oral anti diabetic agent a
review of recent preclinical studies. Eur J Clin Invest. 1999; 29:21–29.
12. Purvis T, Mattucci ME, Crisp MT, Johnston KP, Williams RO.
Rapidly dissolving repaglinide powders produced by the ultra-rapid freezing process. AAPS Pharm Sci Tech. 2007; 8(3): E1 - E9.
13. Ahuja N, Katare OP, Singh B. Studies on dissolution
enhancement and mathematical modeling of drug release of a poorly water-soluble drug using water-soluble carriers. Eur. J. Pharm. Biopharm. 2007; 65: 26–38.
14. Guyot M, Fawaz F, Bildet J, Bonini F, Lagueny AM.
Bioavailability of norfloxacin from PEG 6000 solid dispersion and cyclodextrin inclusion complexes in rabbits. Int. J. Pharm. 1995; 123: 53-63.
15. Kim EJ, Chun MK, Jang JS, Lee IH, Lee KR, Choi HK.
Preparation of a solid dispersion of felodipine using a solvent wetting method.Eur. J. Pharm. Biopharm. 2006; 64: 200 -205.
16. Vippagunta SR, Maul KA, Tallavajhala S, Grant DJW.
Solid-state characterization of nifedipine solid dispersions. Int. J. Pharm. 2002; 236: 111–123.
17. Nauna Kettanech-Wold. Use of Experimental Design in the
Pharmaceutical Industry. Journal of Pharmaceutical and Biomedical Analysis. 1991; 9(8): 605-610.
18. Zerrouk N, Chemtob C, Arnaud P, Toscani S, Dugue J. In
vitro and in vivo evaluation of carbamazepine-PEG 6000 solid dispersions. Int J Pharm. 2001; 225(1-2):49-62.
19. Ramanji Reddy T, Dhachinamoorthi D, Chandra Sekhar KB.
Development of RP-HPLC method for Metformin and Repaglinide in rabbit plasma. Int J Pharm Pharm Sci. 2002; 4(2): 311-313.