Relevance of Sustainability Measurement Instruments
Under the Viewpoint of the Sustainability Dimensions
Ubiratan Rohan; Clézio Thadeu de Souza Dutra; Carlos Alberto Pereira Soares
Graduate Program in Civil Engineering, Fluminense Federal University, Passo da Pátria Street, 156, Niterói, Brazil, 24210-240
Abstract--
This article presents the relevance of Ecological Footprint, Dashboard of Sustainability, Barometer of Sustainability e PSR - Pressure, State, Response under the viewpoint of the sustainability dimensions. We developed a field research in which we identified the perception of experts related to the relevance of sustainability measurement instruments for Environmental, Economic and Social dimensions. The results showed similar agreements of the experts with those identified in the literature. The Dashboard of Sustainability and the Pressure, State, Response were considered as high relevance for all dimensions. This result confirms the efficiency of these instruments to show that the dimensions of sustainability do interact during the evaluation of sustainability of a system. The environmental Footprint was considered of high relevance for the Environmental dimension and of low relevance for the other dimensions. The Barometer of Sustainability was considered of high relevance for Environmental and Social dimensions and of moderate relevance for the Economic dimension. The four Instruments for measurement of Sustainability contributed for environment preservation, and sustainability, therefore contributing also for managers and society.
Index Term-- Ecological Footprint; Dashboard of Sustainability; Barometer of Sustainability; Pressure, State, Response; Measurement of sustainability.
1. INTRODUCTION
Environmental problems due to consumption patterns greater than the renewal capacity of the planet has led the sustainability issue to be repeatedly discussed on the agenda of the nations.
The attention of the issue of sustainability has grown more and more every day in society. Several Conferences and agreements have been signed by country‟ representatives, so that they have decided to reach goals and objectives aimed at improving sustainable development. The most discussed issue on the subject of sustainable development nowadays is sustainable environment. A very great issue bohth from technical as well theoric viewpoints related to economic, social and environmental dimensions [2].
Environmental damage caused by developing models have been perceived by scientists. Anthropogenic interferences in agriculture, industry, urbanization aimed at improving mankind conditions in the planet have affected biomes and turning important biodiversity areas into several economic application regions [2]. Therefore, we must face the impacts caused by antropic opressions over the environment.
Sustainability, a repeatedly discussed concept, has caused the need to think about new developing models for reusing natural resources, which we knew that are finite, to discuss the technological development in the last decades [3].
The search for balance on the economic growth and natural maintained resources has strenghtened the importance of sustained development [4].
The question of evaluating sustainability is to use instruments that clear up the complexity of development showing the meaning of the system components. It is relevant that the developing models benefit a large amount of the population, therefore improving the social and environmental development in the region [5].
Within this context, the measurement of a regions‟ sustainability has been a recurring theme in discussions about the environment, being it usually related to obtaining measurements by monitoring the current situation, aiming the achievement of pre-established sustainability goals, and more notably those related to the conservation of the environment. Several models of sustainability measurement were developed to identify specific characteristics of applicability [6]. Normally, they enable the development of environmental indicators that represent a set of data, information and knowledge about a certain environmental phenomenon. Being able to express and communicate in a simple and objective manner is the essential characteristic and the meaning of the referred phenomenon, furthermore providing an assessment of the environmental reality and its changing trends [7].
This article studies the relevance of Ecological Footprint, Dashboard of Sustainability, Barometer of Sustainability and Pressure, State, Response – PSR, through the viewpoint of the sustainability dimensions.
The sustainability measurement instruments (SMI) were selected according to their citations in the literature as important instruments for the measurement of sustainability.
Footprint concept provides an intuitive framework for understanding the ecological bottom-line of sustainability” [13]
Dashboard of Sustainability: The Dashboard of Sustainability aims to assess the sustainability of a system in terms of economic, environmental, social and institutional dimension [14]. It uses a graphic interface similar to a car dashboard, with four dials representing the referred dimensions in an interrelatedmanner [14] [15].
Barometer of Sustainability: This tool is used with the main intention of evaluating the sustainability of a particular region [16]. The Barometer shows its results through an index generated by a combination of indicators [11]. The indices are presented using a graphical interface that synthesizes the results and facilitates the understanding. It works with human and environmental subsystems, on which are calculated the "Ecological Well-being Index" and the "Human Well-being Index".
Pressure, State, Response: It is based on the principle that activities exert pressure on the environment, changing its status by altering the quality and quantity of natural resources [4][17]. Subsequently, society answers through environmental, economic or sectorial policies. Thereby, PER gathers indicators on the following categories [7] [18]: a) Pressure: the environmental pressure index represents the pressure that human activities put on the local environment; b) State: the indicators of State - or environmental condition - express the quality of the environment as well as the amount and quality of the natural resources through quantitative and qualitative information; c) Response: the analysis of Response is composed by indicators that point the extension and intensity of society‟s individual and collective reactions regarding the modification of environmental conditions.
2. MATERIALS AND METHODS
The field research was done to identify the experts perception of the importance of measuring instruments for sustainability of environmental, economic and social dimensions.
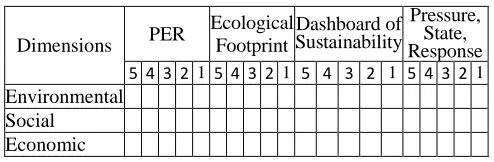
The data collection instrument was a questionnaire containing the following question, in which experts to each one of the sustainability measurement instrument, respondents expressed
the relevance degree, according to a Likert scale of five points - ranging from Very low relevance to Very high relevance:
Question: Indicate the degree of instrument relevance for assessing the sustainability dimensions using the following scale:
[5] Very high relevance, [4] High relevance, [3] Average relevance, [2] Low relevance, [1] Very low relevance
Dimensions PER
Ecological Footprint
Dashboard of Sustainability
Pressure, State, Response
5 4 3 2 1 5 4 3 2 1 5 4 3 2 1 5 4 3 2 1 Environmental Social Economic
A questionaire was sent to 420 Brazilian experts and researchers working on private or government institutions and 49 of them did accepted to take part on the research. A pretest was conducted with two experts in order to identify possible doubts.
In order to verificate the questionnaire's internal consistency, the Cronbach's alpha coefficient was used for the questions about the sustainability guidelines.
The application used to analyze and visualize Likert type items was the "R", a free environment software for statistical computing and graphics through R Likert Package [19], which makes parametric tests in Likert scale [20][21][22][23][24], using principles set out by Speerschneider and Bryer [19] and Wakita et al [25]
3. RESULTS AND DISCUSSION
Table I presents the values of Cronbach‟s Alpha referring to the relevance of the instrument results for the economic, social and environmental dimensions.
As we can see on Table I Cronbach‟s Alpha values for the Environmental dimension and for the Economic dimension, are adequate results, since they are equal or higher than 0.7.
Table I
Cronbach‟s Alpha referring to the relevance of SMI for the economic, social and environmental dimensions
Itens Cronbach´s Alpha
Environmental dimension 0,8
Social dimension 0,5
Economic dimension 0,7
As for the Social dimension the Cronbach‟s Alpha value was low. This fact is due to the variation of the Ecological Footprint data. If these data were removed, the value of
the relevance of the results for the use of SMI for the Social dimension of sustainability.
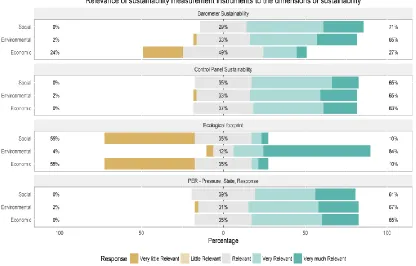
Table II and Figure 1 present the results referring to the environmental social and economic dimensions. In figure 1 the values to the left side of the bars represent the low relevance
(very low relevance and low relevance of percentages). The values the to the right side of the bars represent the high relevance (Addition of very high relevance and high relevance). In the center of the bars we see the values referring to the average relevance.
Table II
Relevance of SMI under the viewpoint of the sustainability dimensions
Item Dimensions of
sustainability
Relevance degree
Low (%)
Medium (%)
High (%)
Barometer of Sustainability
Environmental 2 33 65
Economic 24 49 27
Social 0 29 71
Dashboard of Sustainability
Environmental 2 33 65
Economic 0 37 63
Social 0 35 65
Ecological Footprint
Environmental 4 12 84
Economic 55 35 10
Social 55 35 10
Pressure, State, Response
Environmental 2 31 67
Economic 0 35 65
Social 0 39 61
Fig. 1. Relevance of SMI under the viewpoint of the sustainability dimensions
Ecological Footprint was considered the most relevant value for the Environment dimension (84%). The Barometer of
considered the most relevant value for the Economic dimension (65%).
Considering the medians for each of these instruments we see that the Dashboard of sustainability and the Pressure, State, Response was considered of high relevance for all dimensions. The Ecological Footprint was considered of high relevance for the Environmental dimension and of low relevance for other dimensions.
The Barometer of sustainability was considered of high relevance for Environmental and Social relevance, but of moderate relevance for the Economic dimension.
The results referring to Dashboard of Sustainability, the Ecological Footprint, and to Pressure, State, Response confirm what is found in the literature. As for the Barometer of Sustainability, it was developed for the objective of evaluating environment and social subsystems, generating the welfare ecological index and also the well-being index. However, some index considered for these instruments can provide information related to the economy and therefore some people considered the instrument relevant for the Economic dimension.
4. CONCLUSIONS
Estimates of the trend to consumption increase, combined with the exhaustion of natural resources, demand more sustainable development, as well as new instruments for accurate measurements.
Development should consider sustainability, according to environmental , economic and social dimensions.
In this condition, the increasing demand for information about sustainability, has generated several studies on quantitative and qualitative sustainability with many important applications .
The four measurement instruments for sustainability presented in this research have validated conditions that can contribute for environmental improvement and sustainability development.
Although the four instruments contribute to the conservation of the environment, the limitations of its features reinforce the difficulty of having a tool that reflects the holistic nature of sustainability in all its breadth.
The Dashboard of Sustainability and the Pressure, State, Response instruments were considered by the researchers respondents to the questionnaires as high relevants for all dimensions. Therefore we can consider the efficiency of such instruments, to show that sustainability dimensions interact for the evaluation of sustainability in a system.
O Ecological Footprint was considered of high relevance for Environmental dimension and low relevance for other dimensions. This may be considered a limitation. However, characteristics considered by many as limitations may, depending on the focus, be taken as potential. This is the case of the Ecological Footprint Method, on which the fact of having a focus only on the ecological dimension is identified as a limitation, but on the other hand reinforces the educative role of the instrument to present to our society the level of pressure that it exerts on the environment.
REFERENCES
[1] Cruz, A.A.. Indicadores de sustentabilidade: estudo de caso em propriedades produtoras de leite nas regiões sul e sudeste do Brasil utilizando a metodologia RISE . 2013 .Dissertação (Mestrado).- Escola Superior de Agricultura Luiz de Queiroz. Piracicaba, 2013.
[2] Cardoso, J.C; Silva, J.A.T; Vendrame, W.A. Impacts of deforestation on some orchids of São Paulo State. Natureza & Conservação v.14, n. 1, 2016, p. 28–32.
[3] Araújo, A. J. V. B. Sustentabilidade na indústria da construção sob a ótica da liderança. Universidade Federal Fluminense. Niterói- RJ. 2015 [4] Kemerich, P.D.C; Ritter, L.G; Borba, W.F. Indicadores de
sustentabilidade ambiental: métodos e aplicações. Revista Monografias Ambientais – REMOA, v. 13, n. 5, 2014, p. 3723-3736.
[5] Malheiros, T. F.; Philippi Jr., A.; Coutinho, S. M.V. Agenda 21 nacional e indicadores de desenvolvimento sustentável: contexto brasileiro. Revista Saúde e Sociedade, São Paulo, v. 17, n. 1, 2008, p. 7-20
[6] Marzal, K; Almeida, J. Indicadores de sustentabilidade para agroecossistemas: Estado da arte, limites e potencialidades de uma nova ferramenta para avaliar o desenvolvimento sustentável. Cadernos de Ciência & Tecnologia, Brasília, v.17, n.1, 2000, p. 41-59.
[7] SEI - Superintendência de Estudos Econômicos e Sociais da Bahia. Indicadores de sustentabilidade ambiental. SEI & UFBa. (Série estudos e pesquisas, 75). Salvador, 2006.
[8] Froehlich, C. Sustentabilidade: dimensões e métodos de mensuração de resultados. Desenvolve: Revista de Gestão do Unilasalle, v. 3, n. 2, 2014, p. 151-168.
[9] Van Kooten, G.C, Bulte, E.H. The ecological footprint: useful science or politics. Ecological Economics, v. 32, n.3. 2000, p. 385 -389. [10] Lozano, M.C.; Teixeira, B.A.N. Barômetro da Sustentabilidade, Painel
de Sustentabilidade e Pegada Ecológica: a abordagem da gestão de resíduos sólidos na avaliação da sustentabilidade. In XIV ENTAC - Encontro Nacional de Tecnologia do Ambiente Construído. UFSC, Juiz de Fora ,2012.
[11] Van Bellen, H. M. Indicadores de Sustentabilidade: Uma análise comparativa. Universidade Federal de Santa Catarina. Santa Catarina, 2002. (Tese de Doutorado).
[12] Farsari Y; Prastacos, P. Sustainable Development Indicators: An Overview. In: International Conference Citizens, Sustainable Development, Environment, Foundation for Mediterranean Cooperation, Athens, Greece, 2002.
[13] Van den Bergh, J.C.J.M; Verbruggen, H. Spatial sustainability, trade and indicators: an evaluation of the „ecological footprint‟. Ecological Economics, v. 29, 1999, p. 61–72.
[14] Fonseca, C.A.G.M. Índice de Sustentabilidade Municipal: um instrumento de avaliação da qualidade de vida nos municípios brasileiros. Universidade de Brasília, Brasília, 2010. Dissertação de Mestrado.
[15] Campos, C.A; Ribeiro, F.R. Aplicação da ferramenta Dashboard of Sustainability no processo de avaliação do desenvolvimento sustentável na agricultura familiar. In: Anais do XLV Congresso da SOBER, Londrina, Paraná, 2007.
[16] Kronemberger, D.M.P.; Junior, J.C.; Nascimento, J.A.C. ; Collares, J.E.R.; Silva, L.C.D. Desenvolvimento sustentável no Brasil: uma análise a partir da aplicação do barômetro da sustentabilidade. Sociedade & Natureza, Uberlândia, v. 20, n. 1, 2008, p. 25-50. [17] Organização para a Cooperação e Desenvolvimento Econômico. Rumo
a um desenvolvimento sustentável: indicadores ambientais. OCDE, Tradução Ana Maria S. F. Teles. Salvador: CRA, 2002. 224 p. (Série cadernos de referência, 9).
[18] Carvalho, P.G.M; Barcellos, F; Green, A; Oliveira S. Indicadores para a avaliação da gestão ambiental municipal com base no modelo Pressão-Estado–Resposta. In: XVI Encontro Nacional de Estudos Populacionais, Caxambú, MG, 2008.
[19] Speerschneider, K. K.; Bryer, J. M. Likert: An R Package for Visualizing and Analyzing Likert-Based Items. In The R User Conference, 2013.
[20] Boone, H. N., & Boone, D. A. Analyzing likert data. Journal of extension, 50 (2), 2012, P 1-5.
[22] Carifio, J., & Perla, R. Resolving the 50 year debate around using and misusing Likert scales. Medical education, 42 (12), 2008, p. 1150-1152. [23] Clason, D. L., & Dormody, T. J. Analyzing data measured by individual Likert-type items. Journal of Agricultural Education, 35 (4), 1994, p.31-35
[24] Sisson, D. V., & Stocker, H. R. Research corner: analyzing and interpreting Likert-type survey data. Delta Pi Epsilon Journal, 31(2), 1989, p. 81-85.