Pharmacophore 2014, Vol. 5 (2), 279-286 USA CODEN: PHARM7 ISSN 2229-5402
Pharmacophore
(An International Research Journal)Available online at http://www.pharmacophorejournal.com/
Original Research Paper
DEVELOPMENT AND VALIDATION OF RP-HPLC METHOD FOR THE
SIMULTANEOUS ESTIMATION OF CHLORTHALIDONE AND IRBESARTON
IN PHARMACEUTICAL DOSAGE FORM
Kalaiselvi P
1and
Lalitha K G
2*
1
Department of Pharmaceutical Chemistry, JKKMMRF College of Pharmacy,
B. Komarapalayam-638183, Tamil Nadu, India
2
Department of Pharmaceutical Chemistry, ULTRA College of Pharmacy, Madurai-625
020, Tamil Nadu, India
ABSTRACT
A Simple precise and accurate method was developed and validated for the simultaneous analysis of chlorthalidone and irbesarton in tablet formulations. The method has been shown adequate separation of the two ingredients from each other. The chromatographic separation was achieved on a reverse phase column C18 (250 mm x 4.6 mm, 5µ), in a mobile phase consisting of 0.02 M ammonium phosphate buffer (adjusted
to pH 5.5 with triethyl amine), acetonitrile and methanol in the ratio (40:40:20, v/v/v) at a flow rate of 1 ml/min with UV detection at 220 nm. This new method was validated, which include assay determination, accuracy, precision, selectivity, linearity and range, robustness and ruggedness. The current method demonstrates good linearity over range of 40-60% µg/ml of chlorthalidone with r2 =0.9991 and in the range of 480 - 720 % µg/ml of irbesarton with r2 = 0.9990. The average recovery of the method is 99.22 % µg/ml and 102.28 % µg/ml for chlorthalidone and irbesarton, respectively. The degree of reproducibility of the results obtained as a result of small deliberate variations in the method parameters and by changing analytical operator indicating that the method was found to be sufficiently robust and rugged. A simple, accurate, precise RP-HPLC method was developed and validated for the simultaneous determination of chlorthalidone and irbesarton in tablet formulation.
Keywords:
Melatonin, Zolpidem, Simultaneous equation method, Method Validation, ICH guidelines.INTRODUCTION
Chlorthalidone (CHL) is oral diuretic oral antihypertensive agent which is chemically described as (RS) 2-chloro-5-(1-hydroxy-3-oxo-2,
3-dihydro-1H-isoindol-1-yl)
benzene-1-sulfonamide (figure 1a).1 Irbesartan (IBS) is an Angiotensin II blocker is indicated for the treatment of hypertension, chemically 2- butyl-3-[[2-(1H-tetrazol-5-yl)[1, 1- biphenyl]-4-yl] methyl1, 3-diazaspiro [4, 4] non-1-en-4one (figure 1b).7 Literature survey revealed that CHL can be estimated by spectrophotometry2, RP-HPLC3-5
estimation CHL and IBS in combined tablet dosage forms by RP- HPLC method and to validate the method as per International Conference on Harmonization (ICH) guidelines14, and FDA guidelines.15
MATERIALS AND METHODS
Instrumentation and Chromatographic Conditions
The HPLC system, used for the method development (Shimadzu corporation Kyoto Japan) LC-2010AT HPLC pump, SPD-20A UV detector, Rheodyne injector and Spinchrome software. Chromatographic separation was performed isocratically at room temperature using C18
column (Enable C18 G) (250 mm x 4.6mm, 5µ) as
a stationary phase with mobile phase composition of 0.02 M Ammonium phosphate buffer (pH 5.5 was adjusted with triethyl amine), acetonitrile and methanol (40:40:20,v/v/v) at a flow rate of 1 mL/ min. The injection volume was 20 µL. Eluent was monitored by a UV detection at 220 nm.
Chemical and Reagents
HPLC grade acetonitrile and methanol were purchased from Merck India Limited (Mumbai, India). Water HPLC grade was obtained from a Milli-Q water purification system was used throughout the analysis. Analytical regent grade triethylamine was purchased from fine chemicals (Mumbai, India), pure drug sample of CHL, % purity 99.36% and IBS, % purity 99.77% were kindly supplied as a gift sample by GKN New Pharma, Pondicherry. These samples were used without further purification. The tablet formulation (ESART/CT) was used for analysis (containing CHL 12.5 mg and IBS 150 mg).
Standard Solutions and HPLC Conditions
Standard stock solution was prepared by dissolving 25.6 mg of CHL and 300.4 mg of IBR dissolved in 100 ml of mobile phase. Working standard solution was prepared by diluting 5 ml of standard solution to 25 ml with mobile phase to obtain a known concentration of 50 µg /ml of CHL and 600 µg/ml of IBR. Sample stock solutions of the formulation (Brand Name-ESART/CT) was prepared by dissolving a quantity of the powdered tablet equivalent to 300
mg of IBR in 100 ml of mobile phase and further diluted to get the same concentration as in the standard solution.
RESULTS AND DISCUSSION
Method DevelopmentPreliminary studies involved trying C18 and C8
columns and testing several mobile phase containing buffers like phosphate and acetate with different pH (4 to 8) and using organic modifiers like acetonitrile, methanol. For the effective separation CHL and IBS C18 (250x4.6mm, 5µ)
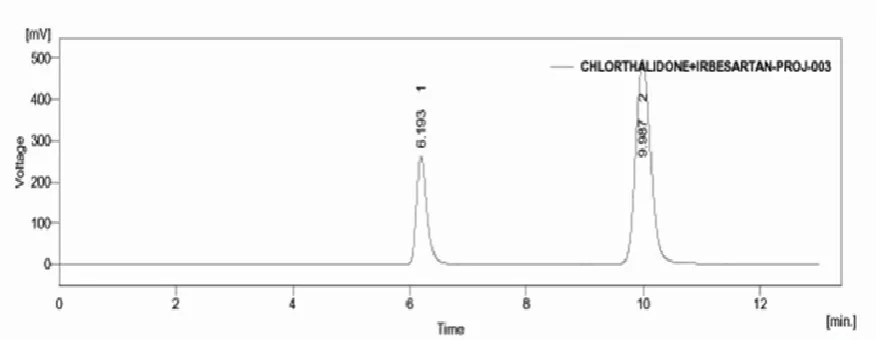
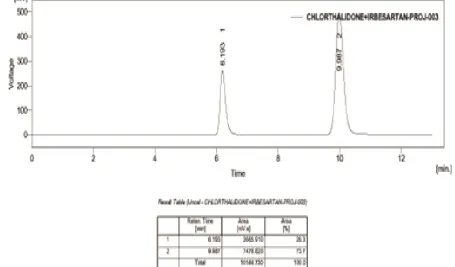
column was selected with mobile phase composition by ammonium phosphate buffer (adjusted pH 5.5 with triethylamine) acetonitrile and methanol (40:40:20, v/v/v) at) at a flow rate of 1 ml/min and a detection wavelength of 220 nm afforded the best separation of these analytes, (figure 2 and table 2). In this developed method for assay of CHL and IBS no internal standard because no extraction or separation step was involved. Peak shape of the CHL and IBS were found to be symmetrical in this optimized chromatographic conditions. Good separation is seen as retention times of CHL and IBS were 6.183 and 9.98 min, respectively, with resolution factor greater than 5. The results of the analysis of the tablet formulations are reported in (table 1)
Method Validation
After method development, the validation of the developed method has been performed in accordance with ICH guidelines which include accuracy, precision, selectivity, linearity and range, limit of detection and limit of quantization, robustness and ruggedness.
Linearity and range
To evaluate linearity of the method, different concentrations of the two analytes in the range of 40-60 µg/ml for CHL and 480-720 µg/ml for IBS were analyzed and the linearity between the peak area and the concentration was examined for each analyte. The results obtained show that the current method is linear for the ranges specified above with a correlation coefficient were found to be above 0.9990, (figure 3a &3b), (table 2).
The accuracy of the method was determined by recovery study, which was determined by spiking the sample with 80%, 100% and 120% concentration raw material. The mixture was analysed by the proposed method the experiment was performed in triplicate and recovery (%) RSD and standard error of mean (SEM) were calculated. Results have shown that the RSD was found to be less than 2 %, (table 3).
Precision
System precision
The system precision of this method was evaluated by the calculating % RSD of the peak areas of six replicate injections of the standard solution, which was found to be 1.09 % and 0.320% for CHL and IBS respectively, (table 4).
Method precision
The method precision of this method was evaluated by the calculating % RSD of the peak areas of six replicate injections of the sample solution, which was found to be 1.10 % and 0.23 % for CHL and IBS (table 4). These results showed that the current method is repeatable.
Selectivity
Selectivity of the current method was demonstrated by good separation of the two analytes from each other. Furthermore, excipient of the tablet formulation did not interfere with the active ingredients of the drug product.
Limit of detection and Limit of quantization
Limit of detection (LOD) and limit of quantization (LOQ) were estimated from the signal-to-noise ratio. The detection limit was determined as the lowest concentration level resulting in a peak area. With signal-to-noise ratio of 3. The quantization limit was determined as the lowest concentration level that provided a peak area with signal-to-noise ratio of 10, (table 2).
Robustness and ruggedness
Robustness of an analytical method is a measure of its capacity to remain unaffected by small but deliberate variations in method parameters, and provides an indication of its reliability during normal usage. Robustness of the current method was investigated by analysing samples of the drug product using the same chromatographic conditions, method development but with a small change in the following chromatographic parameters (a) flow rate: 0.8 and 1.2 ml/min instead of 1.0 ml/min, (b) detection wavelength 218 and 222 nm instead of 220 nm (c) pH 5.3 and pH 5.7 instead of pH 5.5 %. The RSD of CHL and IBS were calculated under these conditions and found to be less than 2 %, (table 5). The ruggedness of the current method was estimated by carrying out the experiment as per proposed method in duplicates using different column and analyst on different days. The method was carried out on INERTSIL-ODS C18 and
phenomenex-Gemini C18 column. It was observed that were no
marked changes in the chromatograms and the RSD was found to be less than 2 % CHL and IBS, respectively which demonstrated that the RP-HPLC method developed was sufficiently robust for normal expected variations in chromatographic conditions (table 6).
System Suitability
To know reproducibility of the method system suitability test was employed to establish the parameters such as tailing factors, theoretical plates, repeatability and resolution.
CONCLUSION
A simple, accurate, precise RP-HPLC method was developed and validated for the simultaneous determination of CHL and IBS in combines tablet form.
(1a) Chlorthalidone (1b) Irbesartan
Figure 2: The typical chromatogram of Chlorthalidone and Irbesartan in tablet dosage form
Figure (3a): Linearity of Chlorthalidone
Figure (3b): Linearity of irbesarton
Figure 3 (a&b): Linearity curve of chlorthalidone and irbesarton
Table 1: The estimation of chlorthalidone and irbesarton in tablet dosage form Drug Label claim Amount present %Assay
Chlorthalidone 12.5mg 12.81±0.25 102.57±0.85
Irbesarton 150mg 149.34±0.25 99.15±0.97
y = 52.783x + 26.315 R² =0.9990
0 1000 2000 3000 4000
0 50 100
ar
e
a
conc
linearity of chlorthalidone
y = 12.406x - 1.5048 R² = 0.9996
0 5000 10000
0 200 400 600 800
ar
e
a
conc
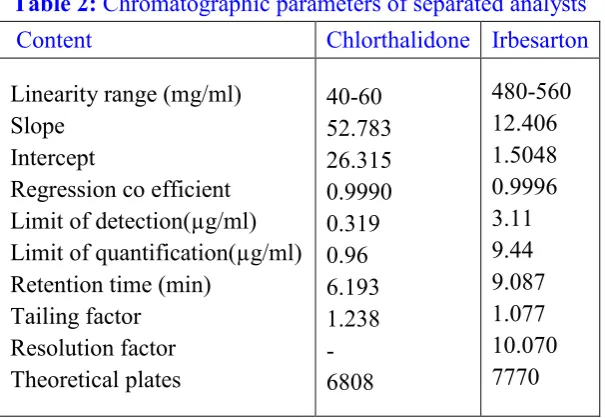
Table 2: Chromatographic parameters of separated analysts
Content Chlorthalidone Irbesarton
Linearity range (mg/ml) Slope
Intercept
Regression co efficient Limit of detection(µg/ml) Limit of quantification(µg/ml) Retention time (min)
Tailing factor Resolution factor Theoretical plates
40-60 52.783 26.315 0.9990 0.319 0.96 6.193 1.238 - 6808
480-560 12.406 1.5048 0.9996 3.11 9.44 9.087 1.077 10.070 7770
Table 3: Accuracy (%recovery) of Chlorthalidone and Irbesarton in tablet formulation
Sr. No Chlorthalidone Irbesarton
Recovery Avg area Amount
recovery % Recovery Recovery Avg area
Amount
recovery % Recovery
1 80% 2135.814 10.20 102.00 80% 5972.268 119.82 99.86
2 100% 2656.831 12.70 101.50 100% 7417.469 148.83 99.22
3 120 3174.550 15.04 102.28 120% 8924.842 179.08 99.48
Table 4: Precision studies Method precision
Drug Assay 1 Assay 2 Assay 3 Assay 4 Assay 5 Assay 6 Average %RSD
CHR 101.28 101.62 99.28 101.62 102.63 101.74 101.42 1.10
IBS 99.52 99.49 99.34 99.86 99.46 99.35 99.55 0.23
System precision Area 1 Area 2 Area 3 Area 4 Area 5 Area 6 Average % RSD
CHR 2613.570 2686.169 2668.785 2613.573 2678.472 2648.888 2659.171 1.09
IBS 7465.607 7431.874 7437.245 7465.606 7443.832 7489.610 7453.633 0.32
Table 5: Robustness of Chlorthalidone and Irbesarton %RSD at different flow rates, different nm and different pH
Chlorthalidone Irbesarton
Parameter Average area %RSD Average area %RSD
Flow rate(0.8) 3415.66 0.867 8957.37 0.207
Flow rate(1.2) 2477.52 0.605 7097.57 0.491
Wavelength(218) 2221.69 0.180 7274.63 0.089
Wavelength(222) 3634.78 0.144 8629.77 0.080
pH (5.3) 3320.80 0.662 8855.41 0.122
Table 6: Ruggedness of the drug on different days and different analyst
Day 1 Chlorthalidone (%) Irbesarton (%)
Analyst 1, Inst 1 99.61 99.07
Analyst 2, Inst 1 99.90 99.00
Analyst 1, Inst 2 100.32 99.25
Analyst 2, Inst 2 99.20 99.59
Day 2
Analyst 1, Inst 1 101.68 99.52
Analyst 2, Inst 1 99.28 99.46
Analyst 1, Inst 2 101.62 99.49
REFERENCE
1. The Merck Index (2006), “An
Encyclopedia of Chemicals, Drugs and Biological, 14, Whitehouse station, NJ, USA, 364.
2. AkifulHaque, M; Nivedita, G ;
Prashanthkumar, K; Pradeepkumar, T; HasnAmrohi, S And Prakash .V Divwan (2012), “Simultaneous Estimation of Atenolol and Chlorthalidone as Bulk and in
Tablet Dosage Form Using
UV-Spectrophotometry”, Journal of pharmacy and Biological Sciences, Vol.1 (4), 20-23. 3. Sahoo, S; Mishra, SK and Panda PK
(2012),“HPLC Method Development for Simultaneous Estimation of Telmisartan and Chlorthalidone in Tablet Dosage
Form”, International Journal for
Pharmaceutical Scholars,Vol.1(4),1-4.
4. Kumar, GS; Ramya, V; Sumanta, Mondal
and Saipavan, kumar (2012),“Development
and validation of RP-HPLC for
Simultaneous Estimation of atenolol and
Chlorthalidone from pharmaceutical
formulation”, International Research
Journal of Pharmacy,Vol.3 (10), 215-219. 5. Mohamed, S; ElgawishSamia, M; Mostafa
and Abdalla A, Elshanawane (2011), “Simple and Rapid HPLC Method for Simultaneous of atenolol and chlorthalidone in spiked human plasma”,
Saudi Pharmaceutical Journal,Vol.19, 43-49.
6. Kreny, E Parmar; Metha, RS; and Nikita, D Patal (2013), “ Development and Validation of HPTLC Method for Simultaneous
Determination of Telmisartan and
Chlorthalidone in Bulk and Pharmaceutical Dosage Form”, International Journal of Pharmacy and Pharmaceutical Sciences,Vol.5 (2), 420-425.
7. The Merck Index (2006), “An
Encyclopedia of Chemicals, Drugs and Biological, 14, Whitehouse station, NJ, USA, 884.
8. Vemugunta, Ramakrishna and Anupama, B
(2012), “Assay of Irbesartan by Extractive
Spectrophotometry”, International Journal of Pharmaceutical, Chemical and Biological Sciences, Vol 2(4), 529-531. 9. Kishanta, kumar Pradhan; Uma, sankar
Mishra; Subasini, Pattnaik; Debananda, Mishra; Ghanshyam, Panigrahui and Kanhu, Charna Sahu (2011), “Development and Validation and Stability Study of Irbesartan in Bulk and Pharmaceutical Dosage Form by UV-spectrophotometric
Method”, International Journal of
Pharmaceutical & Biological Archives, Vol.2 (4), 1114-1122.
10.Hemamrutha, S; Rambabu, R and
Vidhyadhara, S (2013), “Development and Validation of RP-HPLC Method for Simultaneous Estimation of .Irbesartan and
Hydrochlorothiazide in Bulk and
Pharmaceutical Dosage Form”,
International Journal of Pharmacy, Vol.3 (2), 360-363.
11.Mhaske, RA; Sahasrabudhe, S and Mhaske, AA (2012), “RP-HPLC Method for Simultaneous Determination of Irbesartan, Hydrochlorothiazide and Chlorthalidone-Application to Commercially Available Drug Products”, International Journal of Pharmaceutical Sciences and Research, Vol. 3(4), 1116-1123.
12.Bheru, S; Malviya, Deepti, Jain; Prince, Shivare; Pramod, hinnariya and Vidhi, Jain (2012), “Development and validation of
UPLC method for simultaneous
determination of Irbesartan,
Hydrochlorthiazide, Amlodipine besylate and Atorvastati”, International Journal of Drug Discovery and Herbal Research, Vol. 2(4),481-486.
13.Rosangluaia, Shanmuga; sundaram, P and Malarkodi, Velraj (2011), “Validated
HPTLC Method for Simultaneous
Estimation of Irbesartan and
14.ICH (1994), “Text on Validation of Analytical Procedure”, International Conference on Harmonisation, IFPMA, Geneva.
15.FDA Guidance for Industry (2001), “Bio analytical Method Validation, Food and Drug Administration”, Rockville.
Correspondence Author:
K.G. Lalitha
Department of Pharmaceutical Chemistry, Ultra College of Pharmacy, Madurai – 625 020, Tamil Nadu, India