A
N
OVEL
T
HRESHOLD
B
ASED
E
DGE
D
ETECTION
A
LGORITHM
Y. RAMADEVI
Department of Computer Science and Engineering,
Chaitanya Bharathi Institute of Technology, Hyderabad, India- 500 075.
B. POORNIMA
Department of Computer Science and Engineering,
Mahatma Gandhi Institute of Technology, Hyderabad, India-500 075.
T.SRIDEVI
Department of Computer Science and Engineering,
Chaitanya Bharathi Institute of Technology, Hyderabad, India- 500 075.
Abstract:
Image segmentation is the process of partitioning/subdividing a digital image into multiple meaningful regions or sets of pixels regions with respect to a particular application. Edge detection is one of the frequently used techniques in digital image processing. The level to which the subdivision is carried depends on the problem being viewed. Edges characterize boundaries and are therefore a problem of fundamental importance in image processing. There are many ways to perform edge detection. In this paper different Edge detection methods such as Sobel, Prewitt, Robert, Canny, Laplacian of Gaussian (LOG) are used for segmenting the image. Expectation-Maximization (EM) algorithm, OSTU and Genetic algorithms are also used. A new edge detection technique is proposed which detects the sharp and accurate edges that are not possible with the existing techniques. The proposed method with different threshold values for given input image is shown that ranges between 0 and 1 and it are observed that when the threshold value is 0.68 the sharp edges are recognised properly.
Keywords: Colour images; Edge detection; threshold.
1. INTRODUCTION
Segmentation is the process of partitioning a digital image into its constituent parts or objects or regions [3]. These regions share common characteristics based on colour, intensity, texture, etc. The first step in image analysis is to segment an image based on discontinuity detection technique (Edge-based) or similarity detection technique (Region-based).
Some of the practical applications of image segmentation are:
Medical Imaging
o Locate tumors and other pathologies
o Measure tissue volumes
o Computer-guided surgery
o Diagnosis
o Treatment planning
o Study of anatomical structure
Locate objects in satellite images (roads, forests, etc.)
Face recognition
Fingerprint recognition
Traffic control systems
Brake light detection
boundaries, but not always .Image segmentation is done using various edge detection techniques such as Sobel, Prewitt, Robert, Canny, LOG, EM algorithm, OSTU and Genetic Algorithm.
2.EDGES DETECTION TECHNIQUES IN GREYSCALE IMAGE
The various edge detection techniques [5] are discussed in this section. A. SOBEL method
BW=edge(I,'sobel') specifies the Sobel method.
BW = edge (I,'sobel',thresh) specifies the sensitivity threshold for the Sobel method. Edge ignores all edges that are not stronger than thresh. If you do not specify thresh, or if thresh is empty ([]), edge chooses the value automatically.
B. Prewitt method
BW = edge (I,'prewitt') specifies the Prewitt method.
BW = edge (I,'prewitt',thresh) specifies the sensitivity threshold for the Prewitt method. Edge ignores all edges that are not stronger than thresh. If you do not specify thresh, or if thresh is empty ([]), edge chooses the value automatically.
C. Roberts method
BW = edge (I,'roberts') specifies the Roberts method.
BW = edge (I,'roberts',thresh) specifies the sensitivity threshold for the Roberts method. Edge ignores all edges that are not stronger than thresh. If you do not specify thresh, or if thresh is empty ([]), edge chooses the value automatically.
D. Laplacian of Gaussian method
BW = edge (I,'log') specifies the Laplacian of Gaussian method.
BW = edge (I,'log',thresh) specifies the sensitivity threshold for the Laplacian of Gaussian method. Edge ignores all edges that are not stronger than thresh.
E. Canny Method
BW = edge (I,'canny') specifies the Canny method.
BW = edge (I,'canny',thresh) specifies sensitivity thresholds for the Canny method [2]. Here thresh is a two-element vector in which the first two-element is the low threshold, and the second two-element is the high threshold.
F. Expectation-Maximization (Em) Algorithm
The EM algorithm is an efficient iterative procedure to compute the Maximum Likelihood Estimate (MLE) in the presence of missing or hidden data. Each iteration of the EM algorithm consists of two processes: The E-step, and the M-step. In the expectation, or E-E-step, the missing data are estimated given the observed data and current estimate of the model parameters. In the M-step, the likelihood function is maximized under the assumption that the missing data are known. The estimates of the missing data from the E-step are used in lieu of the actual missing data.
G. OTSU algorithm
Threshold selection is used in OTSU algorithm. The OTSU method is one of the applied methods of image segmentation in selecting threshold automatically for its simple calculation and good adaptation.
The different thresholding techniques are:
1. Histogram shape-based methods. 2. Clustering-based methods. 3. Entropy-based methods. 4. Object attribute-based method. 5. Spatial methods.
6. Local methods.
The major problem with thresholding is that we consider only the intensity, not any relationships between the pixels. There is no guarantee that the pixels identified by the thresholding process are contiguous.
The steps of the OTSU algorithm: For each potential threshold T,
1. Separate the pixels into two clusters according to the threshold. 2. Find the mean of each cluster.
3. Square the difference between the means.
4. Multiply by the number of pixels in one cluster times the number in the other.
H. Genetic algorithm
Genetic Algorithms (GAs) can be seen as a software tool that tries to find structure in data that might seem random, or to make a seemingly unsolvable problem more or less 'solvable'. Basically, a genetic algorithm consists of three major operations: selection, crossover, and mutation. The selection evaluates each individual and keeps only the fittest ones in the population. In addition to those fittest individuals, some less fit ones could be selected according to a small probability. The others are removed from the current population. The crossover recombines two individuals to have new ones which might be better. The mutation operator induces changes in a small number of chromosomes units. Its purpose is to maintain the population diversified enough during the optimization process.
The existing GA’s are founded upon the following main principles:
1. Reproduction 3. Crossover 2. Fitness 4. Crossover
3.IMPLEMENTATION AND RESULTS
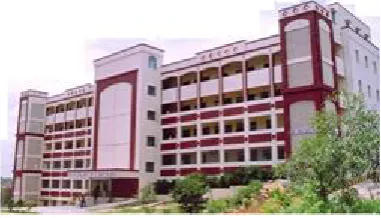
Implementation of the techniques was done on different images.Colored images were converted into gray scale image [7] and then different edge detection techniques were applied. A sample grey scale image (figure 1) is considered for edge detection using Sobel, Prewitt, Robert, Canny, LOG, EM algorithm, OSTU and Genetic Algorithm and compared with the edges detected by the proposed method . The segmented image using different edge detection techniques are shown in Table 1.
TABLE 1:SEGMENTED IMAGES USING DIFFERENT EDGE DETECTION TECHNIQUES
SOBEL PREWITT LOG
ROBERTS CANNY EM
OSTU GENETIC
4. PROPOSED METHOD
The proposed method makes use of the following function to detect the edge and a linear filter [6] to remove the noise:
function h=proposed dge(im,thr,T)
Where im is an input image, thr is a threshold between 0-1, T is the thickness of the line to indicate the edge and h is a uint8 black and white image with values of 0 and 255[4].
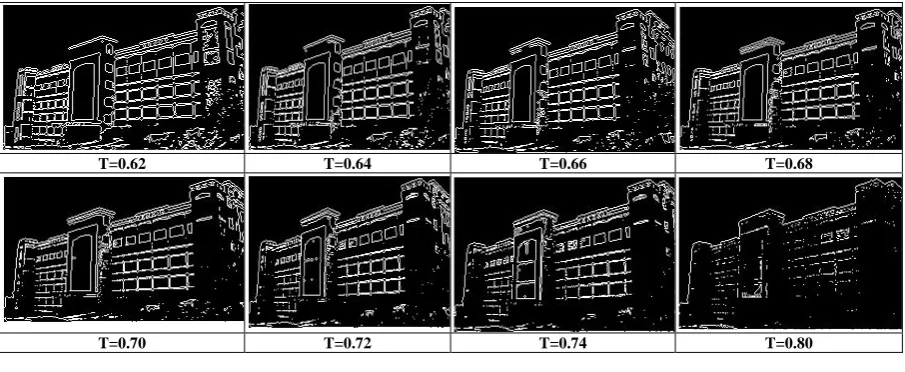
TABLE 2:SEGMENTED IMAGES USING VARIOUS THRESHOLD VALUES FOR THE PROPOSED METHOD
T=0.62 T=0.64 T=0.66 T=0.68
T=0.70 T=0.72 T=0.74 T=0.80
5. OBSERVATION
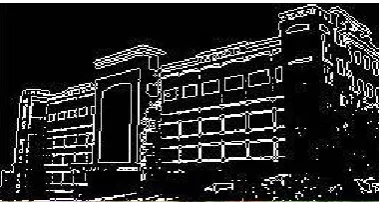
From the table 2 it is observed that when the threshold value T is less than 0.65 or greater than 0.70 then the edges are not detected properly. When the threshold value is in between 0.65<=T<=0.70 then the edges are determined properly and we found that at T=0.68 sharp and accurate edges are determined as shown in figure 2.
6.CONCLUSIONS
This paper focuses mainly on the Image segmentation using edge detection operators. The edge detection with the Sobel, Prewitt, Robert, Canny, LoG, Expectation-Maximization (EM) algorithm, OSTU and Genetic Algorithm are studied. A new edge detection technique is proposed which detects the sharp and accurate edges that are not possible with the existing techniques. The proposed method with different Threshold values for given input image is shown that ranges between 0 and 1 and it is observed that when the threshold value is 0.68 the sharp edges are recognised properly.
7.REFERENCES
[1] Balkrishan Ahirwal; Mahesh Khadtare; Rakesh Mehta(2007). FPGA based system for Color Space Transformation RGB to YIQ
and YCbCr. International Conference on Intelligent and Advanced Systems 2007.
[2] Canny, J. F.(2007). A computational approach to edge detection, IEEE Transactions Pattern Analysis Machine Intelligence, vol.
8, no. 6, pp. 679-698.
[3] Iasonas Kokkinos ; Petros Maragos(2009). Synergy between Object Recognition an image segmentation using Expectation and
Maximization Algorithm, IEEE Trans. on Pattern Analysis and Machine Intelligence (PAMI), Vol. 31(8), pp. 1486-1501.
[4] LI Xue-wei; ZHANG Xin-rong(2008). A Perceptual Color Edge Detection Algorithm, International Conference on Computer
Science and Software Engineering,2008.
[5] Rafael C. Gonzalez; Richard E. Woods; Digital Image Processing, Second Edition.
[6] Xiaoliang Qian; Lei Guo; Bo.Yu(2010). An Adaptive Image Filter Based on Decimal Object Scale For Noise Reduction and
Edge Detection, IEEE Transactions on Image Processing,2010.
[7] Xin Chen; Houjin Chen(2010). A Novel Color Edge Detection Algorithm in RGBColor Space, School of Electronic and