_____________________________________________________________________________________________________ *Corresponding author: E-mail: [email protected];
(Past name: American Chemical Science Journal, Past ISSN: 2249-0205)
Non-linear Regression, a Better Approach for the
Optimisation of Hydroquinone, Resorcinol and
Catechol Adsorption by Chemically Activated
Carbon Based on Monkey Kola (
Cola lepidota
k.
schum)
Waste
Nono Nguemjom Patricia
1,2, Kamgaing Théophile
1*,
Tchuifon Tchuifon Donald Raoul
1, Doungmo Giscard
1,
Baleba Mbanga Moise Roger
2and Anagho Solomon Gabche
1,31Research Unit of Noxious Chemistry and Environmental Engineering, Department of Chemistry,
Faculty of Science, University of Dschang, P.O Box, 67. Dschang, Cameroon.
2
Laboratory for food study and quality control, Centre for Food and Nutrition Research, Institute of Medical Research and Medicinal Plants Studies, Ministry of Scientific Research and Innovation,
P.O Box, 13033, Yaounde, Cameroon.
3Department of Chemistry, University of Bamenda, P.O Box 39, Bamenda, Cameroon.
Authors’ contributions
This work was carried out in collaboration between all authors. All authors read and approved the final manuscript.
Article Information
DOI: 10.9734/CSJI/2018/45320 Editor(s): (1)Dr. Nagatoshi Nishiwaki, Professor, Kochi University of Technology, Japan. Reviewers: (1)Victor Shikuku, Kaimosi Friends University College, Kenya. (2)Farid I. El-Dossoki, Port Said University, Egypt. Complete Peer review History:http://www.sciencedomain.org/review-history/27684
Received 21 September 2018 Accepted 27 November 2018 Published 08 December 2018
ABSTRACT
Activated carbon was prepared from waste of monkey kola by pyrolysis and chemical activation using H3PO4. It was characterised by Fourier transform infrared spectroscopy (FTIR), X-ray
diffraction (XRD) and energy dispersive X–ray spectroscopy (EDX). Different physical properties namely bulk density, moisture content, volatile matter content, iodine number, pH of the solution, pHpzc and methylene blue adsorption were also determined. The activated carbon was used as an
adsorbent for the removal of hydroquinone, catechol and resorcinol in solution. The process parameters of the sorption system such as pH of the solution, contact time and the amount of adsorbent were studied to understand their effects on pollutants removal. The optimised parameters are found to be pH: between 6 - 8, and the agitation time: 30 minutes. The experimental equilibrium data were analysed using five models (Langmuir, Freundlich, Redlich-Peterson, Sips, Langmuir-Freundlich). Non-linear regression analysis was employed, and three error analysis methods, correlation coefficient (R²), root-mean-square error (RMSE) and non-linear chi-square test (χ²) were considered to identify the best-fit isotherm and the best-fit kinetic model. Among all the adsorption isotherms considered, Langmuir was found to be a perfect representation of the experimental equilibrium data with high R² low RMSE and good χ². Batch kinetic experiments were carried out and experimental kinetics was fitted by non-linear regression. The sorption process was found to follow the pseudo first-order in case of the three pollutants. This study showed that the activated carbon can be used as a good adsorbent for the removal of phenol derivatives from water according to its maximum adsorption capacity which is about 66.57 µmol/g, 10.42µmol/g and 5.47 µmol/g respectively for hydroquinone, catechol and resorcinol.
Keywords: Activated carbon; adsorption; agricultural residues; phenols; non-linear regression.
1. INTRODUCTION
Today, organic matter pollution has become one of the most important environmental problems. It is well known that phenol and its derivatives are the most common organic pollutants in waste waters discharged from petrochemical, chemical and pharmaceutical industries. Among phenol derivatives are hydroquinone, resorcinol and catechol, three isomers of dihydroxybenzene with multiple applications. The wastewater that contains these isomers is harmful to the environment in general and to the aquatic ecosystems in particular. Therefore it must be treated before discharged [1]. The principal techniques used for the removal of phenols are: adsorption using activated carbon [2], wet air catalytic oxidation (WACO) or wet hydrogen peroxide catalytic oxidation (WHPCO) [3], aerobic or anaerobic biodegradation [4].
Activated carbon (AC) is well considered as an excellent adsorbent widely used in purification processes, water treatment, and catalysis [5,6]. Raw materials for activated carbon preparation may be any substance with a relatively high carbon concentration, from mineral carbons to biomass residues [7]. The preparation method involves thermal treatment, with the presence of a chemical agent (chemical method) or activation of carbonizates through controlled gasification (physical method) [8].
Tropical African sub-regions are home to many valuable fruit species whose potentials have not been fully realised. However, tangible economic have been harvested from their wild and/or protected stands in home gardens, farmlands and forest reserves [9]. According to National
Academy of Sciences [10], tropical fruits production in Africa today is being dominated by species introduced from Asia and the Americas, such as bananas, pineapples (Ananas comosus), mangos (Mangifera indica), papayas (Carica papaya), monkey kola and many other. Monkey kola is a common name given to a number of minor relatives of the Cola that produce edible tasty fruits. Native people of many countries such as southern Nigeria and Cameroon rely on the fruits of monkey kola, as well as some wild primate animals especially monkeys, baboons and other species. Once emptied of their sweet fruits, monkey cola pods become bulky waste whose open burning pollutes the atmosphere. They should be valued while preserving the environment.
determine the adsorption isotherm and kinetic parameters [15]. In the case of non-linear regression, the selection of error functions showed a change in the values of individual isotherm and kinetic constants [16]. This could be efficiently pacified by selecting an optimisation procedure such as sum of normalised errors [17]. Therefore, the equilibrium data resulting from batch adsorption experiments is analysed by using different types of isotherm models, the kinetic study by using different types of kinetic models, and a best fit among them is investigated by comparing sum of normalised errors and statistical comparison values. Such a study will be significantly useful in understanding sorption mechanism for the performance of sorption systems.
The aim of this study is to produce activated carbon based on monkey kola pods, an abundant and cost-free resource. The study investigated kinetics and equilibrium aspects of the adsorption of hydroquinone, catechol and resorcinol onto the activated material obtained.
2. MATERIALS AND METHODS
2.1 Preparation of the Precursor (Raw Adsorbent)
Monkey kola in capsule were purchased in the market of Dschang, a town based in West Cameroon. Initially, the kola was removed from the capsule, the empty capsule washed with distilled water, then cut and dry under the sun until a moisture content less than 10% was obtained; the dried material was then crushed.
2.2 Activation of the Precursor
The activated carbon was prepared by chemical activation with orthophosphoric acid (H3PO4),
according to the method developed by Tchakala et al. [18]. The impregnated samples with 18% of H3PO4 were carbonised for 2 hrs at 450°C. The
activated carbons were labeled MKC.
2.3 Characterisation of the Activated Carbon
In order to determine the physicochemical properties of the activated carbon prepared, several analyzes were carried out using for some, usual protocols. These analyses are: Bulk Density, Moisture content [19], Volatile Matter, Iodine Number [20], point of zero charge (pHpzc) [20], pH, Fourier Transform-Infrared (FTIR) Spectroscopy, X- ray diffraction (XRD),
elementary analysis of activated carbon(EDX) and Methylene blue number [21,22].
2.4 Reagents
Three Analytical grade reagents (purity > 99 %), were used as adsorbates. A stock solution of each reagent was prepared by dissolving 550 mg of reagent in 50 mL of distilled water. Different initial concentrations were obtained by successive dilutions. Residual concentration of pollutants were determined by UV absorption at 286 nm, 276 nm and 273 nm wavelength respectively for hydroquinone, catechol and resorcinol, using a calibrated UV-Visible spectrophotometer (Jenway model 6715).
2.5 Batch Adsorption
Experiments were carried out by dispersing 100 mg of adsorbent in10 mL of 10-110 mg/L of pollutant solution in 100 mL flasks. The mixture was shaken for 1h, the solution filtered, and the residual concentrations of pollutant determined by spectrophotometry. The amount of pollutant adsorbed was obtained using the following equation:
Q =( ) ( / ) (1)
Where C0 and Ct are the concentrations of
pollutant solution (mg/L) at initial and final time (t) respectively; V the volume of solution (mL) and m is the weight (mg) of activated carbon. Each experiment was carried twice and the average results presented.
Experiments were carried out at constant stirring speed of 150 rpm/min. The pH of the medium was adjusted by adding dilute solutions of 0.1 M HCl or 0.1 M NaOH.
2.6 Isotherm Studies
2.6.1 Langmuir Isotherm
According to the theory of adsorption, the model of Langmuir is based on the fixation of a monolayer of adsorbate molecules on the pores surface [24]. The model assumes uniform adsorption on the surface and no transmigration in the plane of the surface. Langmuir’s equation is mathematically expressed as follows.
Q = (2)
Where: KL (L/mg) is the equilibrium adsorption
constant and is related to the free energy of the adsorption, Qmax (mg/g), the maximum
adsorption capacity Ce, the equilibrium
concentration and Qe (mg/g) is the amount
adsorbed at equilibrium. A linear form of equation (2) is given in equation (3):
= + (3)
2.6.1 Freundlich Isotherm
The Freundlich equation is an empirical model that considers heterogeneous adsorptive energies on the adsorbent surface [25].
Q = K C / (4)
The linear form of equation (4) is given in equation (5):
lnQ = lnC + lnK (5)
Where, KF (L/g) and 1/n are Freundlich
constants.
2.6.2 The Redlich-Peterson Isotherm
The Redlich – Peterson is an empirical isotherm which incorporates three parameters. It may be used to represent adsorption equilibrium over a wide concentration range. It combines some elements from both the Langmuir and Freundlich equation, and consequently, it can be employed either in heterogeneous or homogenous systems. It can be described as follow [26].
Q = (6)
Where A (L/g) and B (L/mg) are Redlich– Peterson isotherm constants, g is an exponent which lies between 0 and 1.
2.6.3 The Sips Isotherm
The Sips isotherm is a combined form of Langmuir and Freundlich models [27]. At low adsorbate concentrations, this model is reduced effectively to the Freundlich isotherm and did not obey to the Henry’s law. At high adsorbate concentrations, it predicts a monolayer sorption capacity which is characteristic of the Langmuir isotherm. The model can be written as:
Q = // (7)
Where Qs (mg/g) is the sips maximum adsorption
capacity, KS (l/g) is the Sips model isotherm
constant, and 1/n is the sips model exponent.
2.6.4 The Langmuir-Freundlich Isotherm
The Langmuir-Freundlich isotherm, also known as Sip's equation, is a versatile isotherm expression that can simulate both Langmuir and Freundlich behaviors [28]. The Langmuir-Freundlich isotherm can describe both the Langmuir-type and Freundlich-type adsorption behavior of pollutant and is suitable for modeling pH-dependent sorption effects. A general form of Langmuir-Freundlich isotherm equation can be written as [29]:
Q = ( )
( ) (8)
Where, Q is the amount of pollutant adsorbed at equilibrium (mg/g). Qm is the adsorption capacity
of the system (mg of sorbate/g sorbent). Ceq is
the aqueous phase concentration at equilibrium (mg/L). Ka is the affinity constant for adsorption
(L/mg) and n is the index of heterogeneity. Fundamentally, both Langmuir and Freundlich isotherms can be mathematically viewed as the following weighted integral [30]:
g(K ) K
1 + K dK (9)
∞
Where the statistical density function g(Ka)
represents the individual site density values of elementary isotherms with its own affinity constant Ka. The g(Ka) distribution reduces to a
heterogeneity index n, which is allowed to vary from 0 and 1. The value of n for a homogeneous material is 1, and it is less than one for heterogeneous materials. Mathematically, when n is set to 1 the Langmuir-Freundlich isotherm Eq. (8) reduces to the following expression:
Q = Q (10)
This equation will be identical to the Langmuir isotherm if we replaced Qm with Kmax, a
pH-dependent sorption capacity value. Also, when Ceq or Ka approaches a low value, the
denominator in Eq. (8) will be close to unity and the Langmuir-Freundlich isotherm expression reduces to a Freundlich-type expression [31]. Thus the Langmuir-Freundlich model offers a flexible analytical framework for modeling both Langmuir and Freundlich type sorption effects. Also, the Langmuir-Freundlich isotherm uses a single value to describe the maximum adsorption capacity and does not require fitted adsorption capacity values at different pH values. Instead the value of affinity constant (Ka) can be varied to
account for pH dependent sorption effects. This approach is consistent with Suplied Chain Management formulations which use a single value for maximum sorption capacity [32].
2.7 Kinetics of Adsorption
In order to accurately reflect the variation trend of pollutant concentration with time and reveal the reaction pathway of adsorption process, several kinetic models were employed to examine the experimental data. The nonlinear pseudo-first-order, pseudo-second-order kinetic model, intraparticular and elovich models were expressed as follows:
Pseudo-first order model: The pseudo-first-order of Lagergren [33] is expressed as:
Qt =Qe[1- exp(- K1t)] (11)
Where K1 (mn-1), is the rate constant of
pseudo-first order adsorption, Qt and Qe are respectively
the instantaneous and equilibrium amount of pollutant adsorption per unit weight of activated carbon (mg/g) and t is the time (min). The plot of Ln (Qe-Qt) versus t should give a linear
relationship with the slope equal to K1.
Pseudo-second order model: The kinetic data are fitted with pseudo-second order model resulting in the following equation [34]:
= /(1 + ) (12)
Where K2 is the rate constant of pseudo-second
order.
Intra-particle diffusion:
Intra-particle diffusion was often considered as the limiting step which limits the kinetics in the process of adsorption. The possibility of a limitation by the diffusion in the pores is explored by plotting pollutant uptake against the square root of time, using the Weber and Morris model:
qt = Kd t1/2 + C (13)
where qt is the instantaneous amount of pollutant
adsorption per unit gram of activated carbon (mg/g), C (mg/g) is a constant giving an idea about the thickness of the boundary layer.
Elovich kinetic equation:
The Elovich equation is generally expressed as [35]:
= e-βQt (14)
where Qt (mg/g) is the sorption capacity at time
t, is the initial adsorption rate (mg/g.min), and β is the desorption rate constant (mg/g.min) during any one experiment. The integrated and simplified equation (assuming that αβt ˃˃1) is:
Qt= ( ) = lnt (15)
2.8 Non-linear Regression Analysis
comparison values can be evaluated using the tools like solver add-in with Microsoft’s spread sheet, Excel through any of the iteration method. The application of these five different error methods will produce different isotherm parameter sets; therefore, it is hard to directly recognise an overall optimum parameter set. In order to facilitate a meaningful comparison between the isotherm parameter sets, the procedure of “sum of the normalised errors”
(SNE) is usually adopted [38]. This approach allows a direct comparison of the scaled errors and thus identifies the isotherm parameter that would provide the closest fit to the measured data. The parameter set derived based on the smallest SNE will be an optimal one provided that there is no bias in the data sampling and type of error functions selected.
Table 1. Definitions of error functions and statistical comparison values [38]
Error function Definition Remarks
Coefficient of determination (R²)
( , − , )²
, − , + , − , ²
It is used to test the best-fitting isotherms. Its value closer to unity the goodness of the model is perfect
RMSE 1/2
, − , ² An estimator used to quantify the
difference between values implied by calculated and the measured values of the quantify estimated Non-linear chi
square test (χ²) ( , − , )²
,
A statistical tool necessary for the best fit of an adsorption system. Small value indicates its
similarities while a larger number represents the variation of the experimental data
HYBRID
( , − , )²
,
It was introduced to improve the fit of ERRSQ method at low
concentration ranges
MPSD
( , − , )
,
²
This function is similar to
geometric error distribution which was modified to allow for the number of degrees of freedom of the system
ARE
, − ,
,
It shows a under or overestimates the experimental data and
attempts to minimise the fractional error distribution across the entire limits of the concentration EABS
, − ,
A function similar to ERRSQ function, with an increase in the errors will provide a better fit, leading to the bias towards the higher concentration data ERRSQ
, − , ²
An error function more helpful at the higher end of the liquid phase concentration ranges. The increasing trend in the magnitude and squares of the errors
The strength of the linear association between two variables is quantified by the square of the correlation coefficient (R) which is called the coefficient of determination (R²). Additionally, RMSE and Non-linear chi-square test were used to determine the linear relationship strength and to measure the accuracy of predictions. These three error functions were also applied to discuss the fitness of isotherm and kinetic models, and to select the best model which fits to experimental data.
3. RESULTS AND DISCUSSION
3.1 Characterization of Activated Carbon
Table 2 gives the properties of the activated carbon produced in this study.
The bulk density of the activated carbon is 467.8kg/m3. The activated carbon presents an acid pH value and an acid point of zero charge.
3.2 Iodine Number
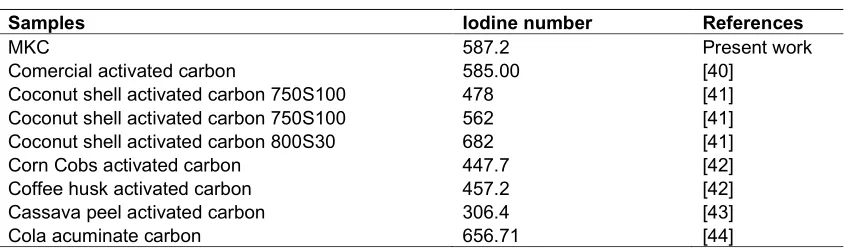
High values of iodine number indicate high degree of activation in the surface area. It is a measure of the micropores and it is used as an indication of the total surface area [19, 39]. The iodine numbers of activated carbon prepared in this investigation is 587.2 mg/g. This value indicates that the activated carbon performs well in removing small sized contaminants. Table 3 compares iodine numbers of the present work with other known iodine numbers.
3.3 Infra-red Analysis
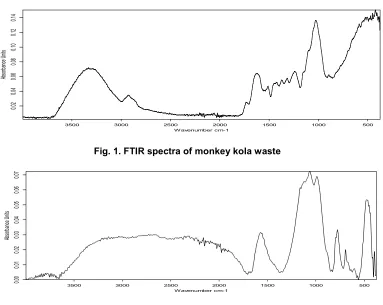
Fig. 1 gives the FTIR-spectra of monkey kola waste before carbonisation and Fig. 2
represents the FTIR-spectra of the activated carbon MKC.
In the raw material samples, the O-H stretching vibration bands seen in the wavenumber range of 3800-3000 cm-1 indicate the presence of surface hydroxyl groups of alcohol, water and polysaccharides. The presence of absorption bands characteristic of CH, or CH2 structures
(2100- 2300 cm-1and 1400-1000 cm-1) in all the spectra suggests the existence of some aliphatic species. The presence of bands in the range 1600-1400 cm-1 can be attributed to the stretching vibrations of C=O in carboxylics, esters, lactones, quinones and/or ion radical structures. Also, the 1700 cm-1 adsorption bands was attributed to C=C of alkene and carboxylate structures. The absorption bands in the 1710-1600 cm-1, 1550-1510 cm-1and 1500- 1520 cm-1 regions are due to aromatic rings and double bond vibrations. The C-O single bond shows an adsorption band [45] at about 1000 cm-1.
In the FTIR spectrum of activated carbon the presence of absorption bands characteristic
of CH or CH2 structures (2700-2800 cm -1
and 500-530 cm-1) suggests the existence of
some aliphatic species in the activated carbon [46]. The presence of bands at 1400 cm-1 can be attributed to the stretching
Table 2. Characterisation of the adsorbent
Sample Bulk density, (kg/m3)
Moisture content (%)
pH PHpcz Iodine number
(mg/g)
Methylene blue adsorption (mg/g)
MKC 467.8 7 6.01 6.87 587.2 147.76
Table 3. Iodine number of some activated carbon
Samples Iodine number References
MKC 587.2 Present work
Comercial activated carbon 585.00 [40]
Coconut shell activated carbon 750S100 478 [41] Coconut shell activated carbon 750S100 562 [41] Coconut shell activated carbon 800S30 682 [41]
Corn Cobs activated carbon 447.7 [42]
Coffee husk activated carbon 457.2 [42]
Cassava peel activated carbon 306.4 [43]
Fig. 1. FTIR spectra of monkey kola waste
Fig. 2. FTIR spectra of activated carbon MKC
vibrations of C=O in carboxylic acids. Another broad band in the 1200-1400 cm-1 range consisting of a series of overlapping absorption bands that can be ascribed to C=C of aromatics ring [47]. The overlapping peaks which form an absorption band in the1700-1400 cm-1 region, can be assigned to C-O of carboxylic acid, phenolic structures and esters. After the activation with H3PO4, the peak at the 3500-3100
cm-1 range of the precursor becomes weaker indicating the disappearance of water molecules. Several new peaks are detected in the region of 700–850 cm-1. There might also contain phosphorus.
3.4 X-ray Diffraction Analysis
Fig. 3 gives the XRD-spectra of monkey kola waste before carbonisation and the XRD-spectra of the activated carbon MKC. This pattern generally shows an amorphous structure of materials and a low crystalinity of sample in the range of 5 to 48°. For the raw materials, the diffraction patterns show a peak at 22° which is attributed to the presence of the native cellulose.
The diffraction patterns of activated MKC show almost the same pattern and exhibit the same diffraction peaks at 25 and 43° which are attributed respectively to the presence of carbon / graphite and dehydrated hemicellulose [48]. On the other hand we find that after activation of the raw materials, the main peak moves from 22 to 25° and the appearance of a peak at 39°, which shows that the activation process was well done.
3.5 Elemental Analysis
Elemental analysis help to determine the proportions of nitrogen, carbon, hydrogen and sulfur atoms present in each material. The Table 4 shows the result of elemental analysis of monkey kola waste and the activated carbon MKC.
It appears that the carbonised material is richer in carbon atoms than the raw material. The carbon content has almost doubled in activated carbon MKC, which is consistent with expectations.
500 1000
1500 2000
2500 3000
3500
W avenumber cm-1
0.0
2
0.0
4
0.0
6
0.08
0.1
0
0.12
0.1
4
Abs
or
ban
ce
Unit
s
500 1000
1500 2000
2500 3000
3500
W avenumber cm-1
0.0
0
0.
01
0.0
2
0.
03
0.
04
0.
05
0.
06
0.0
7
Ab
so
rb
an
ce
Uni
Fig. 3. X-ray diffraction patterns of monkey kola waste and activated carbon MKC
Table 4. Elemental analysis of monkey kola waste and activated carbon MKC
Sample N %
Blank 0
monkey kola waste 2.2
MKC 2.6
3.6 Adsorption Studies
3.6.1 Effect of contact time
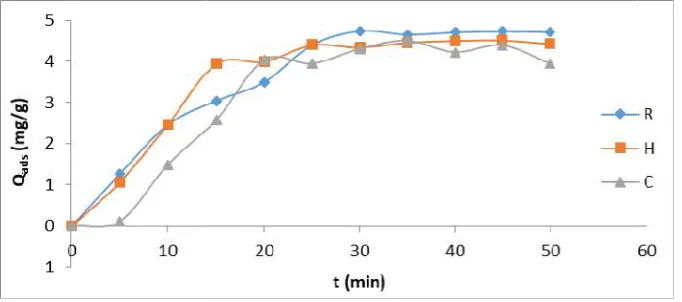
The effect of contact time on the removal of the three pollutants is reported in Fig.
indicates that the equilibrium time was reached after about 30 minutes. It was o
adsorption reaction was rapid in the first 15 min, followed by a sluggish stage until equilibrium. The adsorption of the three pollutants involve three steps: a rapid external surface diffusion process (step 1): This is due to the fact that
Fig. 4. Effect of contact time on the uptake of hydroquinone, catechol and resorcinol onto the activated carbon MKC (room temperature, 55.55 mg/L initial concentration, pH = 7)
ray diffraction patterns of monkey kola waste and activated carbon MKC
Elemental analysis of monkey kola waste and activated carbon MKC
C % H % S %
0 0 0
40.2 3.4 0
66.6 2.9 0
The effect of contact time on the removal of the 4. The result indicates that the equilibrium time was reached after about 30 minutes. It was observe that adsorption reaction was rapid in the first 15 min, followed by a sluggish stage until equilibrium. The adsorption of the three pollutants involve three steps: a rapid external surface diffusion process (step 1): This is due to the fact that
initially the number of sites of activated carbon available is higher and the driving force for the mass transfer is greater. A slow intraparticle diffusion stage (step 2): In the second region (15 30 minutes), as the time progresses, the number of free sites on the activated carbon decreases, and the non-adsorbed molecules are assembled at the surface, thus limiting the adsorption capacity and the rate. And a dynamic adsorption-desorption equilibrium (step 3): at this step, the equilibrium is already reach. three processes often occurred simultaneously.
Effect of contact time on the uptake of hydroquinone, catechol and resorcinol onto the activated carbon MKC (room temperature, 55.55 mg/L initial concentration, pH = 7)
ray diffraction patterns of monkey kola waste and activated carbon MKC
Elemental analysis of monkey kola waste and activated carbon MKC
Weight 1 2.1 2.5
tially the number of sites of activated carbon available is higher and the driving force for the mass transfer is greater. A slow intraparticle diffusion stage (step 2): In the second region (15-30 minutes), as the time progresses, the number
on the activated carbon decreases, adsorbed molecules are assembled at the surface, thus limiting the adsorption capacity and the rate. And a dynamic desorption equilibrium (step 3): at this step, the equilibrium is already reach. These three processes often occurred simultaneously.
3.6.2 Effect of initial pH on the adsorption
The pH of solution is one of the most important parameters that affect the adsorption process, because it affects the surface charge of the adsorbent as well as the degree of ionisation and speciation of our pollutants [49]. The
initial pH on the adsorption of hydroquinone, catechol and resorcinol was studied with initial pollutant concentration of 55.55 mg/L and optimum carbon amount of 0.1 g. Fig
the influence of solution pH on the three pollutants removed by MKC at a pH range 2.0 to 14.0. The result shows that the quantity of pollutant adsorbed increased from 2 to 6; and then decreased sharply (pH>8). The maximum pollutant uptake obtained between pH = 6 can be explained by the fact that at these pH, more protonated species are present in the solution. At pH = 10, the repulsive electrostatic forces predominate, and the adsorption at low
Fig. 5. Effect of pH on the uptake of hydroquinone, cat
carbon MKC (room temperature, 55.55 mg/L initial concentration)
Fig. 6. Effect of amount of adsorbent on the uptake of hydroquinone, catechol and resorcinol onto the activated carbon MKC (room temperature, 55.55
tial pH on the adsorption
The pH of solution is one of the most important parameters that affect the adsorption process, because it affects the surface charge of the adsorbent as well as the degree of ionisation and speciation of our pollutants [49]. The effect of initial pH on the adsorption of hydroquinone, catechol and resorcinol was studied with initial pollutant concentration of 55.55 mg/L and optimum carbon amount of 0.1 g. Fig. 5 shows the influence of solution pH on the three MKC at a pH range 2.0 to 14.0. The result shows that the quantity of pollutant adsorbed increased from 2 to 6; and The maximum pollutant uptake obtained between pH = 6 and 8 can be explained by the fact that at these pH, protonated species are present in the solution. At pH = 10, the repulsive electrostatic forces predominate, and the adsorption at low
concentrations is less than that at high concentrations.
3.6.3 Effect of amount of adsorbent
Another parameter that controls adsorption is the amount of activated carbon employed. Under selected conditions (stirring time of 30 minutes and pollutant concentration of 55.55 mg/L), the amount of activated carbon was varied from 10 mg to 100 mg. Fig. 6 indicates that the adsorption amount increases as the amount of activated carbon increases. This is due to the fact that, an increase in the mass increases the number of sites of adsorption on the surface of the adsorbent. At 100 mg of activated carbon, almost 97.94% of the pollutant was removed from solutions in the case of hydroquinone, 98.8% in the case of catechol and 97.04 in the case of resorcinol. Hence, for subsequent studies, 100 mg of activated carbon was used.
Effect of pH on the uptake of hydroquinone, catechol and resorcinol onto the activated carbon MKC (room temperature, 55.55 mg/L initial concentration)
Effect of amount of adsorbent on the uptake of hydroquinone, catechol and resorcinol onto the activated carbon MKC (room temperature, 55.55 mg/L initial concentration).
concentrations is less than that at high
3.6.3 Effect of amount of adsorbent
trols adsorption is the amount of activated carbon employed. Under selected conditions (stirring time of 30 minutes and pollutant concentration of 55.55 mg/L), the amount of activated carbon was varied from 10 6 indicates that the tion amount increases as the amount of activated carbon increases. This is due to the fact that, an increase in the mass increases the number of sites of adsorption on the surface of the adsorbent. At 100 mg of activated carbon, ant was removed from solutions in the case of hydroquinone, 98.8% in the case of catechol and 97.04 in the case of resorcinol. Hence, for subsequent studies, 100 mg of activated carbon was used.
echol and resorcinol onto the activated
3.6.4 Kinetic study
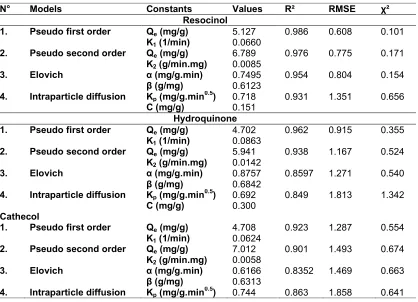
Kinetic methods are generally used to determine the rate and elucidate the mechanism of the reactions [32]. To evaluate the kinetic mechanism that controls the adsorption process of hydroquinone, catechol and resorcinol on the activated carbon, the pseudo-first order, the pseudo-second order, Elovich and intra-particle diffusion model were tested to interpreted the experimental data. Non-linear kinetic models are being fitted (Figs. 7, 8, 9) and kinetic data estimated (Table 5).
Non-linear pseudo first order model was applied to accurately reflect the variation trend of pollutant concentration with time and reveal the reaction pathway of adsorption process. The pseudo-first order model well described the adsorption data for all the three adsorbents as evidenced by high coefficients of determination R² (0.962), low RMSE (0.915) and good χ² (0.355) values, in the case of hydroquinone; with high R² (0.923), low RMSE (1,287) and good χ² (0.504) values, in the case of catechol; and with high R² (0.986), low RMSE (0,608) and good χ² (0.101) values, in the case of resorcinol (Table 5).Thus, it can be concluded that adsorption speed of the three pollutants onto MKC is proportional to the number of adsorption sites, involving forces caused by the sharing of electrons between activated carbon and pollutants [50]. In addition, the predicted equilibrium adsorption capacities (Qe) for hydroquinone, catechol and resorcinol were 4.702 mg/g, 4.708 mg/g and 5.127 mg/g respectively. These results show that the sorption of hydroquinone, catechol and resorcinol from aqueous solution onto activated carbon MKC follows the pseudo-first kinetic model and
could be used to determine the equilibrium sorption capacity, rate constant and percentage of these pollutants removal. Intraparticle diffusion model was applied to describe experimental data obtained for the adsorption of the three pollutants onto carbon MKC (Figs. 7, 8 and 9). The relatively low values of R² (0.849; 0.863 and 0.931) RMSE (1.813; 1.858 and 1.351) and χ² (1.342; 0.641 and 0.656) respectively for hydroquinone, catechol and resorcinol indicated that this model utterly failed to predict the equilibrium data (Table 5). According to the R², RMSE and χ² values, the best-fitted adsorption kinetic models were found in the order: pseudo first order> pseudo second order>Elovich> intraparticle diffusion.
3.6.5 Equilibrium isotherm modeling
The adsorption isotherm was obtained from data deduced from the effect of initial pollutant concentration. These isotherms are generally used to establish the relationship between the amount of pollutant adsorbed and its equilibrium concentration in solution. Although these isotherms do not lead to the deduction of the adsorption mechanisms they are useful for comparing results from different sources on a quantitative basis, providing information on the adsorption potential of a material with easily interpretable constants.
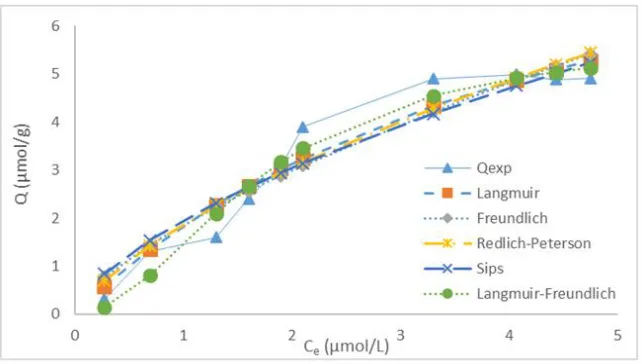
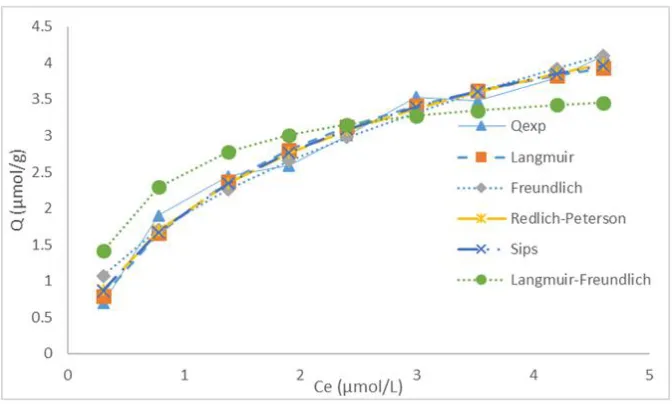
After choosing the overall best error method for determining the parameters of the isotherm models, the plots of different non-linear isotherm models with optimised values of the constants were presented in Figs. 10, 11 and 12, and calculated isotherm data are presented in Table 6.
Fig. 8. Non-linear kinetic study of hydroquinone removal onto the activated carbon MKC
Table 5. Kinetic parameters of different models
N° Models Constants Values R² RMSE χ²
Resocinol
1. Pseudo first order Qe (mg/g) 5.127 0.986 0.608 0.101
K1 (1/min) 0.0660
2. Pseudo second order Qe (mg/g) 6.789 0.976 0.775 0.171
K2 (g/min.mg) 0.0085
3. Elovich α (mg/g.min) 0.7495 0.954 0.804 0.154
β (g/mg) 0.6123
4. Intraparticle diffusion Kp (mg/g.min0.5) 0.718 0.931 1.351 0.656
C (mg/g) 0.151
Hydroquinone
1. Pseudo first order Qe (mg/g) 4.702 0.962 0.915 0.355
K1 (1/min) 0.0863
2. Pseudo second order Qe (mg/g) 5.941 0.938 1.167 0.524
K2 (g/min.mg) 0.0142
3. Elovich α (mg/g.min) 0.8757 0.8597 1.271 0.540
β (g/mg) 0.6842
4. Intraparticle diffusion Kp (mg/g.min0.5) 0.692 0.849 1.813 1.342
C (mg/g) 0.300
Cathecol
1. Pseudo first order Qe (mg/g) 4.708 0.923 1.287 0.554
K1 (1/min) 0.0624
2. Pseudo second order Qe (mg/g) 7.012 0.901 1.493 0.674
K2 (g/min.mg) 0.0058
3. Elovich α (mg/g.min) 0.6166 0.8352 1.469 0.663
β (g/mg) 0.6313
4. Intraparticle diffusion Kp (mg/g.min 0.5
) 0.744 0.863 1.858 0.641
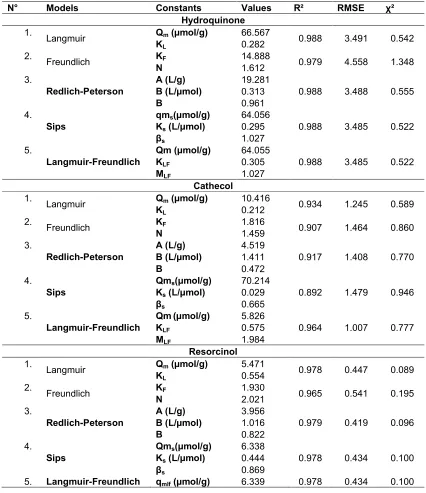
As can be seen from all the figures, the curve of Langmuir was the most consistent with a high R² (0.988; 0.934 and 0.978), a good χ² (0.542; 0.589 and 0.089) and a low RMSE (3.491; 1.245 and 0.447) respectively in the case of hydroquinone, cathecol and resorcinol, followed by Langmuir-Freundlich isotherm, with a high R² (0.988; 0.964 and 0.978), a good χ² (0.522; 0.777 and 0.1) and a low RMSE (3.485; 1.000
and 0.434) respectively in the case of hydroquinone, catechol and resorcinol.
Comparing the maximum adsorption capacity, Qm, of the 3 isomers, (Table 6) it is found that hydroquinone is more adsorbed: 66.5 μmol/g against 10.4 for catechol and 5.5 for resorcinol. Previous studies confirm the low adsorption of resorcinol compared with catechol [51,52]. The explanation lies in the solubility and spatial configuration of these isomers. Indeed, resorcinol is more soluble than catechol and catechol more
soluble than hydroquinone. The more soluble a substance is, the less it is adsorbed. The position of hydroxides on benzene also influences adsorption. Indeed, hydroquinone is a symmetrical molecule according to the position 1-4 of hydroxides on benzene. This configuration allows it to access the adsorption sites more easily and energetically favorable because of its greater stability.
Table 6. Parameters of isotherm adsorption of hydroquinone, catechol and resorcinol
N° Models Constants Values R² RMSE χ²
Hydroquinone 1.
Langmuir Qm (µmol/g) 66.567 0.988 3.491 0.542
KL 0.282
2.
Freundlich KF 14.888 0.979 4.558 1.348
N 1.612
3.
Redlich-Peterson
A (L/g) 19.281
0.988 3.488 0.555
B (L/µmol) 0.313
Β 0.961
4. Sips
qms(µmol/g) 64.056
0.988 3.485 0.522
Ks (L/µmol) 0.295
βs 1.027
5.
Langmuir-Freundlich
Qm (µmol/g) 64.055
0.988 3.485 0.522
KLF 0.305
MLF 1.027
Cathecol 1.
Langmuir Qm (µmol/g) 10.416 0.934 1.245 0.589
KL 0.212
2.
Freundlich KF 1.816 0.907 1.464 0.860
N 1.459
3.
Redlich-Peterson
A (L/g) 4.519
0.917 1.408 0.770
B (L/µmol) 1.411
Β 0.472
4. Sips
Qms(µmol/g) 70.214
0.892 1.479 0.946
Ks (L/µmol) 0.029
βs 0.665
5.
Langmuir-Freundlich
Qm(µmol/g) 5.826
0.964 1.007 0.777
KLF 0.575
MLF 1.984
Resorcinol 1.
Langmuir Qm (µmol/g) 5.471 0.978 0.447 0.089
KL 0.554
2.
Freundlich KF 1.930 0.965 0.541 0.195
N 2.021
3.
Redlich-Peterson
A (L/g) 3.956
0.979 0.419 0.096
B (L/µmol) 1.016
Β 0.822
4. Sips
Qms(µmol/g) 6.338
0.978 0.434 0.100
Ks (L/µmol) 0.444
βs 0.869
Fig. 9. Non-linear kinetic study of catechol removal onto the activated carbon MKC
Fig. 10. Non-linear adsorption isotherm of hydroquinone removal onto the activated carbon MKC
Fig. 12. Non-linear adsorption isotherm of Resorcinol removal onto the activated carbon MKC
4. CONCLUSION
Activated carbon was prepared from waste of monkey kola by pyrolysis and chemical activation with phosphoric acid H3PO4 at 450°C for 2 hours.
The prepared activated carbon was characterised by determining different parameters such as Iodine number, methylene blue number, FT-IR and EDX spectroscopy. This carbon was evaluated as adsorbent for the removal of hydroquinone, catechol and resorcinol in solution. The adsorption experiments were performed as a function of adsorbent dosage, pH and contact time. The percentage of removal increased with increasing contact time and dose of the adsorbent. Furthermore, the kinetics of the adsorption studies were fitted to a pseudo-first-order kinetic model at different concentrations. The equilibrium data were well-expressed by the Langmuir isotherm model. The present study suggests that activated carbon from waste of monkey cola is a low-cost and environmental friendly adsorbent that may be used for the removal of phenolic compounds from aqueous solutions.
COMPETING INTERESTS
Authors have declared that no competing interests exist.
REFERENCES
1. Rengaraj S, Moon SH, Sivabalan R, Arabindoo B, Murugesan V. Agricultural
solid waste for the removal of organics: Adsorption of phenol from water and wastewater by palm seed coat activated carbon. Waste Manag. 2002;22:543–548. Available:https://doi.org/10.1016/S0956-053X(01)00016-2
2. Molina-Sabio M. Phosphoric acid activated carbon discs for methane adsorption. Carbon N.Y. 2003;41:2113–2119.
Available:https://doi.org/10.1016/S0008-6223(03)00237-9
3. Eftaxias A, Font J, Fortuny A, Fabregat A, Stüber F. Catalytic wet air oxidation of phenol over active carbon catalyst. Global kinetic modelling using simulated annealing. Appl. Catal. B Environ. 2006;67: 12–23.
Available:https://doi.org/10.1016/j.apcatb.2 006.04.012
4. Agarry SE, Durojaiye AO, Yusuf RO, Aremu MO, Solomon BO, Mojeed O. Biodegradation of phenol in refinery wastewater by pure cultures of Pseudomonas aeruginosa NCIB 950 and Pseudomonas fluorescence NCIB 3756. Int. J. Environ. Pollut. 2008;32:3.
Available:https://doi.org/10.1504/IJEP.200 8.016894
5. Ekpete OA, Horsfall M. Kinetic sorption study of phenol onto activated carbon derived from fluted pumpkin stem waste (Telfairia occidentalis Hook. F). ARPN J. Eng. Appl. Sci. 2011;6:43–49.
carbons. Handb. Porous Solids. 2002;1– 17.
Available:https://doi.org/10.1002/97835276 18286
7. Menendez-Diaz JA, Martin-Güllon J. Types of carbons adsorbents and their production. Activated carbon Surfaces in Environmental Remediation, T.J. Bandosz (editor), Elsevier Ltd; 2006;1- 42.
8. Bansal RC, Goyal M. Activated carbon adsorption. Taylor & Francis Group, LLL. 2005;472.
9. Okigbo BN. Neglected plants of horticultural and nutritional importance in traditional farming systems of tropical Africa. IV Africa Symp. Hortic. Crop. 1977;53.
Available:https://doi.org/http://www.actahor t.org/books/53/53_18.htm
10. National Academy of Sciences. Lost Crops of Africa: Fruits. Washington D.C. USA: National Academies Press. 2008;3:381. Available:www.nap.edu.catalog.php?recor d_id=11879
11. Ho YS, Porter JF, Mckay G. Divalent metal ions onto peat: Copper, nickel and lead single component systems. Water, Air, Soil Pollut. 2002;141:1–33.
Available:https://doi.org/10.1023/A:102130 4828010
12. Foo BHK. Insights into the modeling of adsorption isotherm systems. Chem. Eng. J. 2010;156:2–10.
Available:https://doi.org/doi:10.1016/j.cej.2 009.09.013
13. Porter JF, McKay G, Choy KH. The prediction of sorption from a binary mixture of acidic dyes using single- and mixed-isotherm variants of the ideal adsorbed solute theory. Chem. Eng. Sci. 1999;54: 5863–5885.
Available:https://doi.org/10.1016/S0009-2509(99)00178-5
14. Shikuku VO, Kowenje CO, Kengara. Errors in parameters estimation using linearized adsorption isotherms: Sulfadimethoxine adsorption onto kaolinite clay. Chem. Sci.Inter. J. 2018;23(4):1-6.
15. Bilgili MS. Adsorption of 4-chlorophenol from aqueous solutions by xad-4 resin: Isotherm, kinetic, and thermodynamic analysis. J. Hazard. Mater. 2006;137:157– 164.
Available:https://doi.org/10.1016/J.JHAZM AT.2006.01.005
16. Othman MR, Amin AM. Comparative analysis on equilibrium sorption of metal
ions by biosorbent Tempe. Biochem. Eng. J. 2003;16:361–364.
Available:https://doi.org/10.1016/S1369-703X(03)00111-6
17. Wong YC, Szeto YS, Cheung WH, McKay G. Adsorption of acid dyes on chitosan - Equilibrium isotherm analyses. Process Biochem. 2004;39:693–702.
Available:https://doi.org/10.1016/S0032-9592(03)00152-3
18. Tchakala I, Bawa L, Djaneye-Boundjou G, Doni K, Nambo P. Optimisation du procédé de préparation des Charbons Actifs par voie chimique (H3PO4) à partir
des tourteaux de Karité et des tourteaux de Coton. Int. J. Biol. Chem. Sci. 2012;6: 461–478.
Available:https://doi.org/10.4314/ijbcs.v6i1. 42
19. ASTM. Standard Test Method for Moisture in Activated Carbon. Chem. Sci. Trans. 1999;6:461–478.
20. Lopez-Ramon MV, Stoeckli F, Moreno-Castilla C, Carrasco-Marin F. On the characterization of acidic and basic surface sites on carbons by various techniques. Carbon N. Y. 1999;37:1215– 1221.
Available:https://doi.org/10.1016/S0008-6223(98)00317-0
21. Nunes CA, Guerreiro MC. Estimation of surface area and pore volume of activated carbons by methylene blue and iodine numbers. Quim. Nova. 2011;34:472–476. Available:https://doi.org/10.1590/S0100-40422011000300020
22. Zhang J, Xie S, Ho YS. Removal of fluoride ions from aqueous solution using modified attapulgite as adsorbent. J. Hazard. Mater. 2009 ;165:218–222. Available:https://doi.org/10.1016/j.jhazmat. 2008.09.098
23. Akar T, Tunali S. Biosorption characteristics of Aspergillus flavus biomass for removal of Pb(II) and Cu(II) ions from an aqueous solution. Bioresour. Technol. 2006;97:1780–1787.
Available:https://doi.org/10.1016/j.biortech. 2005.09.009
24. Langmuir I. The adsorption of gases on plane surfaces of glass, mica and platinum. J. Am. Chem. Soc. 1918;40: 1361–1403.
25. Yang RT. Adsorbents Funddamentals and Applications; 2003.
26. Repo E, Malinen L, Koivula R, Harjula R, Sillanpää M. Capture of Co(II) from its aqueous EDTA-chelate by DTPA-modified silica gel and chitosan. J. Hazard. Mater. 2011;187:122–132.
Available:https://doi.org/10.1016/j.jhazmat. 2010.12.113
27. Sips R. On the structure of a catalyst surface. J. Chem. Phys. 1948;16:490–495. Available:https://doi.org/10.1063/1.174692 2
28. Nahm MH, Herzenberg LA, Little K. A New method of applying the Sips equation. J. Immunol. 1977;119:301–305.
29. Turiel E, Perez-Conde C, Martin-Esteban A. Assessment of the cross-reactivity and binding sites characterisation of a propazine-imprinted polymer using the Langmuir-Freundlich isotherm. Analyst. 2003 ;128:137–141.
Available:https://doi.org/10.1039/b210712k 30. Limousin G, Gaudet JP, Charlet L, Szenknect S, Barthès V, Krimissa M. Sorption isotherms: A review on physical bases, modeling and measurement. Appl. Geochemistry. 2007;22:249–275.
Available:https://doi.org/10.1016/j.apgeoch em.2006.09.010
31. Umpleby RJ, Baxter SC, Chen Y, Shah RN, Shimizu KD. Characterization of molecularly imprinted polymers with the Langmuir - Freundlich isotherm. Anal. Chem. 2001;73:4584–4591.
Available:https://doi.org/10.1021/ac010568 6
32. Jeppu GP, Clement TP. A modified Langmuir-Freundlich isotherm model for simulating pH-dependent adsorption effects. J. Contam. Hydrol. 2012 ;129–130: 46–53.
Available:https://doi.org/10.1016/j.jconhyd. 2011.12.001
33. Srivastava VC, Swamy MM, Mall ID, Prasad B, Mishra IM. Adsorptive removal of phenol by bagasse fly ash and activated carbon: Equilibrium, kinetics and thermodynamics. Colloids Surfaces A Physicochem. Eng. Asp. 2006;272:89– 104.
Available:https://doi.org/10.1016/j.colsurfa. 2005.07.016
34. Srihari V, Das A. The kinetic and thermodynamic studies of phenol-sorption onto three agro-based carbons. Desalination. 2008;225:220–234.
Available:https://doi.org/10.1016/j.desal.20 07.07.008
35. Gaid A, Kaoua F, Mederres N, Khodjsa M. Surface mass transfer processes using activated date pits as adsorbent. 1994;20: 4738.
36. El-Khaiary MI. Least-squares regression of adsorption equilibrium data: Comparing the options. J. Hazard. Mater. 2008;158:73– 87.
Available:https://doi.org/10.1016/j.jhazmat. 2008.01.052
37. Brown AM. A step-by-step guide to non-linear regression analysis of experimental data using a Microsoft Excel spreadsheet. Comput. Methods Programs Biomed. 2001;65:191–200.
Available:https://doi.org/10.1016/S0169-2607(00)00124-3
38. Kundu S, Gupta AK. Arsenic adsorption onto iron oxide-coated cement (IOCC): Regression analysis of equilibrium data with several isotherm models and their optimization. Chem. Eng. J. 2006;122:93– 106.
Available:https://doi.org/10.1016/j.cej.2006 .06.002
39. Devi VB, Jahagirdar AA, Zulfigar AMN. Adsorption of Chromium on activated carbon prepared from coconut shell. International Journal of Engineering Research and Applications. 2012;2:364-370.
40. Ilaboya IR, Oti EO, Ekoh GO, LOU. The role of renewable energies in sustainable development: Case study Iran. Iran. J. Energy Environ. 2013;4:320–329.
Available:https://doi.org/10.5829/idosi.ijee. 2013.04.04.
41. Devi B, Jahagirdar A, Ahmed M. Adsorption of chromium on activated carbon prepared from coconut shell. Adsorption. 2012 ;2:364–370.
42. Nono PN, Kamgaing T, Raoul D. Optimisation of catechol removal from aqueous solution by adsorption on activated carbon from corn cobs and coffee husk. Chem. Sci. Trans. 2016;5. Available:https://doi.org/10.7598/cst2016.1 247
43. Nwabanne JT, Igbokwe PK. Kinetics and Equilibrium Modeling of nickel adsorption by cassava peel. J. Eng. Appl. Sci; 2008. 44. Ndi JN, Ketcha JM, Anagho SG, Goghomo
prepared by pyrolysis of chemically treated Cola nut (Cola acuminata) Shells wastes and its ability to adsorb organics. Int. J. Adv. Chem. Technol. 2014;3:1–13.
45. Meldrum BJ, Rochester CH. In situ infrared study of the surface oxidation of activated carbon in oxygen and carbon dioxide. J. Chem. Soc. Faraday Trans. 1990;86:861– 865.
Available:https://doi.org/10.1039/FT990860 1881
46. Dong Jin Suh, Tae-Jin P, Son-Ki I. Effect of surface oxygen groups of carbon supports on the characteristics of Pd/C catalysts. Carbon N. Y. 1993;31:427–435. Available:https://doi.org/10.1016/0008-6223(93)90130-3
47. Tchuifon TDR, Anagho SG, Ketcha JM, Ndifor-angwafor NG, Ndi JN. Kinetics and equilibrium studies of adsorption of phenol in aqueous solution onto activated carbon prepared from rice and coffee husks. International Journal of Engineering and Technical Research. 2014;2(10):166–173. 48. Ofomaja AE. Sorptive removal of
Methylene blue from aqueous solution using palm kernel fibre: Effect of fibre dose. Biochem. Eng. J. 2008;40:8–18. Available:https://doi.org/10.1016/j.bej.2007 .11.028
49. Mohamed FS, Khater WA, Mostafa MR. Characterization and phenols sorptive properties of carbons activated by sulphuric acid. Chem. Eng. J. 2006;116: 47–52.
Available:https://doi.org/10.1016/j.cej.2005. 10.015
50. Muhammad M, Ali Khan M, Choong TSY. Adsorptive separation studies of beta-carotene from methyl ester using mesoporous carbon coated monolith. J. Chem. 2012;2013.
Available:https://doi.org/10.1155/2013/235 836
51. Kumar A, Kumar S, Kumar S. Adsorption of resorcinol and catechol on granular activated carbon: Equilibrium and kinetics. Carbon N. Y. 2003;41:3015–3025.
Available:https://doi.org/10.1016/S0008-6223(03)00431-7
52. Suresh S, Srivastava VC, Mishra IM. Isotherm, thermodynamics, desorption, and disposal study for the adsorption of catechol and resorcinol onto granular activated carbon. J. Chem. Eng. Data. 2011;56:811–818.
Available:https://doi.org/10.1021/je100303 x
_________________________________________________________________________________ © 2018 Patricia et al.; This is an Open Access article distributed under the terms of the Creative Commons Attribution License
(http://creativecommons.org/licenses/by/4.0), which permits unrestricted use, distribution, and reproduction in any medium,
provided the original work is properly cited.
Peer-review history:
![Table 1. Definitions of error functions and statistical comparison values [38]](https://thumb-us.123doks.com/thumbv2/123dok_us/8417843.1693016/6.612.96.520.228.701/table-definitions-error-functions-and-statistical-comparison-values.webp)