Navneet Kumar V, et al. J Sci Res Pharm, 2019;8(3):22-33 World Inventia Publishers
J
ournal of
S
cientific
R
esearch in
P
harmacy
http://www.jsrponline.com/Vol. 8, Issue 3, 2019 ISSN: 2277-9469 USA CODEN: JSRPCJ
Research Article
FORMULATION AND EVALUATION OF TRANSDERMAL PATCHES OF METFORMIN HYDROCHLORIDE Ajit Kumar Vishwakarma, Navneet Kumar Verma *
Department of Pharmaceutics, Kailash Institute of Pharmacy and Management, GIDA, Gorakhpur, UP-273209, INDIA.
Received on: 25-02-2019; Revised and Accepted on: 26-03-2019
ABSTRACT
T
he present study was investigated to transdermal patch formulation of Metformin hydrochloride. Preformulation study was successfully performed in which I drawn the calibration curve in different solvents after solubility study bulk density tapped density was calculated after complex formulation evaluated the uniformity of thickness, folding endurance, weight variation study,% moisture content, %moisture uptake, surface pH, percentage flatness study,% swellability, Drug content, percentage elongation break test, tensile strength, In-vitro drug release. In-vitro drug release studies good results. All the evaluation parameter give the satisfactory result.KEYWORDS: Metformin hydrochloride, HPMC, EC, In-vitro drug release.
INTRODUCTION
T
he transdermal drug delivery system has become one of the very most successful and innovative drug delivery system for research in pharmaceutical sciences. Transdermal drug delivery system are used to leading edge injectable and oral routes by increasing patient compliance and avoiding first pass metabolism respectively [1]. Transdermal drug deliverysystem is not only using controlled, constant administration of the drug, but also allows continuous input of drugs with short biological half-lives and eliminates pulsed entry into systemic circulation. The success of dermatological drug to be used for systemic drug delivery depends on ability of the drug to penetrate through skin in sufficient quantities to achieve the desired therapeutic effect [2]. Oral route is the vary most popular
route of drug delivery. Although it has some disadvantages including first pass metabolism, drug degradation in gastrointestinal tract due to enzymes, PH etc. To cross these problems, a novel drug delivery system was developed. Transdermal drug delivery system or medicated adhesive patches which deliver therapeutically effective amount of drug across the skin when it placed on skin. Medicated patches or transdermal patches are of different sizes, having more than one ingredient. Once they apply on unbroken skin they deliver active ingredients into systemic circulation passing via skin barriers. A patch containing high dose of drug inside which is retained on the skin for prolonged period of time,
*Corresponding author: Navneet Kumar Verma Department of Pharmaceutics,
Kailash Institute of Pharmacy and Management, GIDA, Gorakhpur, UP-273209, INDIA.
* E-Mail: [email protected]
DOI: https://doi.org/10.5281/zenodo.2609223
which get enters into blood flow via diffusion process. Drug can penetrate through skin via three pathways-through hair follicles, through sebaceous glands, through sweat duct. TDDS are used in various skin disorders, also in the management of angina pectoris, pains, smoking cessation & neurological disorders such as Parkinson’s disease [3, 4]. At present, the most
common form of delivery of drugs is the oral route.
MATERIALS AND METHOD
Materials:
Metformin hydrochloride (Hetero labs limited, Baddi), HPMC(S d fine-chem Limited, Mumbai), Ethyl cellulose (Kemphasol, Mumbai), dichloromethane, Polyethylene glycol 400 (S d fine-chem Limited, Mumbai), Propylene glycol (Thermo fisher scientific India Pvt. Ltd Mumbai), Ethanol (Changshu hongsheng fine chemical Co. Ltd)
Method:
Preformulation:
Prior to the development of dosage forms, it is essential that certain fundamental physical and chemical properties of potential drug molecules and other derived properties of the drug powder are determined. This information dictates many of the subsequent events and approaches in formulation development. This first learning phase is known as preformulation. The meaning of the word is quite literal in that it defines the steps to be undertaken before formulation proper. It is normal for preformulation to be performed on potential active drugs (at this stage often referred to as new chemical entities (NCES) or new drug candidates). In the case of the formulation of generic products of existing drugs, sufficient information is usually known prior to formulation. Preformulation will give pointers to the feasibility of the various possible dosage forms and to any potential problems of instability and poor in vivo dissolution, and thus bioavailability. It should also give some guidance to the suitability of potential excipients to be used in subsequent formulation [5].
Melting point:
The determination of melting point during preformulation studies is important since it is a simple test requiring only small amounts of material that can yield much valuable information regarding the thermal properties of the material. It can also assist at this stage in making predictions about the potential stability of the NCE. There is, for example, and possibly somewhat surprisingly, a link between melting point and solubility. This is discussed later in this section.
Techniques:
The melting point of a drug can be measured using these techniques.
1. Capillary melting 2. Hot stage microscopy
3. Differential scanning Calorimetry or thermal analysis.
1.Capillary melting
Capillary melting (the observation of melting in a capillary tube in a heated metal block) gives information about the melting range but it is difficult to assign an accurate melting point using this technique.
2. Hot stage microscopy:
This is the visual observation of melting under a microscope equipped with a heated and lagged sample stage. The heating rate is controllable and other transitions can be observed and recorded. It is more precise since the phase transitions (first melt, 50% melt and completion) can be registered on a recorder as the melting proceeds and, by virtue of high magnification, the values are more accurate.
3. Differential scanning calorimetry and differential thermal analysis:
Neither of the previous methods is as versatile as either differential thermal analysis (DTA) or differential scanning calorimetry (DSC). An additional advantage is that the sample size required for these is only 2-5 mg. DTA measures the temperature difference between the sample and a reference as a function of temperature or time when heating at a constant rate. DSC is similar to DTA, except that the instrument measures the amount of energy required to keep the sample at the same temperature as the reference, i.e. it measures the enthalpy of transition. When no physical or chemical change occurs within the sample then there is neither a temperature change nor input energy to maintain as isotherm however, when phase changes
occur then latent heat suppresses a temperature change and the isothermal energy required registers as an electrical signal generated by thermocouples. Crystalline transitions, fusion, evaporation and sublimation are changes in state which can be quantified [6].
Procedure:
The melting point of drug was estimated with the help of melting point apparatus and compared with values given in literature [7].
First powder the crystalline substance.
Take a capillary tube and seal one end by heating it.
Fill the capillary tube with the substance. To fill the tube, make a heap of the powdered substance on the porous plate. Push one end of the capillary tube into the heap. Some of the substance will enter the capillary tube.
Now tap the sealed end of the capillary tube on the porous plate gently. Fill the capillary tube upto 2-3 mm.
Attach the capillary tube to a thermometer using a thread. Take liquid paraffin in a beaker and place it over a piece of
wire gauze placed over a tripod stand.
Clamp the thermometer carrying the test tube to an iron stand and immerse them in the bath of liquid paraffin. The surface tension of the bath liquid is sufficient to hold the capillary tube in position.
Heat the beaker slowly while constantly stirring the contents using a stirrer to maintain a uniform temperature throughout.
When the temperature is within 15o of the melting point of the pure substance, the flame is reduced. Then the temperature rises slowly.
Note the temperature (t1) when the substance starts melting.
Again note the temperature (t2) when the substance has completely melted.
The average of the two readings gives the correct melting point of the substance
Solubility:
Solubility is an important phenomenon in pharmaceutical sciences. It plays very effective and prominent role in the formulations of dosage forms. Solubility of a compound in a particular solvent is defined as the concentration of the solute (compound) in a saturated solution at a certain temperature. In another term, it may be defined as the continuous interaction of two or more compound to form homogenous molecular dispersion [8]. The approximate
solubilities of the articles of the pharmacopoeia are given here primarily as information, they are not meant to be applied as tests for identifying materials. However, they may indirectly help in the preliminary evaluation of the integrity of an article. They have been indicated by descriptive terms in the accompanying table and have the following significance with reference to a temperature of 15º to 30º [9].
Table No. 1: Solubility
Descriptive term Parts of solvent required for part of solute Very soluble Less than 1
Freely soluble From 1 to 10
Soluble From 10 to 30
Sparingly soluble From 30 to 100
Very slightly soluble From 1000 to 10,000
Practically insoluble, or
insoluble 10,000 or more
Partition coefficient:
The oil- water partition coefficient is a measure of a molecule’s lipophilic characters that is, its preference for the hydrophilic or lipophilic phase. If a solute is added to a mixture of two immiscible liquids, it will distribute between the two phases and reach equilibrium at a constant temperature. The distribution of the solute (unaggregated and undissociated) between the two immiscible layers can be described thus: [10]
K=CU/CL
Where
K= is the distribution constant or partition constant CU= is the concentration of the drug in the upper phase CL= is the concentration of the drug in the lower phase
Procedure:
N-octanol and distilled water pre saturated with each for at least 24 hours before the experiment. To the pre-equilibrated water (10ml), known quantity of drug is dissolved. Then 10ml of octanol was added to equal volume of aqueous solution of a drug in a separating funnel. The system was kept for 24 hours with intermittent shaking. Finally, the aqueous layer was separated for 24 hours with intermittent shaking. Finally, the aqueous layer was separated, clarified by centrifugation and assayed spectrophotometrically [11-13].
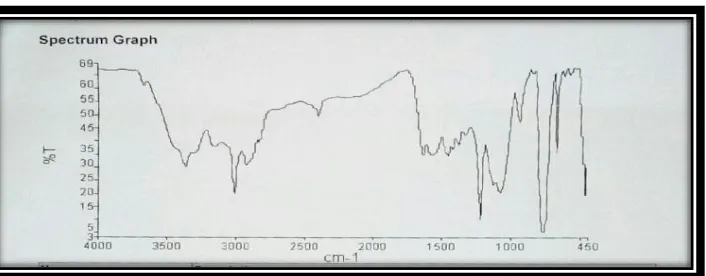
FTIR Study of Drug:
The physicochemical compatibility between Metformin HCL and polymers used in the films was studied by using fourier transform-infrared(FT-IR, shimadzu Co.,Japan) spectroscopy. The pellatization was done by the KBr pellet method. The FT-IR spectra were recorded in the wavwlength region between 4000 and 400 cm-1. The spectra obtained for Metformin HCL and physical mixtures of Metformin HCL with polymers were compared.
Ultra-violet spectroscopy:
Preparation of stock solution in water:
Metformin hydrochlorides were accurately weighed 10mg and transferred to 10 ml volumetric flask. Drug was dissolved in 5 ml of water shaken manually for 10 minute and volume was made up to the mark with the same solvent. This was the standard mother solution containing 1mg/ml (1000µg/ml). 1ml of this prepared solution was pipette out and transferred to the 10 ml volumetric flask, and volume made up to 10 ml with same solvent to obtained final concentration 0.1mg/ml (100µg/ml i.e. stock solution).2.5 ml solution is pipette out from stock solution and transferred to 25 ml volumetric flask. This concentration found to 10µg/ml solution.
Spectrophotometric scanning of Metformin hydrochloride in water:
An appropriate portion of 1, 2, 3, 4, and 5 ml of Metformin hydrochloride stock solution in water was pipette out and transferred to separate 10 ml volumetric flask and then volume made up to 10 ml with water to obtain concentration 1,2,3,4 and 5 µg/ml. the solution were scanned separately between 200 nm to 400 nm. The spectrum of drug was recorded. Wavelength 232 nm was selected for further study.
Preparation of calibration curve of Metformin hydrochloride in water:
Taken a series of concentration of ranging between 1-5 µg/ml. absorbance was measured using spectrophotometer at 232 nm against water as blank. Standard calibration curve was plotted as absorbance against concentration. Beer’s law obey the concentration range between 1-5 µg/ml.
Preparation of saline pH 7.4 phosphate buffer:
Dissolve 2.38 g of disodium hydrogen phosphate, 0.19 g of potassium dihydrogen phosphate and 8.0 g of sodium chloride in sufficient water to produce 1000 ml.
Preparation of stock solution in phosphate buffer pH 7.4:
Metformin hydrochlorides were accurately weighed 10mg and transferred to 10 ml volumetric flask. Drug was dissolved in 5 ml of phosphate buffer pH 7.4, shaken manually for 10 minute and volume was made up to the mark with the same solvent. This was the standard mother solution containing 1mg/ml (1000µg/ml). 1ml of this prepared solution was pipette out and transferred to the 10 ml volumetric flask, and volume made up to 10 ml with same solvent to obtained final concentration 0.1mg/ml (100µg/ml i.e. stock solution).2.5 ml solution is pipette out from stock solution and transferred to 25 ml volumetric flask.this concentration found to 10µg/ml solution.
Spectrophotometric scanning of Metformin hydrochloride in phosphate buffer pH 7.4:
An appropriate portion of 1, 2, 3, 4, and 5 ml of Metformin hydrochloride stock solution in phosphate buffer pH 7.4 was pipette out and transferred to separate 10 ml volumetric flask and then volume made up to 10 ml with phosphate buffer pH 7.4 to obtain concentration 1,2,3,4 and 5 µg/ml. the solution were scanned separately between 200 nm to 400 nm. The spectrum of drug was recorded. Wavelength 232 nm was selected for further study.
Preparation of calibration curve of Metformin hydrochloride in phosphate buffer pH 7.4:
Taken a series of concentration of ranging between 1-5 µg/ml absorbance was measured using spectrophotometer at 232 nm against phosphate buffer as blank. Standard calibration curve was plotted as absorbance against concentration.
Preparation of calibration curve of Metformin hydrochloride in plasma using HPLC method
The HPLC method reported by Abolghasem Jouyban et al; (2011) was followed for estimation of Metformin hydrochloride in biological sample.
Equipment:
The HPLC was performed with a modular system consisting of a variable wavelength UV visible detector and auto sampler.
Mobile phase:
Mobile phase consisted of a mixture of methanol: water (75:25).
Preparation of stock solution and standard curve:
Aliquots were prepared by transferring 0.1, 0.2,---up to 0.5ml to a series of 10 ml volumetric flasks and mixed with 0.2ml of rat plasma homogenate and the volume was made up to 10ml then all aliquots were filtered by whattman filter paper. The solution was then injected in the 200µl loop attached to the pump, the mobile phase was run at the rate of 1 ml/min. detection were done at 232 nm sample concentration were calculated by measuring covered area and plotting against standard concentration.
Micromeritics:
Micromeritics is the science of small particle, a particle is any unit of matter having defined physical dimensions it is important to study particles because most drug dosage forms are solids, solids are not static systems, the physical state of particles can be altered by physical manipulation, and particle characteristics can alter therapeutic effectiveness micromeritics is the study of a number of characteristics, including particle size and size distribution, shape, angle of repose, porosity, true volume, bulk volume, apparent density, and bulkiness [14].
Bulk density (Db):
It is the ratio of total mass of powder to the bulk volume of powder. It was measured by pouring the weight powder (passed through standard sieve # 20) into a measuring cylinder and initial weight was noted. This initial volume is called the bulk volume. From this the bulk density is calculated according to the formula mentioned below. It is expressed in g/ml and is given by
Db = M/Vb
Where M is the mass of powder, Vb is the bulk volume of the powder.
Tapped density (Dt):
It is the ratio of total mass of the powder to the tapped volume of the powder. Volume was measured by tapping the powder for 750 times and the tapped volume was noted if the difference between these two volume is less than 2% .if it is more than 2%, tapping is continued for 1250 times and tapped volume was noted. Tapping was continued until the difference between successive volumes is less than 2% (in a bulk density apparatus). It is expressed in g/ml and given by
Dt= M/Vt
Where, M is the mass of powder, Vt is the tapped volume of the powder.
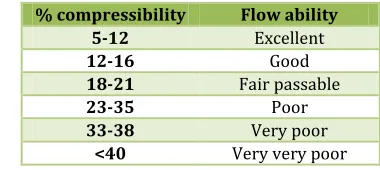
Carr’s index or % compressibility:
It indicates powder flow properties. It is expressed in percentage and is give
I = Dt-Db/Dt×100
Where, Dt is the tapped density of the powder and Db is the bulk density of the powder.
Table No. 2: Relationship between % compressibility and flow ability [15]
% compressibility Flow ability
5-12 Excellent
12-16 Good
18-21 Fair passable
23-35 Poor
33-38 Very poor
<40 Very very poor
Hausner’s ratio:
Hausner’s ratio is an indirect index of ease of powder flow. It is calculated by the following formula.
Hausner’s ratio = tapped density/bulk density
Lower Hausner’s ratio (<1.25) indicates better flow properties and higher Hausner’s ratio (>1.25) indicates poor flow properties [16].
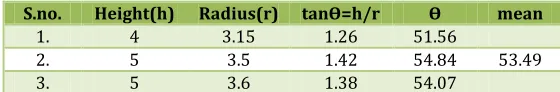
Angle of repose:
The angle of repose is a relatively simple technique for estimating the flow properties of a powder. It can easily be determined by allowing a powder to flow through a funnel nd fall freely onto a surface, the height and diameter of the resulting cone are measured and the angle of repose calculated from this equation.
tanϴ = h/r
where,
h= is the height of the powder cone r= is the radius of the powder cone [17].
Table No. 3: Angle of repose as an indication of powder flow properties [18]
Angle of repose(degrees) Type of flow
<20 Excellent
20-30 Good
30-34 Passable*
>40 Very poor
Fixed funnel method:
In this method a funnel is fixed at a particular height weighed amount of the sample is allowed to flow through the funnel. The height of the cone formed and the circumference is determined. The radius can be calculated from the diameter or the area. Angle of repose is given as ϴ=tan-1 h/r [19].
Table No. 4: Formulation of Transdermal patch of Metformin hydrochloride
Formulation Metformin
hydrochloride (mg) Drug polymer ratio DRUG:HPMC:EC PEG & propylyne glycol (30%) ml Solvent ratio ethanol: DCM
F1 500 1:1 1 1:1
F2 500 1:2 2 1:1
F3 500 1:3 3 1:1
F4 500 1:0:1 1 1:1
F6 500 1:0:3 3 1:1
F7 500 2:1:1 1 1:1
F8 500 1:1:1 2 1:1
F9 500 1:1.5:1.5 3 1:1
Evaluation:
1. Physical appearance
The patches were visually inspected for colour, flexibility, smoothness and homogeneity [20].
2. Uniformity of thickness:
The uniformity of thickness of transdermal patches was measured by micrometer with least count of 0-0.1 mm. at five different points the thickness of the patch was measured and the average of five readings with the standard deviation was calculated [21].
3. Folding endurance:
The prepared patches were measured manually for folding endurance. The folding of the patches was repeated at the same place till they broke. The accurate value of folding endurance was given by the number of times the patches could be folded at the same place without breaking [21, 22].
4. Weight variation study:
Three randomly selected patches from each formulation were used. For weight variation test, 3 films from each batch were weighed individually and the average weight was calculated [23, 24].
5. Moisture content:
The prepared patches were marked, then individually weighed and kept in a vacuum desiccator containing anhydrous calcium chloride at room temperature for 24 hrs. the patches were individually weighed until they showed a constant weight. The percentage of moisture content was calculated as a difference between initial and final weight with respect to final weight [25-27].
% of moisture content = (X-Y/Y)*100
Where,
X= initial weight, Y= final weight
6. Moisture uptake:
The weighed patches were kept for drying in vacuum desiccator at normal room temperatue for 24hrs upto a constant weight and then exposed to 84% relative humidity (saturated solution of potassium chloride) [25-27].(25-27)
% of moisture uptake = (Y-X/X)*100
Where,
X = initial weight, Y = final weight
7. Surface pH:
The surface pH was determined by allowing the patches to swell by keeping them in contact with 0.5 ml of phosphate buffer saline for 1 h. then the pH paper was brought in contact with the surface of the swollen patch. Then mean of three reading was recorded [28].
8. Percent flatness study:
From each transdermal pacth the preparing strips were cut out, one from the centre and two from the either side. The variation in the length and the length of each strip was measured because of non-uniform in flatness which was measured by determining % of constriction, considering 0% constriction is equivalent to 100% flatness [23].
% of constriction = l1 – l2 / l2
Where,
l1 = initial length of each strip and l2 = final length of each strip.
9. Swellability:
The drug loaded patch was weighed and then placed in a petridish to which 50 ml of phosphate buffer (pH 7.4) was added. The patches were weighed after every 10 minutes until constant weight was attained. The difference in weight gives the weight increase because of absorption of water. The percentage swelling is given by the following equation [29, 30].
% S = (Xt – X0) / X0 × 100
Where,
X0 is the weight of the patch at zero time Xt is the weight of the patch after time t.
10. Drug content:
A specified area of patch is to be dissolved in a suitable solvent in specific volume. Then the solution is to be filtered through a filter medium and analyze the drug contain with the suitable method (UV or HPLC technique). Then the average of three different samples is taken [31].
11. Percentage elongation break test:
The percentage elongation break is to be determined by noting the length just before the break point, the percentage elongation can be determined from the below mentioned formula [32].
Elongation percentage = L1 – L2 / L2 × 100
Where,
L1 is the final length of each strip L2 is the initial length of each strip.
12. Tensile strength:
Modified spring balance method was used for this study. From the centre of circular patch square strips of transdermal patch (1.8×1.8) were cut. The patch was attached to hook at one end and in gradually increasing manner load was applied on the other end. Reading on the spring balance was noted at the point at which the patch tears from the centre that was divided by the area of transdermal strip to give tensile strength in g/cm2 [33].
13. In-vitro drug diffusion study:
15ml volume with 2cm2 area. The receptor compartment was filled 15ml of phosphate buffer pH 7.4; the activated dialysis membrane was mounted on the flange of the diffusion cell receptor compartment. The prepared transdermal patch with surface area 2cm2 placed on center of membrane, the donor compartment was then placed in position and the two valves of the cell clamped together. The whole assembly was kept on a magnetic stirrer and solution in the receptor compartment was constantly and continuously stirred using a magnetic bead and 32±1ºc maintained [34].
RESULT AND DISCUSSION
Melting point analysis:
Melting point determined by using capillary melting point method, melting point of Metformin hydrochloride was found to be 222ºC. This was matching to the literature value 222-226ºC indicating the identity and purity of drug sample.
Solubility study of Metformin hydrochloride:
Table No. 5: Solubility study of Metformin hydrochloride in different solvent
S.no. Solvent Drug solubility
1. Water Soluble
2. Ethanol Slightly soluble 3. Acetone Practically insoluble 4. Methanol Practically insoluble 5. Petrolium ether Practically insoluble
Partition coefficient:
K=CU//CL Where
K is the distribution constant or partition constant, CU is the concentration of the drug in the upper phase and CL is the concentration of the drug in the lower phase.
Table No. 6: Partition coefficient
S.no. Absorbance of
upper layer Concentration of upper layer(CU) (µg/ml) Absorbance of lower layer Concentration of lower layer (CL) (µg/ml) K=CU/CL mean
1. 0.317 1.396 0.826 3.638 0.383
0.383
2. 0.316 1.392 0.825 3.634 0.383
3. 0.317 1.396 0.826 3.638 0.383
Result- The partition coefficient of Metformin hydrochloride is found to be 0.383.
FT-IR study:
The Preformulation studies were carried out to study the compatibility of pure drug (Metformin HCL) with polymers for preparation of transdermal patch of Metformin hydrochloride. The individual spectra of pure drug and
polymers as combination spectra of drugs and polymers shown in fig. which indicates no interaction between Metformin HCL and polymers when compared with spectra of pure drug as all functional group frequencies were present
Fig. 1: IR spectra of Metformin hydrochloride
Fig. 3: IR spectra of Metformin hydrochloride and ethyl cellulose
Fig. 4: IR spectra of Metformin hydrochloride and HPMC and ethyl cellulose
Spectrophotometric Methods for Estimation of Metformin Hydrochloride by UV:
Spectrophotometric scanning of Metformin hydrochloride in water and phosphate buffer pH 7.4: The solutions containing
Metformin hydrochloride (µg/ml) were prepared in water and phosphate buffer pH 7.4 and prepared solutions were scanned for absorption maxima in range of 200-400 nm. The λ max obtained was recorded.
Fig. 5: Spectra of Metformin hydrochloride
Calibration curve for the estimation of Metformin hydrochloride in water: Calibration curves of Metformin hydrochloride were prepared according to the method described in section methodology. The absorbance values of the
Fig. 6: Calibration curve of Metformin hydrochloride in water
Calibration curve for the estimation of Metformin hydrochloride in phosphate buffer pH 7.4: Calibration curve of Metformin hydrochloride were prepared according to the method described in section methodology. The absorbance
values of the dilutions, given in table below prepared in the concentration range of 1-5 µg/ml in phosphate buffer pH 7.4. the data were plotted without standard deviation and the calibration curves obtained followed Beer’s-Lambert law.
Fig. 7: Calibration curve of Metformin hydrochloride in phosphate buffer pH 7.4
Calibration curve for the estimation of Metformin hydrochloride in biological sample: Calibration curve of Metformin hydrochloride were prepared according to the
method described in section methodology. The absorbance values of the dilutions, given in table below prepared in the concentration range of 1-5 µg/ml in phosphate buffer pH 7.4.
Fig. 8: Calibration curve of Metformin hydrochloride in biological sample
Micromeritics properties: Bulk density:
Weight of powder=M Bulk volume of powder=V
Bulk density = [mass of powder/bulk volume of powder]
Tapped density:
Weight of powder=5g No. of tapping= 100
tapped density=[mass of powder/tapped volume of powder]
Carr’s index or % compressibility:
Where,
Dt is the tapped density of the powder
Db is the bulk density of the powder.
Hausner’s ratio:
Hausner’s ratio = tapped density-bulk density
Lower hausner’s ratio (<1.25) indicates better flow properties (>1.25) indicates poor flow properties.
Angle of repose:
tanϴ=h/r
where,
h is the height of the powder cone
r is the radius of the powder cone.
Radius=3.15, height= 4 Radius=3.5,height=5 Radius=3.6,height=5
Table No. 7: Bulk density
S.no. Mass of powder[M] Volume of powder[V] Bulk density Average bulk density
1. 5 11 0.4545
2. 5 12 0.4166 0.4094g/cm3
3. 5 14 0.3571
Result- Thebulk density of powder was found to be 0.4094g/cm3.
Table No. 8: Tapped density
S.no. Mass of powder[M] Volume of powder[V] Tapped density Average tapped density
1. 5 8 0.625
0.6018g/cm3
2. 5 9 0.5555
3. 5 8 0.625
Result- Tapped density of powder was found to be 0.6018g/cm3.
Table No. 9: Carr’s index or % compressibility
S.no. Tapped density Bulk density Tapped
density-bulk density Tapped density-bulk density/tapped density
Tapped density-bulk density/ tapped density×100
Average Carr’s index
1. 0.625 0.4545 0.1705 0.2728 27.28
31.71%
2. 0.5555 0.4166 0.1389 0.2500 25.00
3. 0.625 0.3571 0.2679 0.4286 42.86
Result- The compressibility index was found to be 31.71%. hence the type of flow of powder is poor.
Table No. 10: Relation between % compressibility and flow ability
% compressibility Flow ability
5-12 Excellent
12-16 Good
18-21 Fair passable
23-35 Poor
33-38 Very poor
<40 Very very poor
Table No. 11: Hausner’s ratio
S.no. Tapped density Bulk density Tapped density/bulk density Average Hausner’s ratio
1. 0.625 0.4545 1.37
1.48
2. 0.5555 0.4166 1.33
3. 0.625 0.3571 1.75
Result- hasuner’s ratio was found to be 1.48%, therefore it indicates poor flow.
Table No. 12: angle of repose
S.no. Height(h) Radius(r) tanϴ=h/r ϴ mean
1. 4 3.15 1.26 51.56
2. 5 3.5 1.42 54.84 53.49
3. 5 3.6 1.38 54.07
Table No. 13: Angle of repose as an indication of powder flow properties
S.no. Angle of repose(degrees) Type of flow
1. <20 Excellent
2. 20-30 Good
3. 30-34 Passable
4. >40 Very poor
Table No. 14: Evaluation of transdermal patches
Formulation Physical
appearance thickness (mm) Uniformity of endurance Folding Weight variation study(mg)
F1 ++ 0.284 172 102
F2 ++ 0.28 174 102.33
F3 ++ 0.286 177 101.66
F4 ++ 0.23 175 104
F5 ++ 0.236 182 104.33
F6 ++ 0.226 179 101
F7 ++ 0.286 178 102.33
F8 ++ 0.288 185 103
F9 ++ 0.278 187 104.33
Table No. 15: %Moisture content, %Moisture uptake, Surface pH and Percent flatness study%
Formulation %Moisture content %Moisture uptake Surface pH Percent flatness study (%)
F1 1.22 1.92 6.5 100
F2 1.9 1.65 6.6 100
F3 1.86 1.61 6.7 100
F4 1.61 1.87 6.7 100
F5 1.63 1.97 6.7 100
F6 1.56 1.56 7 100
F7 1.56 1.94 6.9 100
F8 1.63 1.67 6.9 100
F9 1.58 1.28 6.3 100
Table No. 16: % swellability, Percentage elongation break test and Tensile strength g/cm2
Formulation % swellability Percentage elongation break test Tensile strength g/cm2
F1 8.49 66.66 155.32
F2 10.37 55.55 157.82
F3 10.28 77.77 159.83
F4 14.28 61.11 160.93
F5 15.38 72.22 161.83
F6 16.19 61.11 162.63
F7 15.88 83.33 163.33
F8 25 88.88 164.13
F9 20.19 94.44 289.00
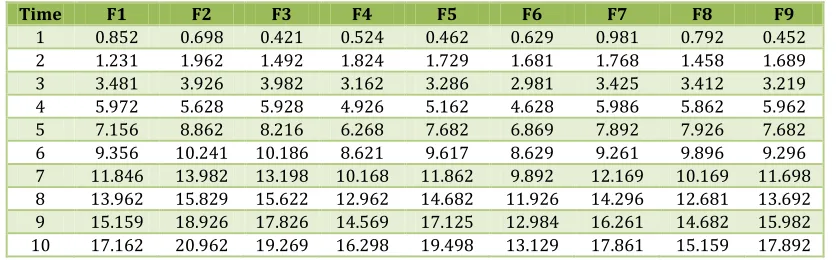
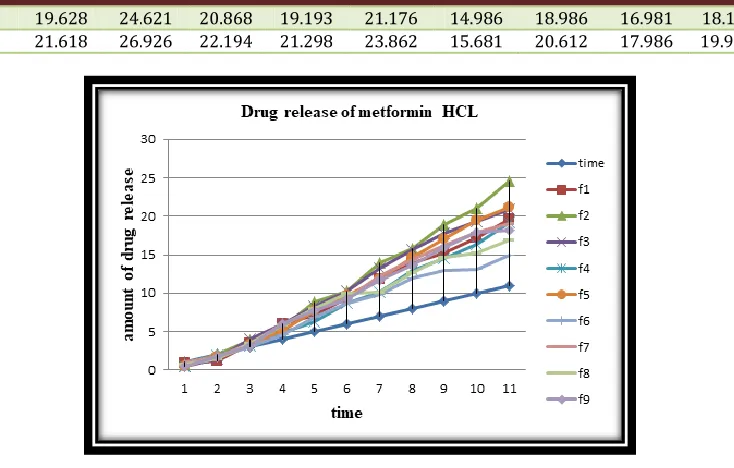
Table No. 17: In-vitro drug release
Time F1 F2 F3 F4 F5 F6 F7 F8 F9
11 19.628 24.621 20.868 19.193 21.176 14.986 18.986 16.981 18.125 12 21.618 26.926 22.194 21.298 23.862 15.681 20.612 17.986 19.972i
Fig. 9: Drug release profile of Metformin HCl
CONCLUSION
I
n the present study, an attempt was made to deliver the ant diabetic drug Metformin HCL, through transdermal route in the form of transdermal films. Transdermal films of matrix type were prepared by mercury substrate method. The films were thin, flexible and transparent. All the formulations F1-F9 satisfactorily qualified the evaluation parameters of uniformity of thickness, folding endurance, weight variation, %moisture content, % moisture uptake, surface pH, percent flatness study, % swell ability, drug content, percentage elongation break test, tensile strength and in-vitro drug release. Processing of preparation of patch was non complicated. Vary simple and economic, still meeting requirements of systemic administration of drug. from the absorbed parameters it was concluded that the formulation F2 is the best give the reading of evaluation- uniformity of thickness 0.28±0.014142, folding endurance 174±2.081666, weight variation 102±2.81666, %moisture content 1.9±0.04, %moisture uptake 1.65±0.597746, surface pH 6.6,% flatness study 100,% swell ability 10.37, drug content 95%, % elongation break test 55.55, tensile strength 157.82±4.51, in-vitro drug releases 89.753%.all the evaluation parameters gives the result all satisfactory.REFERENCES:
1. Jain NK. Advances in controlled and novel drug delivery, 1stEd., CBS Publishers and distributors, New Delhi .2001;108-110.
2. Barry BW, William AC. In: Swarbrick J(ed)) BoylonJC.Encyclopedia of pharmaceutical technology vol-II, Marcel Dekker: Inc New York. 1995;49-93.
3. Arti Kesarwani, Ajit Kumar Yadav, Sunil Singh, Hemendra Gautam, Haribansh N. Singh, Anamika Shvarma, Chitresh Yadav. A review – Theoretical aspects of Transdermal Drug Delivery System. Bullet Pharm Res 2013 ;3(2):78-89. Received: May 09, 2013 / Revised: August 27, 2013 /Accepted: August 28, 2013.
4. Sampath Kumar KP, Debjit Bhowmik and Chiranjib B, RM. Chandira. A review- Transdermal Drug Delivery System - A NovelDrug Delivery System and its market scope and opportunities. Int J Pharm & Bio Sci 2010;1(2).
5. Vigersky RA, Filmore-Nassar A, Glass AR. Thyrotropin suppression by Metformin. J Clin Endocrinol Metab
2006;91(1):225-7.
6. Aulton Michael E. Aulton’s Pharmaceutics the design and manufacture of medicines, third edition, churchill livingstone ELSEVIER, third edition 2007, reprinted 2008, page no. 337.
7. Aulton Michael E. Aulton’s Pharmaceutics the design and manufacture of medicines, third edition, churchill livingstone ELSEVIER, third edition 2007, reprinted 2008, page no. 347.
8. Matt V, waterman J, lan McNab, et al. basic physiology of the skin, basic science, surgery, 2010;469-472.
9. RS. Gaud and GD. Gupta. Practical physical pharmacy, first edition-2001, reprint-2008, CBS publishers and distributors, page no. 106.
10. Indian Pharmacopoeia. Published by the indian pharmacopoeia commission, ghaziabad, 2007 ;1:142-143.
11. Loyd V. Allen, Jr. Nicholas G. Popovich, Howard C. Ansel. Ansel’s Pharmaceutical dosage forms and drug delivery systems, eighth edition, published by wolters kluwer, page no. 110.
12. Yie. W. chien. Drug delivery polymers used in the development of transdermal delivery.
13. William AC and Barry BW. Penetration enhancers. Adv Drug Deliv Rev 2004;56:603-618.
14. Baker W and Heller J. Material selection for transdermal delivery systems, in transdermal drug delivery:developmental issues and research initiatives, J. hadgraft and R.H. guys, eds. Marcel dekker, inc.,new york,
1989;293-311.
15. Loyd V. Allen, Jr. Nicholas G. Popovich, Howard C. Ansel. Ansel’s pharmaceutical dosage forms and drug delivery systems, eighth edition, published by wolters kluwer, page no. 189.
16. A. Kailash Kumar, Hemant KS. Yadav. Fast dissolving tablets-A review. world J Pharm & Pharm Sci 3(3):678-701.
ansel, ansel’s pharmaceutical dosage forms and drug delivery systems, eighth edition, published by wolters kluwer, page no. 189.
18. Loyd V. Allen, Jr. nicholas G. Popovich, Howard C. Ansel. Ansel’s Pharmaceutical dosage forms and drug delivery systems, eighth edition, published by wolters kluwer, page no. 163.
19. Michael E. Aulton. Aulton’s Pharmaceutics the design and manufacture of medicines, third edition-2007, reprinted-2008, churchill livingstone Elsevier, page no. 356. 20. Dr. Shyamala Bhaskaran. Physical Pharmaceutics, fourth
edition-2012-2013, published by birla publications Pvt. Ltd., page no.107.
21. Nair RS, Ling TN, Shukkoor MSA. J Pharm Res
2013;6:774-779.
22. Arora P. mukherjee B. Design development of physicochemical in vitro and in vivo evaluation of transdermal patches containing diclofenac diethylammonium salt. Ind J Pharm Sci
2002;91(9):2076-89.
23. Kevin C. Garala, Anil J. Shinde, Pratik H. shah. Formulation and in-vitro characterization of monolithic matrix transdermal systems using HPMC/eudragit s 100 polymer blends. Int J Pharm & Pharm Sci 2009 ;1(1):108-120.
24. Sathyapriya LS, Jayapakash S, Prabhu RS, Abirami A, Subramanian K, Nagarajan M. Int J Pharm Sci Tech
2008;1:22-28.
25. Saxena M, mutalik S and reddy MS. Formulation and evaluation of transdermal patches of metoclopramide hydrochloride. Ind Drug 2006;43(9):740-45.
26. Arijit D, Sibaji G, Biplab KD & Sudip D. A novel technique for treating the type-II diabetes by transdermal patches
prepared by using multiple polymer complexes. Int J Pharm Res & Develop 2010; 9:195-204.
27. Gupta JRD, Irchhiaya R, Garud N, Tripathi P, Dubey P & Patel JR. Formulation and evaluation of matrix type transdermal patches of glibenclamide. Int J Pharm Sci & Drug Res 2009;1(1):46-50.
28. Gupta R, Bajpai M & Bhattacharya A. Formulation and in vitro evaluation of transdermal drug delivery system of tizanidine hydrochloride. J Pharm Res 2008 ;7(4):208-213.
29. Sharma R, mehra GR. Preparation characterization and in vitro in-vivo evaluation of transdermal matrix films of celecoxib. Acta Pharmaceutica Sciencia 2011;53(1): 67-69.
30. Sakalle P, Dwivedi S, Dwivedi A. design, evaluation, parameters and marketed products of transdermal patches : A review. J Pharm Res 2010;3(2):235-240. 31. Somasundaram J, sundarapandian R, posina A,
muthumanickam A, mohamed TSS, madhusudhana CC. design and evaluation of meloxicam: malaysian journal of pharmaceutical sciences 2010;8(2):25-43.
32. Rhaghuram reddy K, muttalik S, reddy S. once- daily sustained-release matrix tablets of nicorandil: formulation and invitro evaluation. AAPS Pharm Sci Tech
2003;4:4.
33. Wade A, weller P.J., handbook of pharmaceutical recipients, washington, DC: american pharmaceutical publishing association 1994;362-366.
34. Gupta SP and jain SK. Effective and controlled transdermal delivery of metoprolol tartarate. Ind J Pharm Sci 2005;67(3):346-350.
How to cite this article:
Ajit Kumar Vishwakarma, Navneet Kumar Verma. FORMULATION AND EVALUATION OF TRANSDERMAL PATCHES OF METFORMIN HYDROCHLORIDE. J Sci Res Pharm 2019;8(3):22-34. DOI: https://doi.org/10.5281/zenodo.2609223
Conflict of interest: The authors have declared that no conflict of interest exists. Source of support: Nil