Lincoln University Digital Thesis
Copyright Statement
The
digital
copy
of
this
thesis
is
protected
by
the
Copyright
Act
1994
(New
Zealand).
This
thesis
may
be
consulted
by
you,
provided
you
comply
with
the
provisions
of
the
Act
and
the
following
conditions
of
use:
you
will
use
the
copy
only
for
the
purposes
of
research
or
private
study
you
will
recognise
the
author's
right
to
be
identified
as
the
author
of
the
thesis
and
due
acknowledgement
will
be
made
to
the
author
where
appropriate
you
will
obtain
the
author's
permission
before
publishing
any
material
from
the
thesis.
Breaking the Parasite lifecycle
A thesis
submitted in partial fulfilment
of the requirements for the Degree of
Masters of Agricultural Science
at
Lincoln University
by
Marsha Andrea Martin-Mckie
Lincoln University
Abstract of a thesis submitted in partial fulfilment of the
requirements for the Degree of Masters of Agricultural Science
Abstract
Breaking the Parasite lifecycle
by
Marsha Andrea Martin-Mckie
This thesis investigates the use of either liquid urea or effective microorganism solutions to break the parasite lifecycle while outside of its host and reduced larval challenge on pasture. The main aim was to extend in vitro results of urea and Effective micoorganisms on egg development in the field. The field study was performed in a replicated randomized block design at the Lincoln University Lincoln Sheep Research Farm from February 9th 2016 to April 22,2016 on 0.71 ha of newly sown rye grass
(Lolium perenne) and white clover (Trifolium repens) pasture. Five-month-old Romney lambs that were naturally infected with gastrointestinal parasites through grazing contaminated pastures and which had not received anthelmintic treatment for a minimum of six weeks rotationally grazed the areas to seed the pasture with fresh contamination for two-days in each plot before being moved to an adjacent plot, giving eight replicates of treatment across time. Immediately upon the removal of lambs from each plot, the areas were topically sprayed with the equivalent of 200 litres per ha of either flowfert N (Ravensdown Ltd) (40 units per ha), effective microorganism mixture (EM; Nature farm Ltd) or water (H2O) with each treatment replicated twice within each time, giving 16 replicates in total. Following
seeding of the pasture with contamination, lambs were given anthelmintic and allowed to graze worm free pastures for seven days. Lambs were weighed and allocated to one of six groups of five animals that were balanced for live weight and then allowed to graze a treatment, grazing each area of the same treatment for two days. Variables such as pasture larval contamination and pasture mass was recorded immediately prior to grazing on each plot with post-grazing pasture mass also recorded. Animal performance and faecal egg count measurements were recorded weekly. Further, on one day of treatment, six trays each of which contained 100 grams of fresh sheep faeces averaging 800 eggs per gram were placed on respective treatment plots, they were sprayed with the respective treatment then left overnight before being taken to the laboratory and cultured for 10 days at 25 ◦C. In addition,
Overall, both Effective microorganism (EM) solutions and urea had little influence on breaking the parasite lifecycle when applied in the field. For pasture larval contamination, lamb FEC, LW and DMI, there were no significant difference. This may reflect the design of the field study which the two days rotation provided an opportunity for half of the eggs to hatch. In vitro results suggested urea has a very potent effect on egg development with 98 % reduction. In the field, urea may have inadvertently encouraged Nematodirus development, which may either be from increased irrigation of 12 h, or the amount of urea that penetrated the faecal mass, may not have being sufficient when dealing with faeces of different moisture or different surface area as well as pH, which was not measured in the field. In addition, in vitro laboratory results, with plastic bag and field study shows little development in egg hatching. Although the disparity is not clearly understood between the field and the in vitro
results, the possibility of an artificial high ammonia concentration was ruled out. Overall, urea may provide an opportunity to break the parasite lifecycle, but further investigations are needed in the field.
For the EM treatment, in vitro results showed an increase of 2.5-fold in egg development which did not different from the field trial. Further investigation may be worthwhile to see if treatments of EM can be designed to stimulate larval development when survival on pasture is low at times of the year and non-susceptible stock can be grazed to effectively reduce contamination.
Acknowledgements
I would like to take this time to thanks the eternal father for giving me health and strength throughout my journey of study.Let me say special thank you to all the persons involved and contributed towards my trial. Firstly, my sponsor MFAT for providing financial support and granting me the opportunity to further my studies in New Zealand. Special thanks to the Government of Jamaica for granting me leave of absence from my work to take up the opportunity to study. Secondly, to my supervisor Dr Andrew Greer, senior lecturer in the faculty of agriculture and life science for allowing me to participate in this trial. I am very grateful for your deepest gratitude, kindness, guidance,patience and encouragement throughout the trial both in the field, analysis and write up.Thirdly, to Mr Robin McAnulty parasitologist for his expertise guidance in the labaratory. I am very grateful for the time and effort you took in teaching me the different types of procedures in the lab.Special thanks to Mrs Rosemarie and Annabell McAnulty for assisting me with the making up of the solutions, counting of faecal eggs and cleaning up .To everyone who rendered their support in the field and lab such as co-supervisor Mr Chris Logan, JML staff ,Caleb, James, Rebecca ,from the soils department Dr Roger Croswell and Qian Liang and other staff from the RIDDOLS lab.
I would also like to say special thanks to Dr Miriam Hodge Biometrician for the design of the trial and statistical support,Mrs Sue Bowie NZAID administrator for support and mentoring. To the library teaching and learning staff, Catriona, Sarah,Adrian and Dean Oconnel statistican.To my friends at Lincoln University Daniel, Joseph, Reny and abroad Dr George Grant, Allison, Annmarie, Camda,Clanece and flatmates Vanitha,Anitha and Pushpanjali, thanks you all for your kind support, encouragement and guidance throughout this thesis.
Finally, to my sister Kareen Martin who has taken the time out to take care of my son D’mario Mckie,
Table of Contents
Abstract ... ii
Acknowledgements ... iv
Table of Contents ... v
List of Tables ... vii
List of Figures ... viii
List of abbreviations ... xi
Introduction ... 1
1.1 Aim of the study ...2
1.2 Objectives: ...2
1.3 Hypothesis of Study...2
Literature review ... 3
2.1.1 Impacts of parasitism ... 3
2.1.2 Parasite epidemiology and larval challenge on pasture ... 3
2.1.3 Distribution of Trichostrongylus colubriformis and Teladorsagia circumcincta on New Zealand Pastures ... 4
2.1.4 Distribution of Nematodirus species on New Zealand Pastures ... 4
2.2 Lifecycle of Gastrointestinal Nematode ...4
2.3 Factors Influencing Nematode Development and survival ... 6
2.3.1 Temperature and nematode development ... 6
2.3.2 Temperature and larval survival ... 6
2.3.3 Moisture and oxygen and nematode development ... 7
2.3.4 Moisture and larval survival ... 7
2.3.5 pH and nematode development ... 8
2.3.6 pH and larval survival ... 8
2.3.7 Ultra violet light and larval survival ... 8
2.4 Measuring parasites and parasitism ...9
2.4.1 Faecal Egg count ... 9
2.4.2 Pasture larval contamination ...10
2.4.3 Herbage Cutting Vs Herbage Plucks ...10
2.4.4 The Baermann Apparatus ...11
2.5 Control options for nematode parasites ... 11
2.5.0 Effective Microorganism E.M. ...12
2.5.1 Effective Microorganism in waste water treatment facility ...12
2.5.2 Effect of Effective Microorganism on egg hatching ...12
2.6 Nitrogen based Fertilizer ...12
2.6.1 Effects of Nitrogen based Fertilizers on Ascaris suum in waste water treatment facility ...12
Methodology ... 15
3.1 Experimental site ... 15
3.2 Experimental design ... 15
3.3 Grazing Study ... 17
3.4 Measurements and sampling ... 17
3.4.1 Pasture Larvae ...18
3.4.2 Animal measurement...18
3.4.3 Faecal egg count ...19
3.4.4 Pasture Measurements ...19
3.4.5 Metabolisable Energy Analysis (ME) ...19
3.5 In vitro larval culture ... 20
3.6 Second in vitro larvae culture ‘with and without plastic bag method’ ... 20
3.7 Statistical analysis... 21
Chapter 4 Results for field study ... 22
4.1 Field Trial ... 22
4.1.1 Pasture Mass ...22
4.1.2 Pasture Larvae Contamination...24
4.1.3 Faecal Egg Count ...31
4.1.4 Animal Performance ...35
Chapter 5 Results for in vitro studies ... 36
5.1 In vitro larvae culture when topically applied ... 36
5.2 In vitro larvae culture when topically applied and incubated with and without cover ... 37
Chapter 6 Discussion ... 38
Chapter 7 Conclusion/ Recommendation ... 42
Appendix A ... 43
7.3 Rotation grazing in 10 x 10-meter plot ... 43
List of Tables
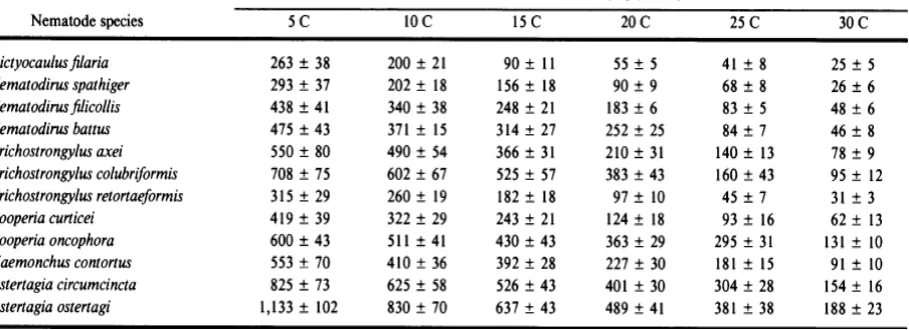
Table 2.1 Relationship between temperature and median survival times of the infective larvae ….5
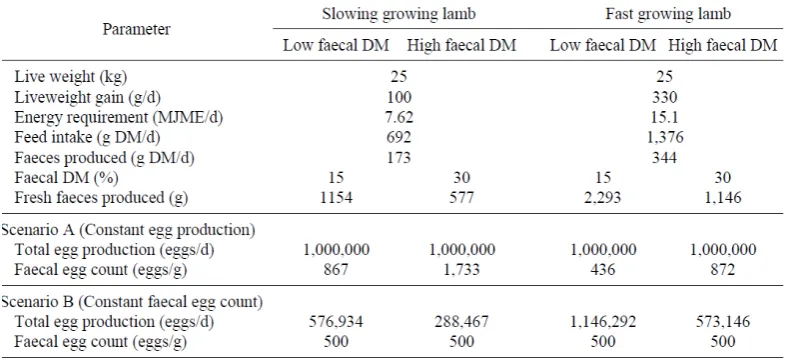
Table 2.2 Simulation of the impact of faecal output on the interpretation of faecal egg counts (FEC) based on the feed consumption required to meet the energetic requirement of a 25kg lamb growing at either 100 or 330 g per day with faecal moisture of either 15% or 30%. Herbage quality is assumed at 11mega joules of metabolizable energy (MJME) per kg Dry matter (DM) with a DM digestibility of 75%. Scenario A: Expected FEC when total egg production is constant at 1,000,000 eggs per day. Scenario B: Expected total egg production when FEC is constant at 500 eggs per g ………….13
Table 4.1 Mean live weight (LW; kg per treatment), total dry matter intake (DMI; kgDM) and feed conversion efficiency (FCE; gLW per kgDM consumed) from day 1-32 for animals grazing areas that had received the equiavalent of 200 l per ha of either water (H2O), effective microorganism mixture (EM)
List of Figures
Figure 2.1 The Life cycle representing gastrointestinal nematodes of small ruminants………….………9
Figure 2.2 Percent non-motile H. contortus L3 larvae when exposed for 4 h to N (18g/100ml) and bleach
(10%) solutions. Bars represents least significant difference. Bleach vs. all other compounds; LNF (liquid N fertilizer) vs. all other N sources; Urea (U) vs. ammonium nitrate (AN); AN+ U mixture vs. AN and U (p< 0.7871); SE= 0.44……….13
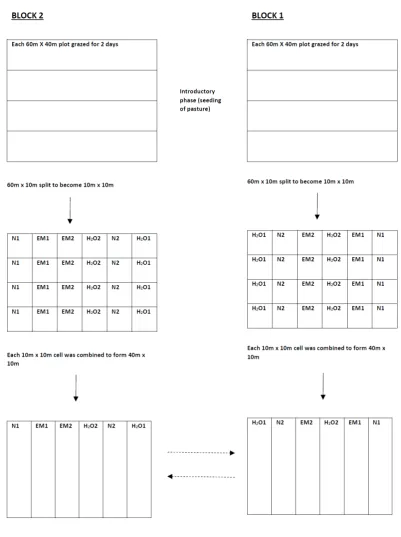
Figure 3.1 Schematic diagram of the treatment plots……….…………16
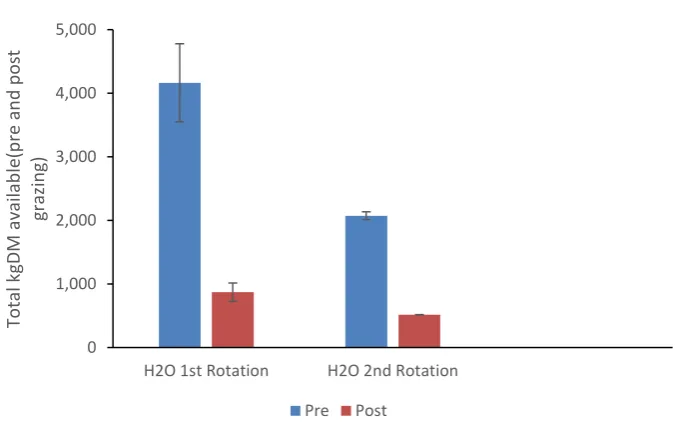
Figure 4.1.Mean Pre-and Post-Grazing Herbage mass (kgDM available) for plots treated with water (H2O) 16 and 23 days post treatment. Plots areas were 100m2 during first grazing rotation and 400m2
during second grazing rotation………22
Figure 4.2. Mean Pre-and Post-Grazing Herbage mass (KgDM per ha) for plots treated with 20% liquid urea solution (N) for 16 and 23 days post treatment. Plots size were 100m2 during first grazing rotation
and 400m2during second………23
Figure 4.3. Mean Pre-and Post-Grazing Herbage mass (KgDM per ha) for plots treated with EM for 16 and 23 days post treatment. Plots size were 100m2 during first grazing rotation and 400m2 during
second……….24
Figure 4.4.Number of Strongyle L3 per KgDM recovered from plots that were treated with either water
(H2O), 20% liquid urea solution (N) or effective micro-organism mixture (EM) 16 days, 23 and 32 days
post treatment………25
Figure 4.5. Number of Nematodirus L3 per kgDM in plots that were treated with either water (H2O),
20% liquid urea solution (N) or effective micro-organism mixture (EM) 16 days post treatment after the first grazing rotation and 23 days post treatment after the second grazing rotation………….26
Figure 4.6.Total apparent cumulative Strongyle larval intake per plot with data from the outlier on day 10 and 17 included for treatment with either water (H2O),20% liquid urea solution (N) or effective
micro-organism mixture (EM) during the first grazing rotation after treatment (D1-16) and second grazing rotation (D17-31). Plots size were 100m2 during first rotation and 400m2 during rotation
Figure 4.7 Total apparent cumulative Strongyle intake larvae per plot with data from the outliers on day 10 and 17 removed for treatment with either water (H2O), 20% liquid urea solution (N) or effective
micro-organism mixture (EM) during the first grazing rotation after treatment (D1-16) and second grazing rotation (D17-31). Plots size were 100m2 during first rotation and 400m2 during rotation 2……28
Figure 4.8.Total apparent cumulative Nematodirus L3 intake with data from the outlier on day 17
included for treatment with either water (H2O), 20% liquid urea solution (N) or effective
micro-organism mixture (EM) during the first grazing rotation after treatment (D1-16) and second grazing rotation (D17-31). Plots size were 100m2 during first rotation and 400m2during rotation 2………29
Figure 4.9.Total apparent cumulative Nematodirus L3 larvae intake per plot with data from the outlier
on day 17 removed from treatment with either water (H2O), 20% liquid urea solution (N) or effective
micro-organism mixture (EM) during the first grazing rotation after treatment (D1-16) and second grazing rotation (D17-31). Plots size were 100m2 during first rotation and 400m2 during rotation
2………30
Figure 4.10.Arithmetic mean Strongyle FEC (epg) from day 1-32 for animals grazing areas that had received the equiavalent of 200 l per ha of either water (H2O), effective microorganism mixture (EM)
or 20% liquid urea solution (N). Animals were removed from treatment plots at day 32 and followed up to day 48 in a non-treatment paddock………31
Figure 4.11.Arithmetic mean Nematodirus FEC (epg) for animals grazing areas that had received the equiavalent of 200 l per ha of either water (H2O), effective microorganism mixture (EM) or 20% liquid
urea solution (N). Animals were removed from treatment plots at day 32 and followed up to day 48 in a non-treatment paddock……….32
Figure 4.12.Total estimated daily Strongyle faecal egg output for animals grazing areas that had received the equiavalent of 200 l per ha of either water (H2O), effective microorganism mixture (EM)
or 20% liquid urea solution (N). NB. Faecal output was only estimation up until day 32 when lamb were
grazing plots that were measured for pre and post grazing mass………..33
Figure 4.13.Estimated Nematodirus faecal egg production for animals grazing areas that had received the equiavalent of 200 l per ha of either water (H2O), effective microorganism mixture (EM) or 20%
liquid urea solution (N). NB. Faecal output was only estimation up until day 32 when lamb were grazing
Figure 4.14. Mean LW (kg ± s.e.m) for lambs grazing pastures treated with water (H2O), 20% liquid urea solution (N) or effective micro-organism mixture (EM) post grazing………35
Figure 5.1. Number of L3 larvae recovered from 100g of faeces after culturing for 10 days following
topical application with the equivalent of 200 litres per ha with either water (H2O), effective
micro-organism mixture (EM) or 20% liquid urea (N). Values are arithmetic means ± s.e.m………….……….36
Figure 5.2 Number of L3 larvae recovered per g of faeces after culturing for 10 days at the equivalent
of 2 ml of water (H2O) and liquid urea (N) with and without a plastic bag covering the trays during
List of abbreviations
ANOVA Analysis of variance BOD Biological oxygen demand CO2 Carbon dioxide
CM Centimetre
COD Chemical oxygen demand
◦C Degree Celsius DM Dry matter DMI Dry matter intake EPG Egg per gram
EM Effective microorganism FEC Faecal egg count FCR Feed conversion ratio ~ Greek Perispomeni G Grams
GIN Gastrointestinal nematode GLWG Gram live weight gain > Greater than
Ha Hectare H2O Water
H Hour i.e. That is Kg Kilogram
KgDM Kilogram dry matter LW Live weight
LWG Live weight gain L1 First stage larvae
L2 Second stage larvae
L3 Third stage larvae
L4 Fourth stage larvae
L5 Fifth stage larvae
ME Metabolisable energy Mg/L Milligram per litre Mg
MJME/KGDM Milligram
ML Millilitre N Nitrogen
NH3 Ammonia
OMD Organic Matter Digestibility PPM Parts per million
/ Per
± Plus, or minus % Percentage
pH Power of hydrogen
r2 Coefficient of determination
s.e.m Standard error of the mean
spp specie
UV Ultra Violet VS Versus
Introduction
Parasitism is a major cause of lowered production and productivity in livestock globally, especially in
small ruminants. The lowered production and productivity is caused by a reduction in feed intake and
feed conversion efficiency which are directly proportional to the size of the larval challenge (Coop et
al., 1982), thus leading to economic loss, and has further implications for both public health and food
security (Van Houtert, 1997).
The cost for treating sheep and cattle with anthelmintic in New Zealand annually has been estimated
to be NZ $59 million (McKenna, 1997), globally it was reported to be USD 3 billion and in the United
Kingdom alone was GBP 84 million (Jackson et al., 2009). Parasitism is currently controlled by
anthelmintic which are losing effectiveness through gradual, but inevitable, development of resistance
within the parasite population. Maintaining animal performance in the face of anthelmintic resistance
requires novel and sustainable approaches to control nematode epidemiology and biology (Leathwick
et al., 1992; Waller, 2003). Most treatment regimes focus on treating the parasite population within
the host, targeting the parasite when outside the host may be an alternative solution.
Ninety percent of the parasite population on New Zealand farms may exist outside its host, depending
on time of the year and environmental conditions (Familton and McAnulty, 1997). In Australia few as
3% of the Haemonchus parasite is harboured by sheep (Familton and McAnulty, 1997) as such,
targeting this population and affecting parasite development outside of the host may be an attractive
option and provide an additional tool to aid parasite control. Development for both human (Fidjeland
et al., 2016; Pecson et al., 2007; Pecson and Nelson, 2005) and sheep (Howell et al., 1999) parasites
has been shown to be reduced in the presence of both Nitrogen fertilizers while parasite egg hatching
is also reduced in acidic conditions. Furthermore, in vitro studies have shown both liquid urea solution
and Effective micro-organism (EM) solutions to almost completely inhibit egg hatching for both
Teladorsagia circumcincta and Trichostrongylus colubriformis (Cairns et al., 2017; Lewis, 2013 honours
dissertation, Lincoln University). However, while in vitro studies indicate the application of either of
these products may have the potential to break the parasite lifecycle through inhibiting development,
1.1 Aim of the study
The major aim of this research was to extend the in vitro laboratoryresults done on Teladorsagia circumcincta and Trichostrongylus colubriformis by Cairns et al. (2017) on the ability of liquid urea solution (N) and by Lewis (2013) on Effective microorganism solution (EM). This will be further investigated in the field by topical application to fresh faeces to effectively interrupt the parasite lifecycle.
1.2 Objectives:
• Determine the effectiveness of application of liquid Urea or EM in vitro
• Evaluate the impact of treatment to break the parasite lifecycle in grazing lambs.
1.3 Hypothesis of Study
Literature review
2.1.1 Impacts of parasitism
Gastrointestinal nematode parasites cause loss in production in the young lamb. Infection causes
reduced live weight gain, faecal scouring, reduced wool growth, reduced nutrient utilization and
increased endogenous N loss. Although the extent of production loss is directly proportional to larval
challenge, some variability between species exists. Steel et al. (1980) observed reductions of 51% and
65% in live weight (LW) gain in lambs infected with 3000 and 9500 T. colubriformis L3 larvae per week,
respectively. In comparison, infections with Ostertagia (Teladorsagia) circumcincta of 37,500 and
120,000 L3 larvae per week resulted in reductions in LW gain of 37% and 53% respectively (Symons et
al., 1981). Moreover, Coop et al. (1982) reported lambs receiving 1000, 3000 and 5000 T. colubriformis
L3 larvae per day had live weight gains that were 90%, 75% and 53% respectively, of the uninfected
control with only a small proportion of this loss recovered when lambs were treated with anthelmintic
every 21 days. This suggests that larval challenge or the developing larvae rather than adult worms,
per se, was the major cause of production loss. Furthermore, an additional 17 days to reach the
required slaughter weight has been reported in lambs treated with an anthelmintic with a low efficacy
(Miller et al., 2012). Therefore, in the context of providing effective parasite control, reducing larval
challenge will help reduce the impact of parasitism on livestock production.
2.1.2 Parasite epidemiology and larval challenge on pasture
Parasite larval challenge on pasture can vary, with larvae per kilogram of dry matter ranging from
0-30,000, and is dependent on the growth of pasture, as fast-growing pasture reduces the larval
concentration (Familton and McAnulty, 1997). Larval contamination on pasture varies from year to
year and typically has two peaks, Spring and Autumn (Vlassoff, 1973). In ewes, their immune response
temporarily declines during late pregnancy and early lactation, known as the peri-parturient relaxation
in immunity, and results in ewes becoming susceptible to nematode infection (Vlassoff, 1973).This
gives rise to a small peak in pasture contamination in the spring which are then consumed by the lamb
(Brunsdon, 1971; Vlassoff, 1973; Vlassoff et al., 2001).
Young lambs are more vulnerable to infections than adult sheep due to their lack of an effective
immune response (McKenna, 1981). Lambs that remain on pasture are then subsequently exposed to
larvae developed from eggs deposited by ewes in the spring and then subsequent generations which
are multiplied through the lambs themselves (Brunsdon, 1963 ; Vlassoff, 1973, 1976). Pasture infection
levels then typically decline in mid (January-February) when the temperature increases, peak in the
autumn when warmth and available moisture are abundant and then decline in winter as larval
development slows and grazing lambs begin to acquire an effective immune response (Brunsdon,
2.1.3 Distribution of Trichostrongylus colubriformis and Teladorsagia circumcincta on New Zealand Pastures
In the South Island and Southern North Island, Trichostrongylus colubriformis and T. circumcincta, are the predominant species present, and can be foundmainly in the abomasum and small intestine of animal (Charleston, 1982). Trichostrongylus colubriformis is a threat to young lambs 5-6 months old and is seldom seen in lambs 6-9 months of age (Tetley, 1934).
Teladorsagia circumcincta, causes damage to the acid producing cells of the abomasum, resulting in interference of protein digestion due to increased endogenous losses and increase pH of the abomasal fluid (Familton and McAnulty, 1997). On pasture they can be found from early June onwards (Crofton, 1957) and are threats to young lambs 3-6 months of age (Tetley, 1934).
2.1.4 Distribution of Nematodirus species on New Zealand Pastures
Nematodirus species are found in the small intestines of ruminants being a threat in young lambs up to 6 months-of-age (Charleston, 1982; Tetley, 1935). On New Zealand pastures they can survive extremely low temperatures and can be commonly found in the South Island (Charleston, 1982). Their lifecycle slightly differs from the other trichostrongylids where development to the infective stage occurs within the egg and is slower, requiring periods of chilling before hatching may occur (Charleston, 1982). There are two species of Nematodirus of relevance in New Zealand, they are N. spathiger and
N. filicollis. Both species develop at different rates, being more rapid in N. spathiger than N. filicollis
(Brunsdon, 1963; Charleston, 1982) and can be easily differentiated by their egg shell. For N. filicollis, its eggshell is oval and is about .0003 centimetre in thickness to the side, while for N. spathiger its eggshell is about .0003 to .0004 cm thicker at the sides, .0005 to .0008 cm at the poles and the shell is more pointed at the poles (Tetley, 1935). They are present on pastures in three peaks, the smaller peak occurs in spring and the two larger peaks in summer and autumn February & March (Brunsdon, 1960, 1963).
2.2 Lifecycle of Gastrointestinal Nematode
Gastrointestinal nematode parasites mostly share a similar direct lifecycle (Gordon, 1948) with the exception of Nematodirusspp (Figure 2.1) (Charleston, 1982). Sexual reproduction occurs between the adults in the lumen of the alimentary tract of the host with the resultant eggs laid by the female then excreted in the faeces by its host. The eggs remain inside the faeces where they are protected from desiccation. Under optimum conditions the eggs hatch within 15 to 20 hours to the first stage larvae L1 but this differs between species (Gordon, 1948). The L1 larvae feed off microorganisms within the
faecal pat until shedding its cuticle and becoming the second stage larvae (L2). The L2 larvae continue to feed within the faecal pat until reaching the L3 stage at which point the
desiccation (Familton and McAnulty, 1997; Gordon, 1948). The L3 larvae does not feed due to the
retained cuticle utilizing its body reserves to survive for periods of up to 12 months (Familton and McAnulty, 1997). In the field, development rates vary between species and climatic conditions, with development to the L3 stage taking 2-3 weeks or more (Charleston, 1982). Under favourable conditions
when moisture is adequate the L3 then migrates from the faeces onto herbage via water films, before
being ingested by it hosts (Familton and McAnulty, 1997; Gordon, 1948).
Figure 2.1 The Life cycle representing gastrointestinal nematodes of small ruminants (Roeber et
al.,2013)
After ingestion by a definitive host, the L3 larvae then exsheath in the digestive tract of it host in
response to changes in carbon dioxide (CO2), temperature and pH before reaching the infective site
(Familton and McAnulty, 1997). Once reaching the infective site the larvae develop into L 4 then
borrows into the mucosal crypt. While inside the mucosal crypt it takes a period of 8 to 10 days before the L4 larvae moults into L5 which becomes sexually mature adults over a further period of 7 to 10 days.
2.3 Factors Influencing Nematode Development and survival 2.3.1 Temperature and nematode development
In New Zealand, seasonal variation throughout the year in different regions favours the development of most gastrointestinal nematode (Vlassoff, 1982). On New Zealand pastures, nematode larvae are present throughout the year regardless of the different regions, with most regions experience dry warm summer and wet cool winters (Vlassoff, 1982). Development of larvae on pasture is temperature dependent, with little development occurring below 5◦C and above 35◦C, while optimum development
occurs between 15 to 30◦C depending on the parasite specie (Familton and McAnulty, 1997; Silverman
and Campbell, 1959; Vlassoff, 1982). In laboratory conditions, Haemonchus contortus L3 larvae develop
in culture at temperature of 20 to 35◦C (Veglia, 1916) while optimum development of T. circumcincta
L3 larvaehas been reported to occur at 16◦C (Pandey et al., 1989) and between 8 to 15◦C for N. battus
(van Dijk and Morgan, 2008). In the field, development may take longer than in the laboratory due to diurnal temperature fluctuations. In most months, less than 1% of larvae reach the infective stage and may increase to 20-25% in late summer to early autumn when the conditions of warmth and moisture are met (Vlassoff, 1982).
2.3.2 Temperature and larval survival
Larval survival is dependent on temperature and although variation between species does exist, larvae can survive for extended periods on pasture. Morgan (2011) reported 2% of trichostrongylid spp
present on pasture after 24 hrs during high temperatures and relative humidity and the numbers then changed with time as larvae move to escape the heat from solar radiation (Vegora, 1960; Vlassoff, 1982). Regardless of the time of day, most L3 larvae are found at the lower 10 cm of pasture and then
return to heights of above 15 cm (Gazda et al., 2009) when temperature decreases (Vegora, 1960; Vlassoff, 1982). Throughout seasons most T.circumcincta L3 larvae were present for up to 11 months
on pasture but decreases in survival were observed during the summer months when temperature and humidity were at the greatest (Holasova,et al., 1988). This may have resulted from anhydrobiosis,
which decreases the metabolic activity of the L3 larvae during low and high temperatures on pasture,
allowing them to survive repeated desiccation and rehydration (Lettini and Sukhdeo, 2006). In laboratory conditions, Boag and Thomas, (1985) reported T. colubriformis species survived at 5◦C for
708 days, decreasing to 95 days at 30◦C (Table 2.1). Further, Andersen and Levine, (1968) found 7%
and 10% of T. colubriformis L3 larvae survived for 128 days during desiccation at temperature of -95◦C
and 35◦C respectively, while for the L
1 and L2 larvae they survived for only 8 days at 30◦C, demonstrating
Table 2.1 Relationship between temperature and median survival times of the infective larvae
Source: Boag and Thomas, (1985)
2.3.3 Moisture and oxygen and nematode development
Moisture is essential for the development of the L1 and L2 larvae which are regarded as aquatic and
requires small water films, which can be in the form of rainfall, evaporation, dew and precipitation for migration to the pasture sward (Familton and McAnulty, 1997). In the field especially during dry summers, development to the infective stage may take longer in the faecal pat which may be due to optimal moisture and oxygen occurring at different times (Charleston, 1982; Familton and McAnulty, 1997). Studies has shown hardened faecal crust requires regular to light rainfall and humid conditions for rapid emergence of L3 larvae (Wang et al., 2014). Similarly, Khadijah et al. (2013) reported rainfall
and high soil moisture content after faecal deposition increase development of H. contortus and T. colubriformis L3 larvae by 28%, allowing the conclusion that faecal moisture and soil moisture content
have a positive linear relationship when using simulated rainfall. This was further corroborated by
O’Connor et al. (2007) who found 78, 70 & 58% of H. contortus L3 larvae developed in faeces and soil
when respective simulated rainfall was 12, 24 and 32 mm, which increased respective faecal moisture content to 28, 36 and 43 %. On the other hand, the crust from the faeces act as protection during desiccation, by retaining moisture and allowing larvae to develop to the infective stage, then emerges into the pasture sward when moisture is available (Familton and McAnulty, 1997).
2.3.4 Moisture and larval survival
the larvae require to migrate, with 1.27 and 0.04% Trichostrongylid larvae climbing wetted and unwetted grass blades, respectively (Silangwa and Todd, 1964).
2.3.5 pH and nematode development
There is limited information available on the influence of pH on larval development for sheep gastrointestinal nematodes. Khatun et al. (2013) reported that pH influences larval development with 39.5% of H. contortus L3 larvae developing at pH 6, which then reduced to 3.3% at pH 3. These results
are consistent with those of Ashad et al. (2013) who reported 39.4% and 4.4% of H. contortus L3 larvae
developed at pH 6.5 and 3 respectively, and no development at pH 2. Further, Misra and Ruprah (1973) and Stringfellow (1986) have reported reduced egg hatching of H. contortus at pH 11.5 compared with the optimum which appeared to be in the range of pH 6.5 to 8.5. In contrast, Dick and Leland (1973) reported that a weak acid pH of 6.4 to 6.9 resulted in no development for Cooperia punctata with most development occurring at a pH range of 7.6-8.1, suggesting that C. punctata development favours alkaline pH. Recently Cairns et al. (2017) reported little or no egg hatching of T. colubriformis when pH is less than 5 but unaffected at pH 6-13.
2.3.6 pH and larval survival
There is limited information on pH and larval survival for gastrointestinal nematodes, although there is some evidence from other species which supports the importance of pH. In sewage sludge treated with 10% lime and 85% calcium oxide, Ascaris suum eggs survived for 3 months at pH 12 (Eriksen et al., 1996). In comparison, treatment of sewage sludge with 1% ammonium at pH 10, egg viability was reduced by 33% after 21 days with no survival after 40 days (Ghiglietti et al., 1997). In addition, Katakam et al. (2014) observed pH of 6.33-9.08 in pig slurry had no effect on egg hatching, but the addition of 2% urea reduced eggs of both A. suum and A. galli by 50% at pH 8.35-9.28 respectively. Maya et al. (2012) reported pH of 5.3 and 12.7 reduced helminth and non-helminth eggs when the right combination of dryness, pH, contact time and increased temperature were in place. They observed temperature of 45◦C and pH 5.3 and 12.7, respectively, resulted in helminth and
non-helminth larvae surviving for 6 and 90 days, respectively, when dryness was 90%.
2.3.7 Ultra violet light and larval survival
Larval survival on pasture is dependent on the amount of UV or sunlight radiation penetrating the faecal mass or pasture sward. Overgrazing of pasture can expose eggs and larvae to sunlight which can be deleterious for larval survival (Stewart and Douglas, 1938). This was further corroborated by Shorb (1943) who found no survival of H. contortus L2 and L3 larvae when they were placed on grass plots and
bare ground in faeces during sunlight and with increased temperature in the summer. In laboratory conditions, 6 days of constant ultra violet (UV) radiation of nematode species N. battus, T. circumcincta
In addition, Schwartz and Price (2011) reported H. contortus L1 and L3 larvae that were exposed to UV
radiation survived for 30 hours and 2 weeks respectively, indicating the sensitivity to UV is dependent on larval stage.
2.4 Measuring parasites and parasitism
2.4.1 Faecal Egg count
Diagnosis of gastrointestinal parasitism is often undertaken using a faecal egg count (FEC), which is a determination of the concentration of nematode eggs per gram of fresh faeces. The main aim of a FEC is for the estimation of the number of worm eggs present in the faeces, while monitoring the efficacy for anthelmintic treatment to aid decision making (McKenna, 1977). The concentration of eggs recorded is influenced by faecal volume (Greer and Sykes, 2012) (Table 2.2), which is a consequence of the types, quantity and quality of forage consumed (Chaves et al., 2006; John and Ulyatt, 1987). The ability of a faecal egg count to reflect the worm burden of the host is also affected by variations in fecundity between parasite species. For H. contortus, estimates of the daily egg production per female worm are between 4000 and 10,000 eggs per day (Coyne et al., 1991; Gordon, 1967). By comparison,
T. colubriformis is less fecund, being 904 to 930 eggs per female per day, while T. circumcincta females produce 254 and 267 eggs per day (Mupeyo et al., 2011) and have also been implicated to have infra-population regulation mechanisms whereby fecundity per female decreases as the number of worms increases (Bishop and Stear, 2000) which may restrict the ability of FEC to reflect the number of females present in a host.
Table 2.2 Simulation of the impact of faecal output on the interpretation of faecal egg counts (FEC)
2.4.2 Pasture larval contamination
Pasture herbage sampling is used primarily for the recovery of third stage larvae on herbage and is expressed as number of L3 larvae per kilogram of pasture dry matter (L3/kg DM) (Familton and
McAnulty, 1997).When sampling, appropriate techniques must be taken to avoid error (Couvillion, 1993) as L3 larvae do not migrate far from the faecal pat (Stromberg, 1997) and the distance from
which samples are taken from the soil surface can affect the outcome of the results (Crofton, 1948). Further, areas that are immediately around the faecal mass should be avoided during sampling to avoid bias (Taylor, 1939). When faecal aggregation reaches a maximum on pasture there are high refusals of feed intake (Gruner and Sauve, 1982) and refusal of the contaminated area will continue for long periods (Crofton, 1958). Crofton (1954) reported that sampling for trichostrongyle parasites can affect the interpretation of results and controlling the variability is more difficult when sampling a whole pasture. They compared the sampling of a whole field to that of some areas in the same field and found larvae recovery of 364 kgDM for whole field compared with 91-182 kgDM in some areas. In addition, Donald (1976) demonstrated that the number of larvae present is dependent on the efficiency of the technique and the quantity of larvae recovered in the sediment. As such, inaccurate sampling of pasture will not give the correct level of infestation (Crofton, 1954) and L 3 larvae have spatial pattern
of aggregation (Flota-Banuelos et al., 2013) on pasture which influences the ability to predict larval challenge as sheep which do not grazed randomly (Crofton, 1954).
2.4.3 Herbage Cutting Vs Herbage Plucks
Sampling of pasture herbage when using either the cutting or plucking method can give contrasting results for the recovery of L3 larvae on herbage although some inconsistencies between studies does
exist. Verschave et al. (2015) found no significant difference of L3 larvae between cutting vs plucking,
with 325 ± 479 larvae for every 10 plucks and 305 ± 444 L3/Kg DM for random collection of herbage
within four 0.16m 2 plots. In addition, Martin et al. (1990) found 1890 and 1909 L
3/kg DM for 2
measurements totalling 20 cuts in the same area and 1687 and 1878 L3/kg DM when using
measurement of 4 plucks in an area. Conversely, Litherland, (2008) found 4021 L3 / kg DM for plucks
in contrast to 2715 L3 / kg DM for cuts. Further, Moss and Bray (2006) found 7170 L3/Kg DM and 495
L3/kg DM when cut 15mm above ground level for high-large density and low-small density pasture
respectively. In comparison, Rocha et al. (2014) found 5694 L3/kg DM for low cutting of 5 cm to the
ground and 913 L3 /kg DM for high cutting of 30 cm to the ground. Clearly, variation exists in the
2.4.4 The Baermann Apparatus
The Baermann apparatus is used mainly for the recovery of L3 larvae from herbage, soil and faeces to
estimate the number of nematodes present (Bairden et al., 1995; Taylor, 1939). The volume of sediment varies slightly when estimating the number of larvae. Young and Trajstman (1980) found 50% of L3 larvae recovered from sediment of 7.5 and 12.5 ml volume, Smeal and Hendy (2009) reported
85% recovery in 5ml sediment volume in contrast to 63.6 and 61.8% when the sediment volumes were between 10 and 15 ml, respectively. In large herbage sample of 500 g wet weight, 90% of L3 larvae
were recovered in sediment (Smeal and Hendy, 2009). Similarly, Donald (1967) found 90% of L3 larvae
recovered from 25 g of wet weight of small samples. This therefore demonstrate the method of herbage sampling, and the volume of the sediment will determine the numbers of larvae present during each extraction. For excessive amount of soil present, recovery can take up to 8-9 days (Taylor, 1939).
2.5 Control options for nematode parasites
Typically control of gastrointestinal nematodes relies on chemotherapy/prophylaxis through the use of broad-spectrum anthelmintic to which parasites are rapidly becoming resistant (Jackson etal., 2009; Kaplan and Vidyashankar, 2012; Leathwick et al., 2012; Taylor et al., 2009; Waller, 2006). Therefore, maintaining animal performance requires new novel and sustainable approaches (Kaplan, 2006; Kenyon et al., 2009; Leathwick et al., 1992; Waller, 2003). During periods of heavy contamination, animals must be removed from pasture (Brunsdon, 1980) and farmers should practice alternative grazing of different species such as sheep and cattle at short intervals to acquire worms that are less pathogenic (Bairden et al., 1995; Morley and Donald, 1980; Southcott and Barger, 1975). Despite knowledge of all these mechanisms, understanding nematode epidemiology and biology and the factors contributing to nematode development outside its host will aid in parasite control (Leathwick
2.5.0 Effective Microorganism E.M.
Effective microorganism (EM) consists of five types of microorganisms namely, photosynthetic bacteria, lactic acid bacteria, fermenting fungi, actinomycetes and yeast. The introduction of all these microorganisms in the environment resulted in the breakdown of organic matter and methanogens by anaerobic means (Freitag and Meihoefer, 2000; Lokare, 2007) resulting in a solution with a pH of less than 4. EM has been reputed to also maintain the equilibrium and diversity between beneficial and harmful microorganisms and contains a high bio Carbon and Nitrogen content of 2.24 and 1.48 mg /100g (Wei-jiong et al., 1996; Wood et al., 1997). Effective microorganism (EM) has been reported to reduce pickle worm by 91% (Higa and Wididana, 1991). In drinking water, it has been reported to increase lamb growth rate by 319 g per day, in comparison to control 286 g per day when applied at the ratio of 1:1000 and on pasture at 10 L per hectare (Chamberlain et al., 1997) also indicating it has a very low toxicity to sheep.
2.5.1 Effective Microorganism in waste water treatment facility
The use of EM in waste water sewage system is to reduce pathogen, toxins, biodegradable organic materials and heavy metals for environmental safety (Szymanski and Patterson, 2003). Studies on wastewater treatment facilities have shown EM treatment reduced biochemical oxygen demand (BOD) from 2.8 - 0.9, chemical oxygen demand (COD) from 164-109 mg / l and dissolved solid from 2160mg /l to 901 mg/l at pH 7.1 (Namsivayam et al., 2011). Similarly, Szymanski and Patterson (2003) reported a significant decrease in pH to 3.1 when the EM dose and the BOD was increased.
2.5.2 Effect of Effective Microorganism on egg hatching
Research data of EM on gastrointestinal nematodes is limited. However, previous investigations (Lewis, 2013) have shown that EM can significantly reduce GIN egg hatching by over 95%. These effects were maintained following autoclaving of the EM solution and the effect was consistent with the same effect observed in lactic acid standards at the same pH, which indicates this may be a pH effect rather than an action specific to EM and which appears to directly inhibit larval development inside the egg.
2.6 Nitrogen based Fertilizer
2.6.1 Effects of Nitrogen based Fertilizers on Ascaris suum in waste water treatment facility
Although specific examples of the toxicity of N based fertilisers on ruminant parasites is limiting, there are some examples from alternative species that support the notion that N-based fertilisers may have some toxic effects. Fidjeland et al. (2016) showed that ammonia sanitization can inactivate not only bacteria, viruses, protozoans but also helminth eggs. Treatment of toilet waste through the addition of 1-2% urea reduced the recovery of A. suum eggs from 1629 to 0 resulting in 100% inactivation after 30 days. Pecson et al. (2007) observed a significant decrease in the time for 99% inactivation (t99) of
egg is sensitive to ammonia and pH which work with temperature and the duration of time (Pecson and Nelson, 2005). Similarly, Reimers et al. (1986) presented ̴60% inactivation of Ascaris after 10 days in high pH sludge with ̴2000 mg/l NH3 added while Kato et al. (2001) reported an inactivation of >99%
in Ascaris egg after 48 h at 37 ⁰C and pH 13 in sludge amended with 2600 mg/l NH3. Of the few studies
that have investigated the effect of N fertilisers on nematode survival all four N based fertilisers, urea, ammonium nitrate, ammonium nitrate + urea and liquid nitrogen fertilizer were capable of inducing mortality in H. contortus L3 larvae, an effect which was dose dependent with the greatest increase in
the non-motile L3 occurring at 18 g , see (Figure 2.2) (Howell et al., 1999).
Figure 2.2 Percent non-motile H. contortus L3 larvae when exposed for 4 h to N (18g/100ml) and bleach
(10%) solutions. Bars represents least significant difference. Bleach vs. all other compounds; LNF (liquid N fertilizer) vs. all other N sources; Urea (U) vs. ammonium nitrate (AN); AN+ U mixture vs. AN and U (p< 0.7871); SE= 0.44.
Recent in vitro studies have shown liquid urea at a rate of greater than 6% in solution prevents greater than 95% of T. colubriformis eggs from hatching with almost complete inhibition of hatching at a concentration of 20% (Cairns et al., 2017). Further, when liquid urea was applied topically to fresh
faeces at a rate of 40 units’ N per ha, the number of L3 collected following bearmanisation was reduced
2.7 Summary
Methodology
3.1 Experimental site
The field study was carried out at the Lincoln Sheep Research Farm located in Lincoln, Canterbury, New
Zealand from February 9th, 2016 to April 22, 2016. Authorization for the trial was approved by the
Lincoln University Animal Ethics Committee, LUAEC#653. In December 2015, one 0.71 ha irrigated
paddock of newly sown ryegrass (Lolium perenne) and white clover (Trifolium repens) mix was
established for the start of the trial in February 2016. This area had been cropped in the previous year
and no animals grazed the area prior to the start of the study to ensure minimal background larval
contamination.
3.2 Experimental design
The field study was established as a randomised block design. At day 23 the field was split with
temporary electric fencing into eight areas consisting of two blocks measuring 60 m x 40 m that were
then each further split into four areas measuring 60 m x 10 m (Figure 3.1). Five-month-old Romney
lambs that were naturally infected with gastrointestinal parasites through grazing contaminated
pastures and which had not received anthelmintic treatment for a minimum of six weeks were then
allowed to rotationally graze the areas to seed the pasture with fresh parasite contamination.
Infection with gastro-intestinal nematodes was confirmed prior to the start of grazing using faecal egg
count. Lambs were mob stocked to graze each 60 m x 10 m area for sixteen days ie., two days per each
of the eight areas. Initially 30 lambs were used, this number was then increased to 45 after four days
to ensure low and consistent grazing residuals within each area. To assist with ensuring adequate
parasite populations on the pasture for measurement, an additional 6 kg of fresh faeces was collected
from ten-month-old Hampshire lambs that were housed and monospecifically infected with either
Trichostrongylus colubriformis or Teladorsagia, with a concentration of 800 eggs per g (epg) was evenly
spread onto each area post-grazing from day 12. Following the first eight days in block one, the area
was irrigated (K-line sprinkler) at the application rate of 20 mm for 12 hours to assist parasite larval
development and the procedure continued after the second eight days shift in block 2 at the same
application rate.
Immediately following each shift, i.e., every two days, the 60 m x 10 m grazed block was split again
into six 10 m x 10 m plots, demarked by lines mown to ground level with a rotary hand mower. Within
each block, plots were randomly allocated to one of three treatments, each replicated twice. The
treatments were: topical application of urea (Flowfert N, Ravensdown Ltd) at the equivalent of 200 L
or (40 units of N) per ha, topical application of EM mixture (Nature farm Ltd) at 200 L per ha or water
sprayed at 200 L per ha. Treatments were applied using a hand sprayer and were only applied after
The order of treatments remained the same within each block so that the adjacent plots in the grazing rotation received the same treatment. The order of treatments was then re-randomised for the second block of four grazing areas. After the first sixteen (16) days of complete rotation, the animals were removed from the trial area.
3.3 Grazing Study
The effect of treatment on lamb performance and parasitological parameters was evaluated in a grazing trial. At the completion of the initial seeding grazing rotation (day 17), 30 (5-month-old) Romney lambs were selected from the group of 45 and were weighed and treated with anthelmintic to remove resident parasite burdens (Trio sheep drench, Ravensdown Animal Health, Christchurch) which was confirmed with the faecal egg count. Following drenching, lambs were grazed in the remainder of the paddock unused in the initial rotation for the following 7 days in two shifts to ensure the effects of the anthelmintic treatment had worn off and were not likely to influence larval establishment.
At day zero, the second phase of the field trial began. Lambs were then re-weighed and allocated hierarchically by live weight to one of six groups (n=5) then each group was randomly allocated to graze each of the treatment plots. Animals were introduced into the first of their respective 10 m x 10 m plots, divided by temporary electric fencing on day 0, starting with the area that was grazed first during the seeding rotation. For block one, animals within the same treatment and replicate groups graze each area for two days before being moved to the adjacent area and the procedure continued until they had completed eight days grazing, or four movements, in block one. After the first four shifts, animals were moved to their respective treatments in the second block with the same protocol followed. Following the initial 16-day rotation, sampling of the animals continued as far as possible past the 21-day pre-patent period of most gastro-intestinal nematodes.
Animals were only removed from their plots for faecal sampling and weighing (detailed below) and were not allowed to graze any other treatment area. In rotation two, the four 10 m x 10 m plots were combined to form 40 m x 10 m starting from block one and the same procedure continued in block two. Lambs grazed each of the six plots that received the same treatment for one week within each block. Six lambs, one from each group, were removed on day 24 to reduce grazing pressure and placed into a clean parasite free paddock based on pasture larval sampling. On day 32 the remaining twenty-four lambs joined the other six due to insufficient pasture regrowth in the treatment plots. Faecal sampling continued for a further 17 days to extend beyond the pre-patent period of any contamination to be picked up from the treatment areas but remain within the pre-patent period of the adjacent paddock to minimize the chances of detecting any contamination post-shifting of the plots.
3.4 Measurements and sampling
3.4.1 Pasture Larvae
Herbage samples were collected for the determination of the concentration of nematode larvae on pasture taken immediately prior to each grazing. Initial measurements for each plot were recorded prior to seeding and again at 23 days after treatment was applied, giving eight replicates of treatment across time and two replicates at each time, sixteen replicates in total. To determine the total number of larvae present, grass cutting scissors was used to cut grass at ground level with samples taken every two steps in an X pattern in each of the respective plots at 9 am each morning. Herbage samples were placed into plastic bags at the time of collection and stored at 4◦C until processing. All samples were
processed within a week of collection.
During processing, the plastic bags with samples were weighed and 4 litres of lukewarm water was added. The plastic bag was then tied and put in a small hand washing machine with 200 revolutions per minute for 3 minutes. After washing a small incision was made in the bag through which the fluid was drained onto a coarse mesh sieve (aperture size 2 mm) into a beaker. The herbage that remained in the bag was removed and rinsed gently. The collected suspension was left to settle overnight at 4◦C
with the fluid siphoned off leaving sediment and larvae which were transferred to a measuring cylinder for a second sedimentation. After 36 hours, 100 ml of fluid was withdrawn and stored in glass bottles. After storage at 4◦C the sample was reduced in volume to 20 ml by siphoning and the larvae present in
two x 1 ml sample were counted and their species differentiated. For the herbage samples, after squeezing, it was spread on a tray then dried in an oven at 70◦C. The dry herbage was weighed, and
the fresh grass weight was used in the final estimation of numbers of larvae per kilogram of fresh herbage was calculated. The method of bearmann apparatus measurements of larvae per herbage were calculated as (Number of larvae /kg fresh herbage = Number of larvae counted x (ml sediment / ml sed-ml subsample) x (1000/grass wt). The total larvae per plot was calculated using the dry matter percentage x the post grazing pasture mass x the grazing area and the number of larvae per count. The cumulative larval challenge was determined by the pre grazing herbage mass x L3/kgDM.
3.4.2 Animal measurement
following removal from pasture at 9 am with fasted live weights following 8 h fasting recorded on day 48.
3.4.3 Faecal egg count
For faecal egg count, faecal samples were taken directly from the rectum of each lamb and were stored at 4◦C until processing which occurred within 24 hrs. The method of analysis was the Modified
McMaster technique (M.A.F.F, 1977). Briefly, a total of 1.7 g of faeces from each sample was weighed and placed into a jar containing 10 ml of water and left to soak overnight at 4◦C to soften. The following
day, 40 ml of saturated sodium chloride (NaCL) solution was added and the sample homogenised for 25 seconds with an electrical stirrer. A Pasteur pipette was used to fill both chambers of a moistened McMaster slide with the faecal suspension. The number of eggs present in both chambers of the slide were counted under a microscope, totalled and multiplied by 100 to give the number of eggs per gram (epg) of fresh faeces with a sensitivity of one hundred eggs per gram. Total estimated daily faecal egg output was determined by the percentage organic matter digestibility OMD x number of animals per proup dry matter intake DMI prior to faecal sampling /0.15*1000*FEC/100(epg).
3.4.4 Pasture Measurements
Herbage mass was measured pre-and post-grazing with a rising plate meter to determine the herbage mass (kgDM) in each area. Measurements were taken every two (2) steps in an X pattern within each plot. The rising plate meter was calibrated to the pasture sward using 10 quadrat cuts taken at various pasture heights. Briefly, 10 recording of herbage mass within each quadrat were recorded with the
plate meter with the mean number of ‘clicks’ recorded. Herbage was cut to ground level using grass cutting scissors, the samples then weighed after being placed in an oven at 60◦C for 24 hours. Dry
weight of the herbage from each quadrat was recorded, converted to kgDM per ha and regressed against the mean number of clicks to obtain an equation for the number of clicks to describe the kgDM per ha with the equation: herbage mass (kgDM per ha) = 37.223 x # clicks + 27.689 where x = mean number of clicks from the rising plate meter. The cumulative larval challenge was calculated from the concentration of larvae on herbage (larvae per kgDM) x the amount of herbage in each plot. The plot size was 10 m x 10 m or (100 m 2) and 40 m x 10 m or (400 m 2). The rising plate meter gives the amount
of dry matter per ha.
3.4.5 Metabolisable Energy Analysis (ME)
(MJME/KgDM) = DOMD x 0.16 for each treatment. The method of analysis was adopted from (Alderman et al., 1993).
3.5 In vitro larval culture
The effect of treatments under controlled conditions was deterimed using in vitro larval culture. Sheep faeces was collected from 10 month old Hampshire lamb using an improvised harness fitted over the peri-anal area of the sheep. Faeces were less than 24 h old when applied to the pasture on day 12 where a 600 g subsample was divided into six 100 g samples and evenly spread across six separate plastic trays. Each tray was placed onto the ground on one plot prior to the treatment application and subjected to the same application as the reminaing ground surface in the plot. The trays were left overnight on each of the treatment plots before being taken to the laboratory. In the laboratory each tray was covered with a plastic bag with small holes punched in it for areation and was then placed in a climate room at 25◦C for 10 days to allow larvae to develop.
At day 10 of culture, the faeces from each tray was placed into individual paper towel with an elastic band to provide support from spillage. Individual treatments were then placed into a glass bearmann funnel with 2 L of luke warm water for a period of 48 hours to allow larvae to migrate through the tissue and collect at the bar of the funnel. After bermanisation 100 ml fluid was drawn from the base of the funnel into a glass bottle and left to settle overnight. From the 100 ml fluid, 50 ml was siphoned off and an additional 50 ml was added from the bearman funnels to equivalent 100 ml fluid. This was then refrigerated for four hours at 4◦C. The refrigerated suspension from the glass bottle was reduced
to volume of 20 ml by siphoning. Larvae present in five 200 microliter (1 ml total) samples were counted and multiplied by the volume to give the total number of larvae collected.
3.6 Second in vitro larvae culture ‘with and without plastic bag method’
Faeces were collected from additional male sheep that were housed indoors and with a FEC averaging 800 eggs per gram (epg) faeces. A total of 200 g and 160 g of faeces were taken one week apart. The
method of ‘with plastic bags’ and ‘without plastic bags’ was used to determine which method work best in the control environment. Infected sheep faeces was homogenized then divided into four equal quarters of 50 and 40 g. Faeces were placed in plastic trays with treatment liquid urea solution and
water, the ‘with plastic bags’ and ‘without plastic bags’ method was applied for each treatment and
replicate. A total of 1.7 g urea fertilizer was dissolved into 4 ml of hot water, which was then divided into 2 ml for each treatment and replicate. For the water treatment 4 ml of water was divided into 2 ml for each treatment and replicate. Faeces were sprayed topically with liquid urea solution and water and was replicated twice with each treatment receiving the same 2 ml before cultured at 25◦C for 10
For the ‘with plastic bags’ method, plastic bag with small holes for aeration were used to cover the plastic containers, while for the‘without plastic bags’ method, no covering were placed on the plastic containers in the control room and was subjected to the same climatic condition as the plastic bag method.
3.7 Statistical analysis
Chapter 4 Results for field study
4.1 Field Trial
4.1.1 Pasture Mass
Pasture herbage mass pre-and post-grazing for each rotation are given in Figures 4.1-4.3. Overall, there was no effect of treatment or time (P>0.05 for all). Pasture quality was not different between treatments (P>0.05 for all), with total organic matter digestibility (OMD) being 87% for all, the MJME/kgDM being 12.3,12.4 and 12.4 and crude protein being 32.0, 31.6 and 31.2 for water (H2O),
20% liquid urea solution and Effective microorganism (EM), respectively.
Mean pre-grazing and post- grazing herbage mass for water (H2O), treatment is presented in (Figure
4.1). Pre-grazing pasture herbage mass in rotation 1 was 4164 ± 614 KgDM which then declined to 2073 ± 62 KgDM in rotation 2 with respective post grazing herbage mass being 870 ± 145 and 516 ± 2 KgDM / ha.
Figure 4.1. Mean Pre-and Post-Grazing Herbage mass (kgDM available) for plots treated with water
(H2O), 16 and 23 days post treatment. Plots areas were 100m2 during first grazing rotation and 400m2
during second grazing rotation.
0 1,000 2,000 3,000 4,000 5,000
H2O 1st Rotation H2O 2nd Rotation
To
ta
l k
gDM
av
aila
b
le
(p
re
an
d
p
o
st
graz
in
g)
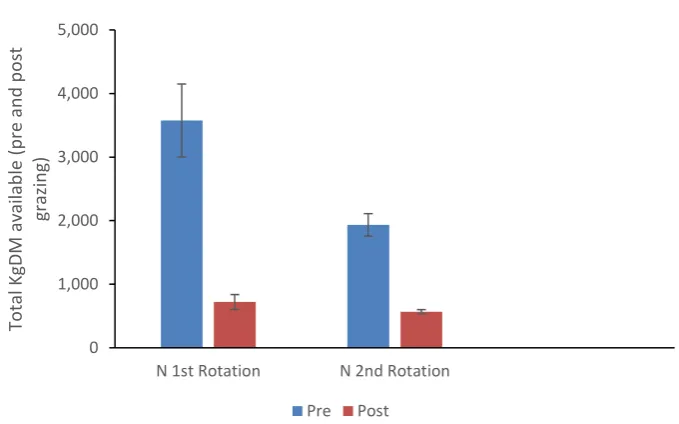
Mean pre-grazing and post grazing herbage mass for 20% liquid urea solution (N) treatment is presented in Figure 4.2. Pre-grazing pasture herbage mass in rotation 1 was 3575 ± 575 kgDM which then declined to 1934 ± 176 kgDM in rotation 2 with respective post grazing herbage mass of 720 ± 117 and 533 ± 33 kgDM per ha.
Figure 4.2. Mean Pre-and Post-Grazing Herbage mass (KgDM per ha) for plots treated with 20% liquid
urea solution (N) for 16 and 23 days post treatment. Plots size were 100m2 during first grazing
rotation and 400m2 during second.
0 1,000 2,000 3,000 4,000 5,000
N 1st Rotation N 2nd Rotation
To
ta
l KgDM
av
aila
b
le
(p
re
a
n
d
p
o
st
graz
in
g)
Mean pre-grazing and post grazing herbage mass for EM is presented in Figure 4.3. Pre-grazing pasture herbage mass in rotation 1 was 4188 ± 792 kgDM and 2235 ± 366 kgDM in rotation 2 with respective post-grazing herbage mass of 788 ± 123 and 537 ± 35 kgDM per ha.
Figure 4.3. Mean Pre-and Post-Grazing Herbage mass (KgDM per ha) for plots treated with EM for
16 and 23 days post treatment. Plots size were 100m2 during first grazing rotation and 400m2 during
second.
4.1.2 Pasture Larvae Contamination
The number of both Nematodirus and Strongyle (L3 per kgDM) larvae present at the start of each
grazing are given in Figures 4.4 and 4.5, respectively. High pasture larval numbers were observed on two occasions, being one EM replicate on day 10 and one N replicate on day 17, viz, 116,393 and 49,296 L3 larvae per kgDM, for Strongyle and Nematodirus, respectively. These were considered outliers and
were removed from the preliminary analysis as they were only shown in one replicate. Data with and without days 10 and 17 included is also presented.
0 1,000 2,000 3,000 4,000 5,000
EM 1st Rotation EM2nd Rotation
To
ta
l k
gDM
av
aila
b
le
(p
re
a
n
d
p
o
st
graz
in
g)
4.1.2.1 Strongyle L
3per KgDM
The total number of Strongyle L3 larvae present on pasture is presented in Figure 4.4. Overall, pasture
L3Strongyle larvae contamination was not influenced by treatment (P=0.05), nor was there a treatment
x time interaction (P=0.05).For the water (H2O) in rotation 1, 1266 L3 per kgDM were found, which
then decline to 136 L3 in rotation 2 and increased to 559 L3 per kgDM in rotation 3. For EM treatment,
pasture Strongyle L3 larvae were 2295 L3 per kgDM in rotation 1, then decline to 695 L3 per kgDM in
rotation 2 and increased to 3838 L3 per kgDM in rotation 3. For the 20% liquid urea solution (N)
treatment, 1087 Strongyle L3 per kgDM were present in rotation 1 with no larvae found thereafter in
rotations 2-3.
Figure 4.4. Number of Strongyle L3 per KgDM recovered from plots that were treated with either
water (H2O), 20% liquid urea solution (N) or effective micro-organism mixture (EM) 16 days, 23 and
32 days post treatment.
0 2,000 4,000 6,000 8,000
16 days post treatment 23 days post treatment 32 days post-treatment
N
u
mb
e
r o
f
Str
o
n
g
yl
e
L3
p
e
r
Kg
D
M