Validation of non-linear dynamic simulations through full
field optical methods
G. Lampeas1,a and Th.Siebert2 1
University of Patras, Department of Mechanical Engineering and Aeronautics, 26500 Rion, Patras, Greece
2
Dantec Dynamics GmbH , Kaessbohrer Str. 18 , D 89077 Ulm, Germany
Abstract.Innovative designs of transport vehicles need to be validated in order to demonstrate reliability and provide confidence. The most common design approach of such structures involve simulations based on Finite Element (FE) analysis, which require reliable validation techniques, especially if anisotropic materials, such as fibre reinforced polymers, or complex designs, such as sandwich panels are to be considered. The present paper aims to integrate sophisticated numerical analysis with full-field optical measurement system data in order to improve the quality of both methods and increase reliability of the design.
1 Introduction
During the design – analysis of products, it is the normal practice to assess the accuracy of numerical results by comparing the numerically predicted values to corresponding experimental data. However, current practice tends to focus on identifying hot-spots in the data and checking that the experimental and modeling results agree in these critical zones, while often the comparison is restricted to a single point where the maximum stress occurs. This highly localized approach neglects the majority of the data generated by full-field optical techniques and carries with it the risk that critical regions may be missed all together.To overcome this drawback, the use of whole field optical techniques, e.g. [1, 2], provides a number of significant advances which are emerging from the innovation process. In optical deformation measurement, these advances include digital image correlation and fringe projection techniques. Deformation, strain, or vibration modes due to defined loads are often measured by digital image correlation methods (DIC), e.g.[3] or fringe techniques, such as moiré, holographic and digital speckle pattern interferometry (DSPI) or shearography, e.g. [4]. The strength of full-field optical techniques is that the whole displacement field can be visualized and analyzed. By using High Speed cameras, the DIC method can easily be applied to high dynamic events and delivers quantitative information on three-dimensional (3D) displacement.
a
e-mail : [email protected]
© Owned by the authors, published by EDP Sciences, 2010 DOI:10.1051/epjconf/20100646007
There is a need for validation of simulations in the high energy, dynamic regime of impact loading or crash, when composite materials are involved. In this frame, the objective of the present paper is to integrate full-field optical measurement methodologies to state-of-the-art computational simulation techniques for non-linear transient dynamic events, in order to improve both methods. Whilst the impact of homogeneous panels is a relatively straightforward task, the simulation of impact and subsequent development of damage in a composite panel is probably at the leading edge of current knowledge.
For the needs of the present work, sandwich panels have been selected, as they are widely used in energy absorbing applications involving low or high-velocity impact conditions. The investigated sandwich panels comprise two types of core (truss and honeycomb) and two types of skin (aluminum and carbon/epoxy, respectively) as presented in Figure 1. The truss core sandwich panels consist of ‘Wadley’-type metallic open cell core placed between two aluminum skins and have dimensions of 150x150x50 mm3. The ‘Wadley’-type core is fabricated by ATECA-France [5] in the frame of EC funded project CELPACT (Cellular Structures for Impact Performance), using 304L stainless-steel sheets (density of 8000 kg/m3 and elasticity modulus of 193 GPa); the production process involves the punching and folding technique for fabrication of layers, which are then stacked and brazed to form the cellular core. The representative unit-cell for this core type is an irregular Body Centered Cubic (BCC) of dimensions 8,7x6,55x10.7 mm3 in x, y and z directions, respectively. The strut rectangular cross-section has width of 1,6 mm and thickness 0,55mm. The thickness of skin is 2mm. The dimensions of honeycomb core sandwich panels, provided by HPS company [5], are 150x150x40 mm3. The honeycomb core material is Al T5056 of density 2640 Kgr/m3 and elasticity modulus of 70 GPa. The cell shape is regular hexagon with 0.0254 mm thickness and 4,7625 mm cell's size. The skins covering the cellular core are produced of carbon/epoxy [0/90]4 fabric composite material. The thickness of skin is 2 mm.
Aiming to assess the panel energy absorbing capability, the panels have been tested in hard-body low velocity, low energy, mass-drop impact loading, in the drop-tower shown in Figure 1, with impact velocities ranging from 4.86 m/s to 7,4 m/s and impact energies ranging from 148,26.J to 493,39.J. The boundary conditions comprise the panel sustain on four spherical supports of 20 mm diameter.
In parallel, simulation models of the sandwich panels have been developed, as presented in detail in the next section 2. In addition, the sandwich panels were properly instrumented during the tests by Dantec Dynamics full-field optical measurement systems [6], such that the transient history of deformation and strain fields were recorded, to achieve the maximum amount of quantitative data for understanding the panel behaviour, as well as to enable the applicability of test results in the validation of respective impact simulation models. The High Speed Image Correlation system was used to deliver full field optical measurement data, which were used to correlate experimentally recorded and numerically calculated strain histories at the top skin of the sandwich structure.
The experimental validation of simulations of the dynamic event using full-field optical methods of deformation are based on quantitative correlation of calculated and measured dimensional features and their changes occurring as a consequence of high energy dynamic events.
2 Development of FE models
2.1 FE mesh and boundary conditions
Finite Element simulations of the low-velocity impact tests of truss type sandwich panels have been performed using the explicit dynamic FE code PAM-Crash. The spherical supports are modeled as infinite mass rigid walls, while the impactor is modeled as a rigid body with one degree of freedom in the direction of impact. The skin is modeled using quad-shell elements. The core structure is modeled by both beam and shell elements.
For all impact simulations, quarter symmetric models of the test specimens were developed and proper symmetry boundary and loading conditions were applied, in order to reduce the calculation cost, which is especially high for sandwich structures. The FE model, as well as the boundary and loading conditions applied, are schematically presented in Figure 2, while more details can be found in [8].
The FE mesh of the impactor is presented in Figure 3. It consists of a narrow part (radius12,7mm and length 42mm) that corresponds to the impactor tup and a wider part (radius of 15,9mm, modeled length 20mm) that corresponds to the tup extender. Due to the described impactor geometry and the high panel thickness (50mm), if the impactor energy is not completely absorbed by the upper skin and the core deformation, a second impact occurs. The second impact takes place when the wider part of the impactor reaches the upper skin and causes its further deformation (as shown in Figure 5a).
Fig. 3. Geometry and FE model of the impactor
Fig. 2. Quarter sandwich panel FE model: a) impactor and support system of the quarter model b) symmetry boundary conditions
15,9mm
12,7mm
42 mm 20 mm
b
Impact area
x-symmetry BC y x
z
y-symmetry BC
L / 2
L / 2
2.2 Material models
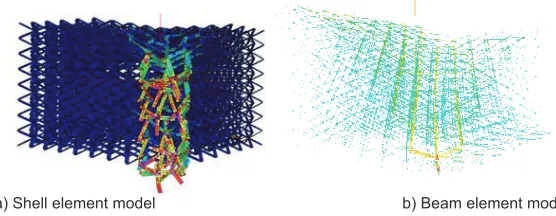
The skin is modeled with elastic-plastic shell elements, which are assigned material data of aluminum alloy 2024. For the metallic core two modeling approaches are applied, both involving a bi-linear elastic-plastic material model for the stainless-steel 304L core material, i.e. a shell element model and a beam element model.
a) Shell element model b) Beam element model
Fig. 4.Damage as calculated from the two different truss-type core models: a) Shell element model; b) Beam element model
In the shell element model twenty quad-shell elements per strut were used for the truss-type core. The shell element model can represent more accurately the geometry of the region where struts are joined together, providing a stiffer connection. In the beam element model ten higher order beam elements are applied for each strut. When the struts are modeled with beam elements, the complex surface of the strut junction is degraded to a single point; as the real connection is not perfect, the more flexible beam element model gives a better simulation of core response under impact loading.
The calculated behaviour of both core models under the same impact conditions is presented in Figure 5a (shell element model) and 5b (beam element model). The observed experimental behaviour of the truss-type core is better approximated with the beam element core model.
2.3 Material interfaces and contact definitions
Two sets of contact definitions were applied, i.e. the self-impacting type for core and skins and node-to-surface type for the contact of the impactor to the skin-core system. The core and the skin in this truss sandwich structure are bonded by brazing technique. The brazed bonds fail at low loading and the skin de-bonds from the core during impact. The addition of a tie-break interface is necessary in order to model the failure of brazed bonds between the core and the skins. The rupture model associated to this interface type requires special attention. For the purpose in the present simulations and due to lack of experimental interfacial strength values, the rupture model parameters were roughly estimated by performing a parametric study. For successful modeling of this type of structure, it is of crucial importance to experimentally determine the type and the parameters of the brazed bonds rupture.
2.4 Impact simulation results
Fig. 5.a) Impactor penetration and core deformation (left side); b) Plastic deformation of upper skin (right side)
Fig. 6. Experimental and calculated load-deflection diagrams for the 493,39J impact on truss-type structure
The experimental and calculated load-deflection curves are compared in Figure 6. It can be observed that the upper skin failure, which corresponds to the first peak in the diagram in the Figure 6 followed by a sudden load drop, is well predicted with the adopted material model for the aluminium skin. The process of simultaneous core de-bonding from the upper skin and its compaction under the impactor loading is also well predicted, as can be observed in the same diagram in the region between two load peaks. The calculated final peak loading and the final depth at which the impactor gets trapped in the core are slightly larger than the measured ones, but still within satisfactory accuracy. A comparison of the numerically calculated strains to those experimentally measured by the optical system is performed in the following section 3.
3 Optical measurement data and comparison to model results
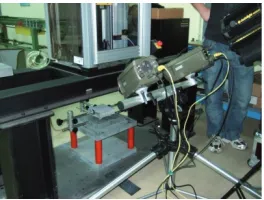
increased to 5000 fps. In Figure 7, the setup including the highspeed cameras and illumination in front of the test machine is shown.
Fig. 7. Experimental setup of the High Speed Digital Image Correlation System Q-450 for the measurement of the impact on a sandwich honeycomb panel
The position and projection parameter of the cameras are determined using a calibration process [7]. With this information and the knowledge of the position of an object point in the images of both cameras the position of this object point in 3D space can be calculated. Using multiple points, a full field information is obtained. From a series of images the displacement and strain of the object surface can be derived. In Figure 8, the full field deformation 1 msec after the contact of the impactor on the honeycomb specimen is presented. In the same figure, the out-of plane displacement of a point near the impact is plotted as a function of time.
In Figure 9, the full field strain around the contact point of the impactor 1 msec after the contact is shown. A polygon and a line are marked for further analysis of the results. The strain over time shows the appearance of cracks and relaxation. After about 4 msec, the impactor penetrated through the surface and does not affect significantly the surface deformation any more.
-3 -2 -1 0
-2 0 2 4 6 8
Time / msec
Di
spl
acem
ent / mm
z Displacement
Fig. 8.Honeycomb panel: a) displacement in the field of view as seen from one camera 1 msec after the contact of the impactor (left side); displacement over time of the marked point (right side)
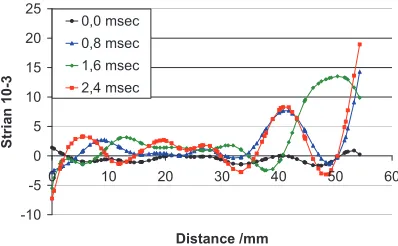
In Figure 10, the strain along a line from the corner to the position of the impactor is presented; it can be observed from Figure 10, that waves of strain from the impact position to the edges are appearing. Similar results have been derived for the truss-type sandwich panel. In Figure 11, the full field displacement of the truss-type metallic core sandwich panel is presented. Additionally, the out-of plane displacement out-of the point near the impacted area (indicated with a circle in the figure) is plotted a function of time. In Figure 12, the full field strain around the contact point of the impactor by the end of impact is shown. A polygon and a line are marked for further analysis of the results.
-4 0 4 8 12
-2 0 2 4 6 8
Time / msec
Str
a
in 10
-3
Tangential Strain y / Mean over surface
Fig. 9.Honeycomb panel: a) Full field strain distribution 1 msec after contact of the impactor (left side) and b) average strain inside the polygon area over time (right side)
-10 -5 0 5 10 15 20 25
0 10 20 30 40 50 60
Distance /mm
S
tr
ian 10
-3
0,0 msec 0,8 msec 1,6 msec 2,4 msec
Fig. 10.Strain along a line from the corner to the center at different times.
Fig. 11.Truss-type sandwich panel: a) displacement of the field of view as seen from one camera at the end of impact (left side) and b) out-of-plane displacement over time of the marked point (right side).
3 Conclusions
Fig. 12.Truss-type sandwich panel: a) Full field strain distribution after contact between impactor and upper skin (left side) and b) average strain inside the polygon over time (right side)
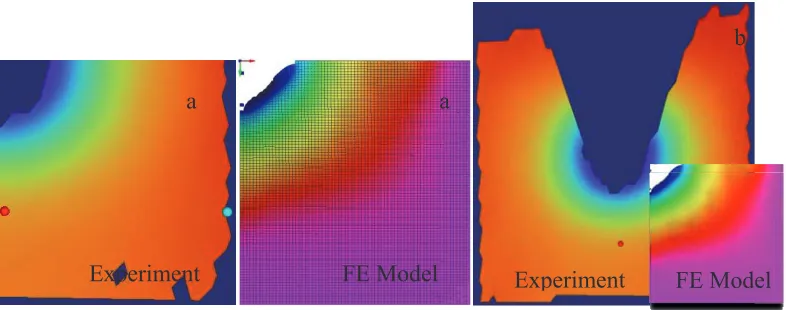
Fig. 13.Comparison between displacement fields obtained by the optical system and FE model of structure with Wadley’-type metallic open cell core
Acknowledgement
This work has received funding from the European Community's Seventh Framework Programme under Grant Agreement no. SCP7-GA-2008-218595 (ADVISE project).
References
1. P. Rastogi, D. Inaudi (Eds.), Trends in optical non-destructive testing and inspection, Elsevier, Amsterdam, 2000
2. Shchepinov,V.P., Pisarev,V.S., Novikov,S.A., et al., Strain and Stress Analysis by Holographic and Speckle Interferometry, John Wiley, Chichester, 1996
3. Th. Siebert, R. Wood, K. Splitthof, “High Speed Image Correlation for Vibration Analysis”, 7th International Conference on Modern Practice in Stress and Vibration Analysis, Cambridge 2009 4. R. Kästle, E. Hack, and U. Sennhauser, "Shearography for determination of 2D strain
distributions", Proc. SPIE 3824, 38-44, 1999 5. www.hps-gmbh.com, www.ateca-fr.com
6. http://www.dantecdynamics.com/Default.aspx?ID=1521
7. Th. Siebert, Th. Becker, K. Splitthof, I. Neumann, R. Krupka, “High-speed digital image correlation: error estimations and applications”, Opt. Eng. 46(5), 051004 (2007)
8. CELPACT (Cellular Structures for Impact Performance), Deliverable D.4.2.1