DOI: http://dx.doi.org/10.26483/ijarcs.v9i2.5806
Volume 9, No. 2, March-April 2018
International Journal of Advanced Research in Computer Science RESEARCH PAPER
Available Online at www.ijarcs.info
ISSN No. 0976-5697
AN EFFECTIVE FRAMEWORK FOR DATA CLUSTERING USING IMPROVED
K-MEANS APPROACH
Sakshi Siva Ramakrishna
Research Scholar,
Department of Computer Science & Engineering Acharya Nagarjuna University,
Guntur, AP, India
Dr. T Anuradha
Professor& HeadDepartment of Computer Science & Electronics JKC College,
Guntur, AP, India
Abstract: Data clustering refers to the partition of a dataset into homogeneous subsets where each subset is dissimilar to the rest of the subsets. K-means is a familiar approach for data clustering particularly when all the attributes of the data objects are of numeric type. Though the k-means approach is popular and efficient it is susceptible to misclassify the data due to the noise and outliers that are common in datasets. The aim of this paper is to study the strategies available to overcome the problems like high dimensionality, redundancy, noise and outliers while implementing the k-means algorithm and to propose a better approach to deal with the problem. An iterative attribute reduction procedure based on correlations among attributes was proposed to cluster the given dataset using k-means algorithm in an improved manner. The standard dataset “Iris” was used to test the proposed methodology. The obtained results are reasonably better.
Keywords: clustering, Dimensionality reduction, Modified k-means, outliers, redundancy, Iris
I. INTRODUCTION
Clustering is one of the standard procedures in multivariate data analysis. It is a tool to explore data to know the inherent natural structure of the data elements. The clusters form the equivalence classes provide ways for generalizing over the data objects and their features. Clustering can be applied in many domains, such as business, bioinformatics, and economics medical research, psychology and pattern recognition.
Clustering is an unsupervised learning, in which the class labels of the data are not known and clustering tries to generate such labels. The data objects are clustered based on the principle of maximizing the intra cluster homogeneity and inter cluster heterogeneity. The k-means algorithm takes the dataset of n objects, input parameter k and partitions the set of n objects into k clusters. The algorithm first randomly selects k objects as clusters’ means and assign the remaining n-k objects to k clusters to which it is most similar. The same process iterates by updating the cluster means by the average value of all the points in the cluster until the square error criterion holds good. Pre specification of k by the user is a disadvantage of this algorithm. The k-means is not suitable for discovering clusters of very different size and of non convex shapes. The algorithm is susceptible to noise and outliers. One more limitation is that the algorithm is not suitable for the datasets having non-numerical attributes. Different efforts have been made with various methods to improve the efficiency and speed of K-means algorithm. K-K-means uses the dissimilarity measure of Euclidean distance to calculate the distance between the objects of the dataset. This method is less effective when new data sets are added and have no effect on the measured distance between various data objects. The computational complexity of k means algorithm is O(n2
This paper was tried to list the strategies to cope with the problems mentioned above through the literature survey to have a better insight of the problem and the solution strategies as well. In the next section the literature survey is presented that summarizes the efforts made towards improving k-means algorithm. The following sections presented about the proposed methodology to improve the algorithm, designed procedure, adopted dataset, results and discussion.
).Data preprocessing is one of the technique to deal with the problem of noisy and outlier data where the remedial techniques are applied to the datasets to make them more clean, consistent and noise free.
II. LITERATURE SURVEY
Wherever Times is specified, Times Roman or Times New Roman may be used. If neither is available on your word processor, please use the font closest in appearance to Times. Avoid using bit-mapped fonts if possible. True-Type 1 or Open Type fonts are preferred. Please embed symbol fonts, as well, for math, etc.
normalization to improve the quality of clusters. In normalization the data to be analyzed is scaled to a specific range. A modified k means algorithm is proposed that provides a solution for automatic initialization of centroids and enhances the effectiveness with normalized data. This method tried to smooth several drawbacks of the classical k means algorithm. The second category is about the initial cluster centre decision. Accordingly there are several approaches have been proposed for selecting initial cluster centers which are based on methods like density based, random partitioning, graph based and so on. In [4] authors used weighted approach to initialize the centroids. In [7] tried to remove the limitation of pre specification of k value. In [3] proposed a method in which initially the value of k is 2, and increase as the initial two clusters splits further for better clustering. The third category of efforts consists of sampling techniques in which a good number of samples are collected from the dataset and clustering is done on samples. One of the sample results with optimum mean square error is the candidate for final result. In [1] authors proposed a hierarchical optimization principle initialized by k* seeds (k* < k) to reduce the risk of random seeds selection. Further they proposed the use of ‘‘top-n nearest clusters merging ‘to merge the nearest clusters in each round until the number of clusters reaches at k. They also proposed cluster pruning strategy for getting efficient and robust clustering. In [6] authors proposed an improved k-means clustering algorithm based on dissimilarity metric. In this approach the initial centriods were selected using the Huffman tree which uses dissimilarity matrix to construct. Authors concluded that the proposed algorithm is an efficient algorithm with better clustering accuracy.
III. THE FOUNDATION
Dimensionality reduction is a good way of data reduction which reduces the data size but give the same quality of knowledge as with the original data set. There are numerous techniques to consider for data reduction. The techniques include:
A. Missing Values Ratio:
Incomplete data columns with too many missing values are the bottleneck to carry much useful information. Therefore this type of data columns with number of missing values are recommended to leave out based on a given threshold value of incompleteness. This type of incomplete columns can be removed. The higher the value of the threshold is, the wider the chance for aggressive reduction.
B. Filtering Low Variance data:
This technique is similar to the previous technique. In this technique data columns with little changes in the data are the candidates for reduction as they carry a little information. The data columns with variance lower than a given threshold value can be removed.
C. High Correlation Filter:
The dataset may have data columns with very similar trends. These columns are likely to carry very similar information. In this case, it is sufficient to retain one of the similar columns for data processing. The statistics like correlation coefficient, chi-square test for categorical data Here we calculate the correlation coefficient between numerical columns and between nominal columns (Pearson’s Product
Moment Coefficient and the Pearson's chi square value respectively). Groups of columns with higher correlation coefficient based on a threshold are supposed to be reduced to only one. Here also it is recommended to normalize the given dataset before applying this technique.
D. Ensemble learning tree:
Decision Tree Ensembles are useful for feature selection. These are also referred to as random forests, which are effective classifiers. In this approach to dimensionality reduction we have to generate a large and carefully constructed set of trees against a target attribute .Here calculations of each attribute’s usage statistics are done to find the most informative subset of features. The calculations reveal the most predictive attributes.
E. Principal Component Analysis (PCA):
Principal Component Analysis (PCA) is a statistical procedure that maps the original n coordinates of a data set orthogonally to a new set of n coordinates called principal components. Data need to be normalized before applying this technique. Based on the results of PCA the reduction took place.
IV. PROPOSED METHODOLOGY
Keeping the above facts in concern the present work aimed to follow k-means algorithm with stepwise reduction of columns whose elimination is justifiable based on the correlations among the attributes.
A. Selection of reduced number of attributes for k-means clustering optimisation
Define The main concentration of this paper is to present the results of the k-means clustering on data sets with varying number of attributes. To eliminate a column in the dataset as a part of reduced set of attributes, correlation among the attributes are calculated. The correlation coefficient r ranged int0 [-1, 1] where -1 represent perfect negative correlation between the attributes and 1 denote a perfect positive correlation. The correlation coefficient 0 indicates the independence of the two attributes. The other values of the coefficient are the signs of the various levels of the associations between the attributes. If two attributes give the correlation coefficient near to 1 then one of the attributes can be eliminated from the dataset.
B. The proposed optimisation process Optimized K-means (D, threshold, k)
Input: The dataset D for clustering Output: Cluster information
Step 1: Obtain the correlation coefficient matrix for the whole dataset D.
Step 2: while there are no columns to eliminate
Step 3: collect the pairs with high correlation coefficient (based on a chosen threshold) values from the dataset based on the correlation coefficient matrix.
Step 4: eliminate one of the columns from the pairs from each of the pairs so that the dataset D is properly reduced.
Step 5: perform K-means (D, k)
Step 5: If the optimization criterion for clustering is met Go to step 6.
Step 5: End while.
V. EXPERIMENTAL SETUP AND RESULTS
The implementation was done using R environment, and all experiments are performed on platform equipped with 2.4 GHz Intel Core i3 CPU, 4 GB memory, and Windows 7 operating system.
A. The Dataset
The dataset was obtained from the UCI machine learning repository. This is a multivariate data with four attributes and 150 records. This is dataset conceivably the best known database to be found in the pattern recognition and machine learning literature. Fisher's paper is a classic in these fields and is referenced frequently to this day. Here one class is linearly separable from the other two classes. The remaining two classes are NOT linearly separable from each other.
Based on Fisher's linear discriminate model, this data set became a typical benchmark test case in machine learning for many statistical classification techniques such as support vector machines. The use of this data set in cluster analysis however is uncommon, because the data set inherently has only two clusters with rather obvious separation. One of the clusters contains the category of flowers Iris_ setosa, while the other cluster have both Iris_ virginica and Iris_versicolor and this cluster is not separable without the information about species. This data set a good example to evaluate a supervised learning method, and to find the difference between the
supervised verses unsupervised techniques in data mining:
Fisher's linear discriminant model can only be obtained when the object species are known. The class labels and the clusters are not necessarily the same. The proposed algorithm was applied on the Iris dataset. The following are the results obtained during the process.
B. Results
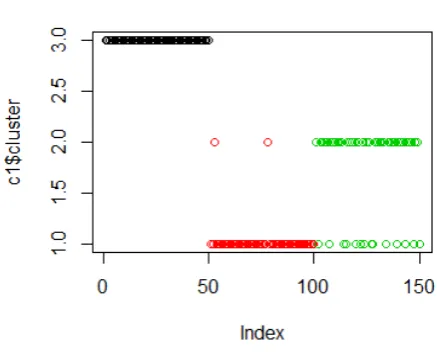
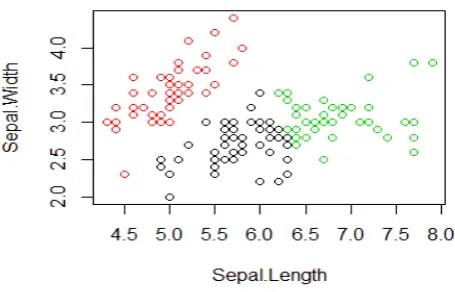
Initially the original k-means algorithm was applied on the Iris data set as it is. The obtained cluster information was presented in Tables 1 and 2 and in Figures 1and 2.
K-means clustering with 3 clusters of sizes 38, 62, and 50 is given.
Table1. Cluster means for original k_means clustering of Iris dataset
Sno. Sepal.Length Sepal. Wid th
Petal. Length Petal. Width
1 6.850000 3.073684
5.742105 2.071053
2 5.901613 2.748387
4.393548 1.433871
3 5.006000 3.428000
1.462000 0.246000
The above table gives the cluster means information. Correlati on between the last two columns is 0.999 which is almost a per fect correlation.
Table2. Cluster distribution for original k-means clustering of Iris dataset
Sno. setosa versicolor virginica
1 50 0 0
2 0 48 14
3 0 2 36
[image:3.595.314.533.96.272.2]
Figure 1.
Figure 2.
Cluster distribution for original k-means clustering of Iris dataset.
Cluster distribution for original k-means clustering of Iris dataset (Sepal. Length Vs Sepal. Width).
From the above clustering result it can be observed that the formed clusters are overlapping one on another showing a low optimal result. To continue the proposed process the inter correlation matrix was obtained and presented in Table 3.
Table3. Inter correlation matrix
Sepal. Leng th
Sno. Sepal. Wid
th
Petal. Leng th
Petal. Widt h
Sepal. Leng th
1.0000000 -0.1175698
0.8717538
0.8179411
Sepal. Widt h
-0.1175698
1.0000000 -0.4284401
-0.3661259
Petal. Leng th
0.8717538 -0.4284401
1.0000000 0.9628654
Petal. Widt h
0.8179411 -0.3661259
0.9628654 1.0000000
For the reduced dataset D the same clustering process was applied and the iteration results were presented in Tables 4 and in Figures 3and4.
Table4. Cluster distribution for k-means clustering of reduced (Iris dataset, without Petal. Width).
Sno. setosa versicolor virginica
1 0 46 50
2 18 4 0
3 32 0 0
Figure 3. Cluster distribution for k-means clustering of reduced Iris data set without Petal. Width.
Figure4. Cluster distribution for k-means clustering of reduced Iris Dataset without Petal. Width (Sepal. Length Vs Sepal. Width).
From the above clustering result it can be observed that the formed clusters after first iteration are overlapping one on another but the area of overlapping is lower than it was in the earlier iteration, showing some good optimal result.
During the process the attribute (column) named Petal. Length was removed as it has the next highest correlation with
For the reduced dataset D the same clustering process was applied and the iteration results were presented in Tables 5 and in Figures 5 and 6.
[image:4.595.311.539.505.651.2]sepal. Length.
Table 5.Cluster distribution for k-means clustering of reduced (Iris dataset wit hout Petal. Width and Petal.length).
Sno. setosa versicolor virginica
1 50 0 0
2 0 12 35
3 0 18 15
Figure 5.
Figure6.
Cluster distribution for k-means clustering of reduced Iris data set without Petal. Width and Petal. Length.
Cluster distribution for k-means clustering of reduced Iris Dataset without Petal. Width and Petal. Length (Sepal. Length Vs Sepal. Width).
From the above clustering result it can be observed that the formed clusters after two iterations are not overlapping significantly, showing an improved optimal result.
C.
As the optimum clustering criterion is seems to be reached from the above result and the process had stopped.
At the first iteration the formed clusters regions are intersecting a lot. This was due to the combined effect of four
attributes considered for clustering. Keeping this in mind the correlations among the attributes were calculated to know the similar attributes in terms of the action. To reduce the combined effect one of the attribute (column) was removed and it was observed that during the process of iterations of attribute reduction the area of intersection became smaller and at the final stage it is almost ignorable. Therefore the attribute reduction based on correlation measure provided a good result of clustering. Thus the proposed process proved its ability in terms of providing optimized result of k-means clustering.
VI. CONCLISION
The k-means algorithm is one of the top most algorithms in data mining and machine learning. However it has its own limitations while implementing on numerous types of data variants. The algorithm is not suitable when the noise is high and the outliers are more. Reduction of removable attributes solves half of the problems. This paper proposed a data reduction procedure as a pre processing step to k-means algorithm. The reduction is based on inter attribute correlations. The proposed methodology was applied on a well known dataset adopted from UCI machine learning repository. The obtained results were effective.
REFERENCES
[1]. Jianpeng Qi, Yanwei Yu, LihongWang, Jinglei Liu and YingjieWang,“An effective and efficient hierarchical K-means clustering algorithm”, International Journal of Distributed Sensor Networks 2017, Vol. 13(8).
[2]. Jiawei Han, Micheline Kamber and Jian Pei “Data Mining: Concepts and Techniques”, 3rd
[3]. Kalpana D. Joshi et al, “Modified K-Means for Better Initial Cluster Centers “International Journal of Computer Science and Mobile Computing Vol.2 Issue. 7, July- 2013, pg. 219-223.
edition. The Morgan Kaufmann Series in Data Management Systems Morgan Kaufmann Publishers, July 2011. ISBN 978-0123814791.
[4]. Sohrab Mahmud Md, Mostafizer Rahman Md., Nasim Akhtar Md., “Improvement of K-means Clustering algorithm with better initial centroids based on weighted average”, 7th International Conference on Electrical and Computer Engineering, 2012, pp. 647-650.
[5]. Vaishali Rajeev Patel, Rupa G. Mehta,“Performance Analysis of MK-means Clustering Algorithm with Normalization Approach”, World Congress on Information and Communication Technologies, 2011, pp. 974-979.
[6].
based on dissimilarity”, Proceedings 2013 International Conference on Mechatronic Sciences, Electric Engineering and Computer (MEC) Year: 2013 Pages: 2629 –
[7]. Zhang Chen, Xia Shixiong, “K-means Clustering Algorithm with improved Initial Center”, Second International Workshop on Knowledge Discovery and Data Mining,2009, pp. 790-792.