ABSTRACT
HOU, GUOJING. Development of Sensor Physics for a Nuclear Oil Well Logging Tool. (Under the direction of Robin P. Gardner.)
In the oil industry, oil well logging is a practice that utilizes a measuring apparatus
to characterize the rock formations traversed by the measuring device against the depth
of the oil well. Different well logging devices make uses of different physical principles,
such as acoustics, nuclear physics, electrical science, etc., to measure the properties of
the rocks and their contained fluids. One unique type of logging is geochemical
log-ging, which estimates the elemental compositions of the rock matrices by measuring the
gamma spectral responses from the rocks, stimulated by energetic neutrons. Such a tool
measures the gammas produced by (n,γ) reactions, natural radiations, decay gammas of radioactive isotopes produced by neutron activation, and sometimes (n, n’γ) reactions.
Since its introduction in late 1980s, geochemical logging has become an important means
for log analysts to understand the mineralogy of the oil wells.
The core components of a geochemical logging tool include a neutron source and a
gamma spectroscopy detector. In recent years, the successful commercialization of LaBr3
scintillation crystal illuminates a new possibility for the industry. The LaBr3 crystal has
some favorable properties compared to the NaI and BGO crystals, which are commonly
used. It has better energy resolution and better resolution temperature stability than
the BGO detector, as well as higher density than the NaI detector.
This dissertation is devoted to the sensor physics of a geochemical well logging tool,
which is equipped with a D-T pulsed neutron generator and a LaBr3 detector. In this
study, the logging tool is characterized by developing a full set of elemental standards and
elemental sensitivity factors. In addition, a numerical method based on the
Levenberg-Marquardt method is also developed. The standards, sensitivity factors, and
decon-volution method constitute a full tool set that allows calculations of elemental weight
concentrations from the tool measurements.
Preliminary tests show promising results. The spectral deconvolution algorithm
proved to be capable of efficiently deconvolving the composite spectra, while accounting for both spectral misalignments and resolution degradations. When applied in
conjunc-tion with the elemental standards and the sensitivity factors, the algorithm calculated
©Copyright 2017 by Guojing Hou
Development of Sensor Physics for a Nuclear Oil Well Logging Tool
by Guojing Hou
A dissertation submitted to the Graduate Faculty of North Carolina State University
in partial fulfillment of the requirements for the Degree of
Doctor of Philosophy
Nuclear Engineering
Raleigh, North Carolina
2017
APPROVED BY:
Richard R. Pemper Dmitriy Y. Anistratov
Yousry Y. Azmy Ralph C. Smith
BIOGRAPHY
Guojing Hou was born and raised in Tianjin, China. He received a Bachelor of
Engi-neering in Nuclear EngiEngi-neering in 2008. In the summer of 2012, he began pursuing his
ACKNOWLEDGEMENTS
I would like to thank my advisor, Dr. Gardner, for his mentorship, continuous support,
and for leading me into the wonderful field of radiation detection. Without him, I would
have had no chance of completing this project. I would also like to thank Dr. Pemper for
his guidance during every step of this project. It has been my privilege and great fortune
to have been able to work with them. As scientists, they have set extraordinarily high
standards, which I will strive to reach for the rest of my life. I am also highly appreciative of Dr. Anistratov, Dr. Azmy, and Dr. Smith for their many insightful suggestions on this
project.
My sincere gratitude also goes to my friends, with whom I have shared many
unfor-gettable memories.
Finally, I would like to thank my parents and wife, who have always been
TABLE OF CONTENTS
LIST OF TABLES . . . vi
LIST OF FIGURES . . . vii
Chapter 1 Introduction . . . 1
1.1 Background . . . 1
1.2 Overview . . . 3
Chapter 2 Nuclear Reactions . . . 7
2.1 Neutron transport . . . 7
2.1.1 Elastic scattering . . . 7
2.1.2 Neutron capture (n,γ) . . . 8
2.1.3 Inelastic scattering (n, n’γ) . . . 8
2.1.4 Probabilities of reactions . . . 10
2.2 Photon transport and detector Response . . . 10
2.2.1 Photon reactions . . . 10
2.2.2 Probabilities of reactions . . . 14
2.2.3 Detector response . . . 14
2.3 Data Sources . . . 22
Chapter 3 Spectral Acquisition and Preprocessing . . . 25
3.1 Spectral acquisition . . . 25
3.1.1 Neutron source . . . 25
3.1.2 Measuring spectra . . . 26
3.2 Noticeable spectral features . . . 29
3.3 Spectra preprocessing . . . 37
3.3.1 Alignment . . . 37
3.3.2 Background subtraction . . . 47
Chapter 4 Spectral Analysis . . . 50
4.1 Overview . . . 50
4.2 Elemental standards . . . 51
4.2.1 Definition . . . 51
4.2.2 Generation . . . 53
4.2.3 Considerations . . . 56
4.3 Deconvolution algorithms . . . 58
4.3.1 Overview . . . 58
4.3.2 Weighted linear least squares . . . 60
4.3.3 Non-negative least squares . . . 64
4.3.5 Modifications of LM for spectral deconvolution . . . 72
4.4 Elemental concentrations . . . 78
4.4.1 Sensitivity factor . . . 78
4.4.2 Oxide closure model . . . 87
Chapter 5 Complete Example . . . 91
5.1 Sample measurements . . . 91
5.2 Spectral preprocessing . . . 92
5.3 Spectral deconvolution . . . 93
5.4 Weight calculation . . . 95
Chapter 6 Discussion and Conclusions . . . 100
LIST OF TABLES
Table 1.1 Current geochemical well logging devices. . . 3
Table 2.1 Inelastic scattering threshold energies of isotopes commonly found in the earth formations. . . 9
Table 3.1 Peaks used for the alignment, and their centroids before and after the alignment. Based on these peaks, M = 1.0678, A=−1.879. . . 46
Table 4.1 Numerical results of the deconvolutions. . . 64 Table 4.2 Numerical results of the deconvolution of dolomite capture spectrum
using different methods. . . 66 Table 4.3 XRF measurement of quartz+calcite sample . . . 84 Table 4.4 Deconvolution results of the quartz + calcite sample. . . 87 Table 4.5 Mineral commonly associated with hydrocarbon-bearing formations 89 Table 4.6 Oxidation factors of elements commonly found in earth formations 90
Table 5.1 XRF analyzed elemental concentrations of the dolomite block. . . . 91 Table 5.2 Gain setting calibration parameters. . . 94 Table 5.3 Calculated capture elemental yields. . . 96 Table 5.4 Calculated inelastic elemental yields. . . 97 Table 5.5 Elemental concentrations of the formation matrix calculated using
the capture standard. . . 98 Table 5.6 Elemental concentrations of the formation matrix calculated using
the inelastic standard. . . 98 Table 5.7 Elemental concentrations of the formation matrix averaged over the
LIST OF FIGURES
Figure 1.1 Block diagram of the Tool. . . 4
Figure 1.2 A prototype of the Tool. . . 4
Figure 1.3 Flow chart of data acquisition and processing of the Tool. . . 5
Figure 2.1 Level scheme of 28Si, up to 6880 KeV[13]. . . 11
Figure 2.2 Ratios of microscopic cross sections of individual reactions to the total microscopic cross section of28Si. Cross section data extracted from ENDF data file[14]. . . 12
Figure 2.3 Maximum percentage of energy transferable to the recoil electron as a function of incident photon energy. . . 13
Figure 2.4 Macroscopic cross sections of LaBr3between 100 KeV and 20 MeV. Calculated based on NIST XCOM database. . . 15
Figure 2.5 Ratios of three types of photon reactions for LaBr3 between 100 KeV and 20MeV. . . 15
Figure 2.6 Cross section of the geometry set up used for MCNP modeling. Figure shows a cross section perpendicular to the Y axis. . . 16
Figure 2.7 3D presentation of the geometry set up used for MCNP modeling. 17 Figure 2.8 MCNP F8 tally result of the geometry shown in Figure 2.6. . . 17
Figure 2.9 FWHM fitted to Equation 2.9 and Equation 2.10 respectively. The measurements are made using a LaBr3 detector. . . 22
Figure 2.10 Energy spectrum as shown in Figure 2.8 broadened using realistic broadening parameters. . . 23
Figure 3.1 Firing sequence of the Tool. The yellow blocks represent the neu-tron emission sub-cycles of Period 1, the green block represents Period 2, and the purple block represent Period 3. . . 28
Figure 3.2 Count rate time spectrum of a water tank measurement. . . 28
Figure 3.3 Unprocessed gamma spectra of a water tank measurement shown in raw counts. . . 30
Figure 3.4 Unprocessed gamma spectra of a water tank measurement shown in count rates. . . 30
Figure 3.5 (n, p) reaction ratio of 16O. Data from ENDF data files. . . 32
Figure 3.6 16N decay scheme. The chart also shows the energy levels and de-excitation gamma energies of 16O. Data from ENSDF data files. 33 Figure 3.7 Background spectrum of a sandstone measurement. . . 34
Figure 3.8 Decay scheme of 2813Al. Data from ENSDF data files. . . 34
Figure 3.9 (n, p) reaction ratio of 28Si. Data from ENDF data files. . . 35
Figure 3.11 13857Laβ− decays to 13858Ce. The branching ratio is 34.4%. Data from ENSDF data files. . . 36 Figure 3.12 13857La electron capture decays to 13856Ba. The branching ratio is
65.6%. Data from ENSDF data files. . . 37 Figure 3.13 Unprocessed capture spectra of two separate water tank
measure-ments. 2216A and 2216B are measurement IDs. . . 38 Figure 3.14 The Gaussian filter used for smoothing the measurement spectrum.
The FWHM≈4.43. . . 39 Figure 3.15 Comparison of the raw capture spectrum of water tank
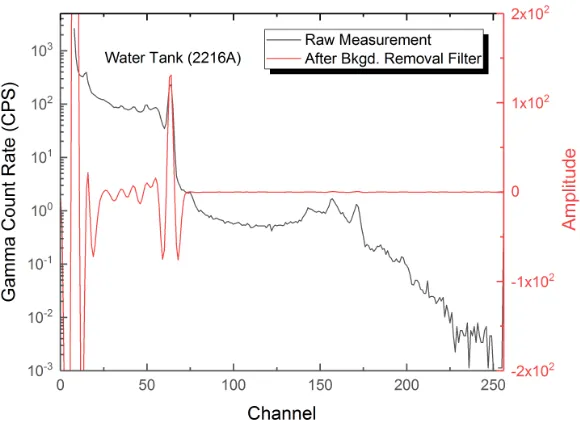
measure-ment (2216A) and after the Gaussian filter is applied. . . 40 Figure 3.16 The background removal filter used for removing the positive
com-ponent of the spectrum. . . 41 Figure 3.17 Comparison of the raw capture spectrum of water tank
measure-ment (2216A) and after application of the Gaussian filter and back-ground removal filters. . . 41 Figure 3.18 Figure 3.17 zoomed to channel 130 to channel 190 to show the details. 42 Figure 3.19 Water tank capture spectrum measurement zoomed to channel 130
to channel 190 showing shapes of the spectrum after each filter is applied. The dashed lines mark the three peaks identified by the algorithm in this range. . . 42 Figure 3.20 Oxygen peak of the capture spectrum of the water tank
measure-ment fitted to Equation 3.2. . . 44 Figure 3.21 By definition, the ith channel ranges from pointi−1 to pointi on
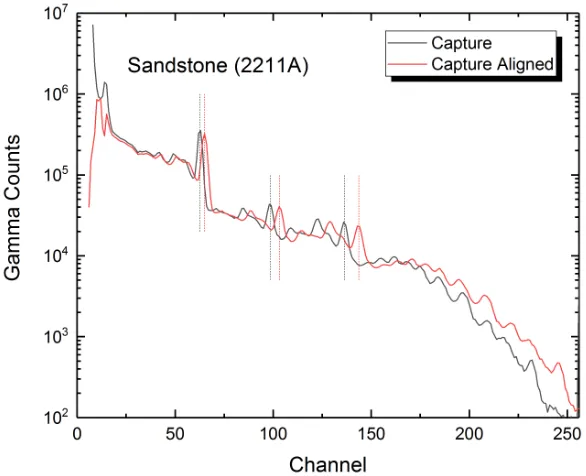
the continuous scale. . . 45 Figure 3.22 Capture spectrum of sandstone with water borehole measurement
before and after spectral alignment. The dotted lines indicate the peaks used for the alignment, and their centroids before and after the alignment. . . 47 Figure 3.23 Subtraction of the background radiation spectrum from the capture
spectrum. The yellow circles highlight some significant changes after the subtraction. . . 49 Figure 3.24 Subtraction of the background radiation spectrum from the burst
spectrum. . . 49
Figure 4.1 Overview of the spectral analysis process. . . 51 Figure 4.2 Comparison of Al capture standards measured under different
en-vironment. . . 52 Figure 4.3 Capture spectrum of a sandstone sample with water in the
Figure 4.5 Snapshot of the SpeStripping code. The blue curve is the capture spectrum of the sandstone measurement. The red curve is the hydrogen capture standard. The yellow curve is the residue curve after subtracting the H standard from the measurement, after the adjustments characterized by the parameters shown on top of the plot. . . 57 Figure 4.6 Elemental standards of (n, γ) capture reaction. The amplitudes
are artificially adjusted to show the details of each standard. . . . 62 Figure 4.7 Comparison of measured dolomite capture spectrum and fit
spec-trum using two sets of standards. ‘Limited Set’ refers to the set with H, Ca, and Mg. ‘w/ Interference’ refers to the set with H, Ca, Mg, and Si, which is not present in the sample. . . 63 Figure 4.8 Iteration and convergence of τ calculated using LM method. . . . 68 Figure 4.9 Change of χ2 in each iteration of the fitting shown in Figure 4.8.
The red curve is χ2 computed using different τ values between 5 and 14. . . 69 Figure 4.10 Iteration of fitting a normal distribution using the LM method. . . 70 Figure 4.11 χ2 as a function of ω for the model y= sin(1.1·x). Multiple local
minimum χ2 exists between -10 and 10. Whether the LM fitting can find the global optimum ω depends on the initial guess. . . 71 Figure 4.12 Two artificially generated component spectra. . . 76 Figure 4.13 Comparison of the ideal composite spectrum, and the distorted
and Poisson randomized composite spectrum. The ideal composite spectrum is Gaussian broadened by σ = 3, contracted by 5%, and shifted to the right by 5 channels to create the distorted spectrum. 76 Figure 4.14 Comparison of the distorted and randomized composite spectrum
and the fitted spectrum. The reduced χ2 of the deconvolution is 0.7, which suggests a good fit. . . 77 Figure 4.15 Comparison of the spectral deconvolution performed using the
reg-ular LM method and the modified LM method. The reduced χ2 for both cases is ∼15.1, with a difference of smaller than 10−3. . . 79 Figure 4.16 Capture sensitivity factors of the Tool. . . 83 Figure 4.17 Inelastic sensitivity factors of the Tool. . . 83 Figure 4.18 Barrels used for calibration and characterizations. . . 84 Figure 4.19 Empty water tank. The hole in the middle extends deeper, so that
the neutron generator and gamma detector portion of the logging tool can be positioned at the center of the sample barrel. . . 85 Figure 4.20 Logging tool and characterization barrel properly placed inside the
tank. . . 85 Figure 4.21 Measurement and fit of the quartz + calcite sample. . . 86
Figure 5.2 Raw measurements of the dolomite sample in water borehole. . . . 93 Figure 5.3 Raw measurements aligned to specification using parameters
cal-culated in Table 5.2. . . 94 Figure 5.4 The net burst, capture, and inelastic spectra after background
Chapter 1
Introduction
1.1
Background
This research involves developing a nuclear geochemical oil well logging device, which is a wireline logging tool used for open hole wells.
In the context of oil exploration, well logging refers to ‘a recording against depth of
any of the characteristics of the rock formations traversed by a measuring apparatus in
the well-bore’[1]. The characteristics can be measured by retrieving samples of the rock
formations from the borehole for lab analysis, or by utilizing logging devices and
measur-ing the properties inside the borehole. Different types of logs are compiled, correlated,
reviewed, and interpreted by professionals to assess the status of the oil well. The
anal-ysis results are then provided to the management as the basis for operational decisions.
Well logs provide critical information regarding the status of an oil well. Each oil well
may undergo several well logging runs throughout its entire life cycle. Well logging, as a general technique, is also utilized in fields other than oil exploration and production,
such as uranium exploration.
Wireline logging is one of several major types of well logging, categorized by how
the measurements are taken. A wireline logging tool is usually a long cylindrical device,
attached to wires. The logging is performed by lowering one or a string of such tools
down to the bottom of the borehole, and lifting up the tool(s) again. The measurement
is usually taken when the tool is being pulled up through the well, but can also be
taken when the tool is being lowered down into the well. The depth of the tool at each
is attached. The measured data is either sent back to the surface in real time, or stored
on the device and retrieved at a later time. Wireline logging is performed after a borehole
is drilled. Another type of logging is logging while drilling, or LWD for short. As the
name implies, LWD is performed while a borehole is being drilled, as the LWD device
is integrated to be part of the drilling collar. The data measured by the LWD tool can
be stored on the device, sent back to the surface through drillpipe in real time, or via
generating pulses in the well’s mud.
The tool being developed and described in this dissertation (‘the Tool’) is a
geochem-ical logging tool[2], meaning that it is specialized in measuring the elemental
concentra-tions of the rock formaconcentra-tions. A geochemical logging tool is essentially a prompt gamma neutron activation analysis (PGNAA) device, with some designs specifically facilitating
the application environment of an oil well. This type of device is equipped with a neutron
source and a gamma spectroscopy detector. The neutron source stimulates the rock
for-mations by emitting high energy neutrons, and measures the gamma spectral responses
of the formation. The two primary types of reactions are the (n, γ) neutron capture
reaction, and the (n, n’γ) neutron inelastic scattering reaction. Both reactions release
gamma photons whose energies are characteristic of the target nuclei. The spectrum is
then analyzed for elemental contributions, which are further converted into elemental
concentrations. Such elemental analysis is made possible by the fact that, 9 elements, namely oxygen, silicon, aluminum, iron, calcium, sodium, potassium, magnesium, and
hydrogen, make 98.13% of the total mass of the earth crust[3][4].
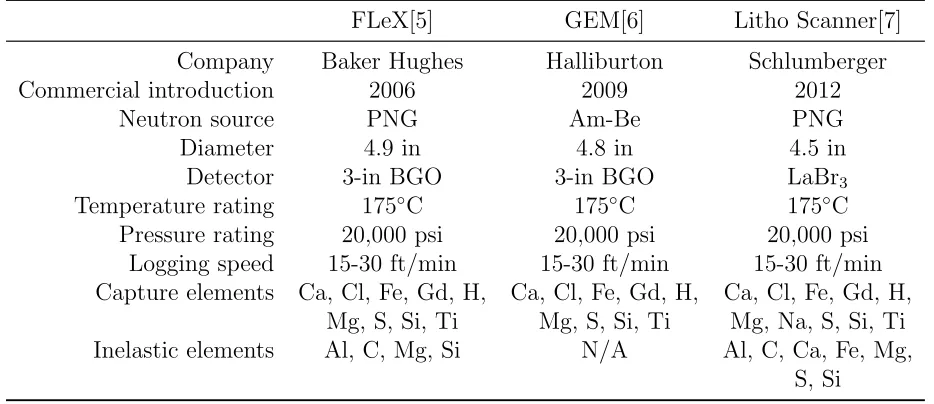
In the industry, a few major oil service companies developed several types of
geo-chemical logging devices. Table 1.1 lists the major geogeo-chemical tools and their technical
parameters. Of the three tools, FLeX and Litho Scanner both use pulsed neutron
genera-tors as neutron source. Comparing to the Am-Be source which is used by the GEM tool,
neutrons emitted from the PNG have much higher energy (14 MeV), which is enough
for the target nuclei to undergo inelastic scattering reactions. This allows FLeX and
Litho Scanner to directly measure the carbon concentration in the formation, which is important for deriving total organic carbon (TOC). In addition, the application of a
controllable source also reduces the potential risks in storing, transporting, and using a
radioactive source. On the other hand, using a chemical source considerably simplifies
the electronics on the device.
Table 1.1 Current geochemical well logging devices.
FLeX[5] GEM[6] Litho Scanner[7]
Company Baker Hughes Halliburton Schlumberger
Commercial introduction 2006 2009 2012
Neutron source PNG Am-Be PNG
Diameter 4.9 in 4.8 in 4.5 in
Detector 3-in BGO 3-in BGO LaBr3
Temperature rating 175◦C 175◦C 175◦C
Pressure rating 20,000 psi 20,000 psi 20,000 psi
Logging speed 15-30 ft/min 15-30 ft/min 15-30 ft/min Capture elements Ca, Cl, Fe, Gd, H, Ca, Cl, Fe, Gd, H, Ca, Cl, Fe, Gd, H,
Mg, S, Si, Ti Mg, S, Si, Ti Mg, Na, S, Si, Ti Inelastic elements Al, C, Mg, Si N/A Al, C, Ca, Fe, Mg,
S, Si
Comparing to BGO, LaBr3 is a relatively new crystal, as it was first introduced in 2001[8]
and became commercially available in 2006[9]. LaBr3 does not only have better energy resolution, it is also more resilient to higher temperature, and the resolution does not
degrade as badly as BGO does. Some type of temperature control device has to be
applied if a BGO detector is to be used in a high temperature environment. The only
disadvantage of LaBr3 is that it is not as dense as the BGO, which affected its detection
efficiency, but still, its denser than NaI.
1.2
Overview
The Tool uses a D-T neutron generator as the neutron source and a LaBr3 crystal as
the detector. Figure 1.1 schematically shows the major components of the tool. In
addition to the detector and the neutron source, another important component is a
neutron reflector made of tungsten. This reflector prevents the energetic neutrons from
entering the detector without reacting with the substance outside the tool. Figure 1.2
shows a photo of a prototype of the Tool.
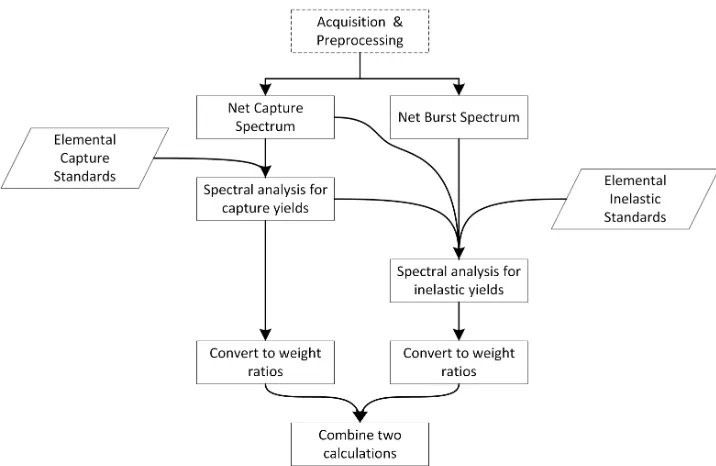
This research focuses on the data processing of the Tool. The data acquisition and
processing procedure for the Tool is illustrated in a flow chart shown in Figure 1.3.
Figure 1.1 Block diagram of the Tool.
Figure 1.2A prototype of the Tool.
1. ‘Initialization’ refers to the initialization of the device control and data processing
software, which loads a variety of device parameters. The most important ones
are the neutron firing sequence, and the predetermined elemental characteristic
gamma standard spectra, or ‘elemental standards’ for short. These are illustrated
in Chapter 3 and Chapter 4.
2. ‘Gamma spectrum measurements’ refers to the generation of two gamma energy
spectra: net neutron capture gamma spectrum, and net neutron inelastic scatter-ing gamma spectrum. Three gamma spectra are actually measured alternately in
order to generate the two aforementioned spectra: neutron capture gamma
spec-trum, neutron burst gamma specspec-trum, and background spectrum. The
fundamen-tal physics are briefly illustrated in Chapter 2. The generation of the two final
spectra are elaborated in Chapter 3.
3. ‘Spectral analysis for elemental yields’ refers to the step that numerically analyzes
the capture and inelastic spectra. The two spectra are individually resolved using
the predetermined elemental standards to estimate the number of gamma counts each element contributes to each spectrum. The numerical method used for the
4. ‘Determination of elemental concentrations’ and ‘Mineralogy analysis’ are the two
final steps. The first converts elemental yields to elemental weight concentrations.
The second converts elemental concentrations to mineralogy results. Conversion
to elemental concentrations is described in Chapter 4. Mineralogy calculation is a
geology problem, and is out of the scope of this research.
Chapter 2
Nuclear Reactions
The Tool resolves the elemental compositions of the rock formations by deconvoluting
the neutron activated prompt and delayed gamma spectra. This section discusses the
nuclear reactions that are of importance to the Tool. The fundamental physical processes
are explained in great details elsewhere, such as Knoll’s radiation detection book[10] and
Han’s dissertation[11]. In this section, the focus is on how they are of interest to the development and application of the Tool.
2.1
Neutron transport
Of the numerous ways in which neutrons can interact with nuclei, three of them are the
most important to the Tool.
2.1.1
Elastic scattering
The elastic scattering reaction changes the neutron’s travel direction and energy, but
does not directly contribute to the gamma spectrum. It provides a path for neutrons to
thermalize so that neutrons can undergo the neutron capture reaction, which eventually contributes to the gamma spectrum. The reaction is characterized by the conservation
2.1.2
Neutron capture (n,
γ
)
Although (n, γ) is possible over a wide energy range, its probability is much higher in
the thermal energy range. During the (n, γ) reaction, a neutron is absorbed by the
target nucleus, and a new nucleus at an excited energy state is formed. The new nucleus
de-excites by emitting at least one γ photon, whose energy is characteristic of the target
nucleus.
The newly formed nucleus may be stable or unstable. One commonly observed
exam-ple is an 27Al nucleus, which may absorb a neutron to form an 28Al nucleus. In addition
to the characteristic gammas due to the (n,γ) reaction, 28Al is a radioactive isotope with
a half-life of 2.24 minutes. 28Alβ− decays to 28Al, and also emits a 1.78 MeV γ photon. Notice that in the context of nuclear reactor engineering, the term ‘neutron capture’
refers to all types of neutron reactions that are not scattering reactions. In other words,
(n, γ) is one type of neutron capture reaction, and neutron capture reaction does not
include (n,γ) only. For example, the nuclear fission reaction is also a type of neutron
cap-ture reaction. Nevertheless, the term ‘neutron capcap-ture’, or simply ‘capcap-ture’ is frequently
used as a synonym for (n, γ) in the oil industry, as other types of neutron capture
re-actions, such as fission or (n, α) reaction, are either very rare, or the products make no
detectable contribution to the measurements.
2.1.3
Inelastic scattering (n, n’
γ
)
Inelastic scattering is another wayγcan be generated. In an inelastic scattering reaction,
an energetic neutron collides with a nucleus, and instead of being scattered immediately,
the neutron is absorbed into the nucleus, forming a new metastable compound nucleus.
The compound nucleus then decays by emitting a neutron, and leaving the target nucleus
in an excited state. The excited nucleus may de-excite by emitting gamma photons whose
energies are characteristic of the target nucleus. Such inelastic scattering that results in
de-excitation by gamma emissions is denoted by (n, n’γ), and can be represented by the formula:
A
ZX +n −→ A+1m
ZX−→ A
ZX
∗
+n0 −→ A ZX +n
0
+γ
Compared to the (n, γ) reaction, the (n, n’γ) is more complex from the perspective
of gamma spectroscopy for two reasons:
which is derived from the Q value formula, and is expressed as[12]:
Tn ≥EL1 A+ 1
A (2.1)
whereTnis the kinetic energy of the incident neutron,EL1 is the energy of the target nucleus’ first excited level, and A is the atomic number of the target nucleus. The
formula implies that the energy of the incident neutron should be slightly higher
than the first excited state of the target nucleus in order for inelastic scattering to
occur. This energy threshold is usually in the MeV range. Table 2.1 summarizes the
(n, n’γ) reaction threshold energies for several isotopes that are commonly found
in the earth formations.
Table 2.1 Inelastic scattering threshold energies of isotopes commonly found in the earth formations. Isotope Threshold (MeV) Isotope Threshold (MeV) 12
C 4.81 32S 2.30
16O 6.44 39K 2.59
24Mg 1.43 40Ca 3.44 27Al 0.88 48Ti 1.00 28
Si 1.84 56Fe 0.86
2. The gamma energy spectrum of the (n, n’γ) reaction is a function of energy of the incident neutron. Due to the mechanism of (n, n’γ) reaction, higher incident
neutron energy may excite the target nucleus into higher energy levels, and thus
‘unlock’ new decay schemes and gammas with different energies to be emitted.
Figure 2.1 shows the level scheme of the 28Si nucleus. According to Equation 2.1,
the threshold energy for the first excited state is 1.779 × 29/28 = 1.843 MeV,
and that of the second excited state is 4.783 MeV. If the incident neutron has an
energy below 1.843 MeV, inelastic scattering is impossible. If the neutron’s energy
is between 1.843 MeV and 4.783 MeV, inelastic scattering is possible, but only
then the target nucleus can be excited to the second energy level, and can emit
2.838 MeV gammas.
2.1.4
Probabilities of reactions
Figure 2.2 illustrates the ratios of the individual reaction microscopic cross section to the total microscopic cross section of isotope 28Si, over the energy range of 0.001 eV to 20
MeV. This represents the probability of each reaction, relative to the sum of all reactions. 28Si is used as an example because it is one of the most commonly observed elements in
the earth, and both its capture gammas and (n, n’γ) gammas are relatively pronounced.
From the figure, one can see that elastic scattering is the most probable reaction
between 0.001 eV and ∼ 5 MeV. (n, γ) has a higher probability in the thermal energy
range, except for a few resonances in the fast neutron range. These resonance captures
do not have a big impact on nuclear oil well logging application, as the resonance capture regions are all very narrow. It can also be observed that inelastic scattering only becomes
possible from approximately 2 MeV. To be exact, the probability of inelastic scattering
is 0 below the 1.843 MeV threshold.
Also notice that at higher energies, the probability of reactions other than elastic
scattering, inelastic scattering, or (n,γ) start to increase. The products of these reactions
vary, but are usually ions, such asαparticles, with very short range, and are disregarded
in the design of a nuclear oil well logging device.
2.2
Photon transport and detector Response
2.2.1
Photon reactions
The three types of photon reactions of concern to the Tool are: photoelectric absorption,
Compton scattering, and pair production, which will be explained briefly.
Photoelectric absorption
Photoelectric absorption refers to the process that a photon imparts all its energy to
an orbital electron, and the electron is ejected from the orbit. After the reaction, the
Figure 2.2 Ratios of microscopic cross sections of individual reactions to the total mi-croscopic cross section of 28Si. Cross section data extracted from ENDF data file[14].
the photoelectric effect to take place. After the electron is ejected, the atom may be in an
excited state, and may de-excite by emitting fluorescence X-rays. Due to the detection
resolution, these X-rays cannot be directly observed on typical scintillation detectors.
Compton scattering
Compton scattering refers to the process where a photon imparts a portion of its energy
to an orbital electron, after which the electron is ejected from its orbit. Both energy and
momentum are conserved in the reaction. Therefore, the energy of the scattered photon
and the kinetic energy of the scattered electron can be calculated if the energy of the
incident photon and its incident angle are known, i.e.,
Eγ0 = Eγ
1 + (1−cosθ)Eγ/mec2
(2.2)
where Eγ0 is the energy of the scattered photon, Eγ is the energy of the incident photon, cosθ is the scattering angle of the photon in lab coordinate, me is the mass of electron,
A distinctive feature of Compton scattering is that the maximum amount of energy
that a photon can impart to the electron is limited. The maximum electron recoil energy
directly dictates the Compton edge of a gamma spectrum. According to Equation 2.2,
when θ = 0, the incident photon does not lose energy. When θ = π, the energy loss, or
the energy transferred to the electron is
Te,max= 2Eγ/mec 2
1 + 2Eγ/mec2
·Eγ (2.3)
where Te,max denotes the maximum possible electron recoil energy. Figure 2.3 shows the
maximum percentage of energy of the incident photon that can be transferred to the recoil electron, as a function of the incident photon energy. It can be seen that higher
energy incident photons lose more energy.
Pair production
Pair production refers to the process where an energetic photon ceases to exist, and splits
into an electron/positron pair. Pair production is not a simple spontaneous reaction that
can take place by a photon alone. Usually, the photon must be in the vicinity of a nucleus.
In rare occasions, the pair production reaction may also take place in the vicinity of an electron, but the probability is orders of magnitude smaller than pair production in a
nuclear field reaction. As the energy of the photon is completely converted into mass
and kinetic energies, the energy of the photon must be greater than 1.022 MeV, which
is two times the mass of an electron. The kinetic energy of the electron or the positron
is simply half of the energy of the incident photon in excess of 1.022 MeV. The electron
and positron subsequently travel in the medium, and deposit their kinetic energy. When
the electron deposits all its energy, it becomes localized. When the positron is localized,
it is annihilated with an electron, and creates two 511 KeV photons.
2.2.2
Probabilities of reactions
In principle, photoelectric absorption dominates the lower energy range, around or below 100 KeV; Compton scattering dominates the intermediate MeV range; and pair
produc-tion becomes the dominant reacproduc-tion in the upper MeV region. Figure 2.4 shows the
macroscopic cross sections (Σ) of the three individual reaction types and the total Σ of
LaBr3. Figure 2.5 shows the relative ratios of the three reactions.
2.2.3
Detector response
The ionizing energetic photons activated by the neutrons eventually need to be recorded
by the detector. The Tool utilizes a LaBr3 crystal, which is very well suited for well
logging. This section discusses features of the detector in the context of gamma
spec-troscopy.
Features on a spectrum
In order to illustrate and discuss features that are typically observed in gamma ray energy
spectra under more restricted and idealized conditions, an MCNP[15][16] simulation is
Figure 2.4 Macroscopic cross sections of LaBr3 between 100 KeV and 20 MeV. Calculated
based on NIST XCOM database.
Figure 2.5 Ratios of three types of photon reactions for LaBr3 between 100 KeV and
the geometry modeled in MCNP. In this geometry, cell 11 is a 6 inches long right circular
cylinder (RCC) LaBr3 detector; cell 12 is a cubical vacuum space of 60 cm long on each
side, excluding cell 11; cell 13 is a 60 cm radius sphere excluding the cube, made of lead;
cell 17 is the outer vacuum. The radiation source is set to be an isotropic photon source
which emits 2.223 MeV photons at (12.7,0,0), or 4 inches away from the cylindrical
surface of the detector. Figure 2.7 is a 3 dimensional representation of the model.
Figure 2.6 Cross section of the geometry set up used for MCNP modeling. Figure shows a cross section perpendicular to the Y axis.
This model is very much simplified and idealized. However, it is very convenient
to illustrate some important concepts of gamma spectroscopy involved in nuclear oil
logging. Figure 2.8 shows the simulation result. The F8 tally is used for calculating the
distribution of energy deposited in the detector. The spectrum shown in Figure 2.8 is not broadened, which means that the detection resolution is infinite. Eight features of
the spectrum have been marked by letters, they are:
Figure 2.7 3D presentation of the geometry set up used for MCNP modeling.
a source photon enters the detector, and deposits all its energy in the detector. The
energy deposition can be completed by one single photoelectric absorption, or by a series
of reactions. A full energy peak is also occasionally referred to as a ‘photoelectric peak’.
This is incorrect, because this peak does not only consist of contributions from single
photoelectric absorption of source photons.
B: Compton edge Statistically, some source photons will enter the detector, undergo the Compton scattering reaction once, and then exit the detector without depositing
more energy. If this happens, according to Equation 2.2, as the scattering angle varies
between 0◦to 180◦, the energy deposited in the detector varies between 0 to a maximum
value, when θ = 180◦. For the case modeled, this maximum energy deposition due to Compton scattering is
∆E =Eγ−Eγ0 = 2.223−
2.223
1 + (1−cos(π))×2.223/0.511 = 1.994 MeV (2.4)
On the gamma energy spectrum, this corresponds to an edge, pointed by letter ‘B’ in
Figure 2.8, known as the ‘Compton Edge’.
C: Single escape peak Energy of the single escape peak equals the energy of the source photon minus 511 KeV. When a source photon enters the detector, undergoes a
pair production reaction and becomes an electron-positron pair, the positron annihilates
inside the detector. Finally one of the 511 KeV annihilation photons escapes the detector
without depositing energy inside the detector, and the final pulse signal formed will
contribute to the single escape peak. After the reaction is complete, the source photon
deposits all its energy except the 511 KeV annihilation photon. The energy of the peak
formed is the energy of the source photon minus 511 KeV.
D: Double escape peak Energy of the double escape peak equals the energy of the source photon minus 1.022 MeV. The mechanism of the formation of the double escape
peak is almost identical to that of the single escape peak, except that both annihilation
photons escape from the detector without any interaction.
the detector, where one of the 511 KeV photons from the positron annihilation reaches
the detector and deposits all its energy in the detector. The annihilation peak primarily
appears when the detector is surrounded by a dense medium.
F: Backscattering peak Like the annihilation peak, the backscattering peak is also formed outside the detector. A pulse signal contributing to the backscattering peak is
formed when a source photon reacts with the medium outside the detector by undergoing
Compton scattering. The scattered photon reaches the detector and deposits all of its
energy in the detector. The scattering angle incorporates a small range around 180◦, and
therefore the backscattering peak is not just a single line.
The energy of the backscattering peak is not a constant, and is usually between 200 and 300 KeV. For the simulated case, assuming the scattering angle is 180◦, the energy
of the scattered photon will be:
Eγ0 = 2.223
1 + (1−cos(π))×2.223/0.511 = 0.229 MeV (2.5)
G: X-ray fluorescence peaks X-ray fluorescence peaks usually incorporate a small number of peaks clustered together, and are formed in the medium surrounding the
detector. When energetic photons interact with the atoms of the materials surrounding
the detector, the atoms may become excited. When they de-excite, characteristic X-ray
photons are emitted. When such an X-ray photon reaches the detector and deposits all
its energy to the detector, a pulse signal is formed which contributes to one of the X-ray florescence peaks.
The energies of the X-ray fluorescence peaks are related to the orbital electron binding
energies of the material surrounding the detector, and are usually less than 100 KeV.
H: X-ray escape peaks When energetic photons deposit energy inside the detector, the detector atoms may also be excited, and de-excite by emitting characteristic X-ray
photons. When an X-ray photon escapes the detector without depositing its energy, the
total energy deposited in the detector by the incident source photon while missing a small
portion. The pulse signals formed contribute to one of a few X-ray escape peaks near
Energy resolution
Energy resolution characterizes how well a detector can resolve energy peaks close to
each other. For scintillation detectors, the energy peaks are Gaussian peaks, and can be
described by the normal distribution
f(E|µ, σ2) = √ 1
2πσ2exp
−(E−µ)2
2σ2 (2.6)
whereE is the energy,µis the peak centroid, andσ is the standard deviation. σ has the
same units as energy, and is a commonly used quantity to characterize the width of the
peak. Another commonly used quantity is the full width at half maximum, or ‘FWHM’,
which is the width of the peak at half of the amplitude of the peak. By definition, there
is
FWHM≈2.355σ (2.7)
The most frequently used quantity to characterize the energy resolution of the detector
is the quotient of the FWHM of a peak divided by the centroid of the peak, i.e.
R= FWHM
µ ≈2.355 σ
µ (2.8)
R is a unitless quantity, and is oftentimes presented as a percent.
Visually, a detector with better energy resolution would give narrower peaks.
Physi-cally, the energy resolution is related to the number of information carriers a detector can
generate per unit energy deposition. For scintillation detectors, such as LaBr3 or NaI,
this translates to the number of visible light photons emitted inside the crystal per unit
photon energy deposited. According to data released by Saint-Gobain, a well-known
scintillation crystal manufacture, the LaBr3 crystal emits 63 visible light photons per
KeVγ absorbed, whereas the NaI crystal emits only 38 photons per KeV γ absorbed[17]. This agrees with the fact that LaBr3 has better resolution.
Even for the same scintillation detector, the energy resolution is not the same for peaks
of different energies. The reason is that higher energy photons deposit more energy in
the crystal, and therefore generate more visible light photons. According to Poisson
statistics, more visible light photons will result in wider peaks with better resolution;
that is, for higher energy photons, FWHM will be greater, µwill also be greater, and the
when the resolution of a detector is quantified with only one parameter, this parameter
refers to the energy resolution at 662 KeV, which is the gamma energy of the137Cs source.
As the energy resolution is also a function of photon energy deposition, it is of practical
interest to characterize how the resolution changes, usually for simulation purposes. In
MCNP, arguably the most frequently used general purposes Monte Carlo simulation
program, the embedded photon transport theories do not consider the scintillation process
and the subsequent photo-multiplication process. Therefore, by relying on the simulation
of the physics, only spectra like Figure 2.8 can be calculated. To make the energy
deposition spectra more realistic, a separate subroutine that broadens the spectra is
needed. In MCNP, this module is called ‘Gaussian Energy Broadening’, or ‘GEB’ for short. GEB randomizes the amount of energy a source photon eventually deposits inside
the detector by sampling a Gaussian distribution. This distribution is characterized by
E which equals the energy deposition without GEB, as well as an FWHM whose value
is calculated by
FWHM = a+b√E+cE2 (2.9)
In Equation 2.9,E is the energy of the energy deposited without GEB, anda,b, andcare
all empirical parameters. The net effect of this randomization is very close to broadening
each tally bin of the infinite resolution F8 spectrum by convoluting the value of that bin
by a FWHM, calculated by Equation 2.9, where the energy E corresponds to the center of the bin.
In 2012, Wang and Gardner[18] found it was also possible to further simplify this
relation to an exponential expression, i.e.,
FWHM =d·Ee (2.10)
where d and e are both empirical parameters.
To realistically broaden a simulated energy spectrum using either Equation 2.9 or
Equation 2.10, the empirical parameters should first be determined by taking multiple
measurements using the desired detector, after which the measured peak widths are fitted
with the corresponding model to calculate the values of the parameters. Figure 2.9 shows
an example of such a process. In the figure, each black dot represents the FWHM of a
full energy peak measured using a LaBr3 detector. These data points are then gathered
can describe the FWHM vs energy relation with good accuracy.
Figure 2.9 FWHM fitted to Equation 2.9 and Equation 2.10 respectively. The measure-ments are made using a LaBr3 detector.
Figure 2.10 shows a comparison of the MCNP F8 tally results, as shown in Figure
2.8, broadened using MCNP GEB card, with parameters derived from Figure 2.9.
2.3
Data Sources
Data for neutron capture gammas are relatively abundant. A publication by IAEA titled
‘Database of Prompt Gamma Rays from Slow Neutron Capture for Elemental
Analy-sis’[19] is a good reference for looking up capture gammas for individual isotopes. Other
sources for capture gamma rays include a nuclear data table by Reedy and Frankel[20],
and the widely used ‘Evaluated Nuclear Structure Data File’, or more frequently referred to as ‘ENSDF’[21]. Brookhaven National Laboratory National Nuclear Data Center
(NNDC) hosts an online system for parsing the raw ENSDF data file to more readable
reports. Information regarding (n, γ) of a specific isotope can be easily searched by
Figure 2.10 Energy spectrum as shown in Figure 2.8 broadened using realistic broadening parameters.
Spectra for neutron inelastic scattering can be found from a comprehensive book
compiled by a Soviet and Iraqi joint research team, titled ‘Atlas of Gamma-ray Spectra
from the Inelastic Scattering of Reactor Fast Neutrons’[22]. Gamma data from this
book are based on experiments, and some of the weak peaks may be missing. For more
comprehensive list of inelastic gammas, a nuclear data search system called ‘NuDat’
hosted by Brookhaven National Laboratory NNDC can be very helpful. Figure 2.1 is generated using NuDat. Alternatively, inelastic gammas can also be acquired from the
ENSDF search system hosted by NNDC, by searching for ‘Adopted Levels’ of the target
nucleus.
As for neutron reaction cross sections, the Evaluated Nuclear Data File (ENDF)[14] is
very comprehensive and is also widely applied. Brookhaven National Laboratory National
Nuclear Data Center hosts a very usable system for online ENDF data retrieval and
visualization. Notice that the cross section data included in the original ENDF database
are temperature independent, and need further processing to broaden the resonance peaks
the resonance peaks and linearizing the data points. Dr. Cullen also maintains a database,
called POINT. This database is essentially identical to ENDF database, but have all the
neutron reaction cross sections linearized and broadened at a few temperatures already.
Thus, for simpler programming purposes, POINT is much more useful than ENDF. The
most recent version of POINT at the time this document is composed, is POINT 2015,
and is hosted by IAEA. Cross sections in Figure 2.2 are extracted from POINT 2015
database.
Data for photon interactions can be found from at least two reliable sources. One
is a database called ‘the Evaluated Photon Data Library, 97 version’[24], which is more
comprehensive and includes not only cross sections, but also other relevant data for secondary particles. For simpler applications, the National Institute of Standards and
Technology (NIST) also maintains a good system called XCOM[25]. XCOM is both a
database of photon reaction cross sections, and a computer code, available online and for
downloading, to calculate the cross sections for compounds and mixtures. Cross sections
Chapter 3
Spectral Acquisition and
Preprocessing
3.1
Spectral acquisition
For each new sample, spectra measurement is the first step of analysis. By utilizing the
pulsed neutron generator (PNG), three spectra are measured alternately at high speed:
burst spectrum, capture spectrum, and background spectrum.
3.1.1
Neutron source
The usage of PNG is one of the most distinguishing features of advanced neutron nuclear
logging tools, such as the Tool itself. A D-T neutron source exerts high voltage and
accelerates deuterium (21H) and/or tritium (31H) toward a solid target which contains
tritium and/or deuterium. When the kinetic energy of the incident ion is high enough,
it may overcome the Coulomb barrier of the target nucleus, and undergoes a fusion
reaction[26]
2 1H +
3 1H→
4 2He +
1
0n + 17.586 MeV
The total energy emission of the reaction is 17.586 MeV, and is distributed between the
α particle and the neutron. The neutron eventually gains a kinetic energy of 14 MeV.
The principle of operation of a D-T source makes it a favorable neutron source for
formation elemental analysis in at least three ways:
accelerated to initiate the fusion reaction makes it much safer than the traditional
chemical neutron sources, such as 252Cf or 241Am-Be. The neutron emission of a
D-T generator will automatically stop once the high voltage is cut off. This is
impossible for chemical sources.
2. Another type of fusion reaction, D-D reaction, can also produce energetic neutrons.
But the neutron yield is orders of magnitude lower than that of D-T reaction[27].
In addition, the energy of the D-T source neutron is 14 MeV, but the energy of
D-D neutron is only 2.5 MeV. Higher energy neutrons are advantageous in the sense
that they induce more inelastic scattering gammas with higher reaction threshold energies to be emitted.
3. As the generator is a controllable source and can be turned on and off, alternating
the operating status allows measurements of both an inelastic gamma spectrum
and a capture gamma spectrum. Some elements can only be found practically in
one of the two spectra. For example, H can only be found in the capture spectrum,
and O can only be found in the inelastic spectrum. Some other elements, such
as Si, is fairly observable in both spectra. The target isotopes emitting different
characteristic gammas in these two different types of neutron reactions allow the
elements to be measured and analyzed with a different strategy.
3.1.2
Measuring spectra
In order to take a measurement, the control unit instructs the PNG to emit neutrons
intermittently, and also coordinates the detector to make measurements accordingly. The
timing sequence of neutron emission and data acquisition is called a ‘firing sequence’, or
sometimes ‘firing scheme’. Each tool may have a different firing sequence. But at the
very least, to take advantage of the pulsed generator, the firing sequence should allow
the detector to take three different measurements:
1. Burst spectrum: photon energy spectrum taken when the neutron generator is
steadily emitting fast neutrons. A burst spectrum is also sometimes referred to as
a ‘total spectrum’, since it includes both capture and inelastic gamma rays.
2. Capture spectrum: photon energy spectrum taken when the neutron generator
decreasing.
3. Background spectrum: photon energy spectrum taken when the neutron generator
has been deactivated long enough and it can be considered that prompt gammas
are no longer generated.
The Tool has a complex firing sequence. Each sequence is 50 ms long, and is divided
into three periods:
Period 1 is 45 ms long, and constitutes 225 cycles of a 200 µs long sub-cycle. In each sub-cycle, the neutron generator is activated in the first 60 µs, and then deactivated. The counts detected between 20 µs to 60 µs are counted towards the
burst spectrum. The counts detected between 70µs to 200µs are counted towards
the capture spectrum.
Period 2 is 2 ms long. Counts detected during Period 2 are used for the macroscopic neutron capture cross section (also known as ‘sigma’ in the oil industry) calculation,
and are not used for spectral analysis.
Period 3 is 3 ms long. Counts detected during Period 3 are considered as background radiation. The background spectrum will be subtracted from the measured burst spectrum and the measured capture spectrum to form the background-free burst
and capture spectra.
Figure 3.1 illustrates the whole cycle graphically. Notice that to show the repetition
of the neutron emission sub-cycles, the abscissa is not drawn to scale. Each yellow block
between 0 ms to 45 ms represents one sub-cycle of Period 1, the green block represents
Period 2, and the purple block represents Period 3. Figure 3.2 is an example of a count
rate time spectrum of a experiment measurement. The sample was a large tank filled with
water. The figure shows the time spectrum of one single sub-cycle of Period 1, averaged
over the entire measurement period, which was approximately 20 minutes. This figure corresponds to one single yellow block in Figure 3.1.
In Figure 3.2, the generator is activated at time 0 µs. In the first 20 µs, the neutron
output and the photon counting rate are both rapidly increasing. During this time, the
detector only takes counts, but does not generate a spectrum. From approximately 20
Figure 3.1 Firing sequence of the Tool. The yellow blocks represent the neutron emission sub-cycles of Period 1, the green block represents Period 2, and the purple block represent Period 3.
by the smaller yellow block are histogrammed to form the burst spectrum. The burst
spectrum includes capture gammas, inelastic gammas, and background gammas. The
background spectrum includes gamma rays from neutron activation as well as natural
background.
After 60 µs, the neutron generator is cut off. Between 60 µs to 70 µs, the output of
the generator rapidly drops to 0, and the fast neutrons that are already in the formation
are thermalized. Similar to the first 20µs, the detector records counts only, but they are
not included in the energy spectrum.
From 70µs to 200µs, which is the end of the current sub-cycle, the neutron generator
remains deactivated. The neutrons that are already in the formation are below the lowest (n, n’γ) reaction threshold. These neutrons lose energy by elastic scattering reactions,
and are gradually absorbed through neutron capture reactions. During this period, the
detector actively takes counts and collects a spectrum, called ‘capture spectrum’.
Gam-mas of the spectrum come from (n, γ) reactions as well as the background.
For each sample, the firing sequence is repeated until the predesignated measurement
time is reached.
3.2
Noticeable spectral features
By the end of the measurement stage, three raw gamma energy spectra are generated.
Figure 3.3 shows a typical water tank measurement in raw counts, and Figure 3.4 shows
the same measured spectra in count rates.
In Figure 3.4, there are a few features worth mentioning:
1. A: Hydrogen peak at 2.223 MeV. More specifically, the peak is the hydrogen (n,
γ) peak. The hydrogen peak is almost always present in the burst spectrum and the capture spectrum, because there is almost always liquid in the borehole, and
usually there is water or hydrocarbon in the pores of the rocks. In addition, as
the (n, γ) cross section of hydrogen is 0.332 barn at 0.0253 eV, which is fairly high
comparing to other common elements in the formation. Thus the hydrogen peak
is usually the most pronounced peak in both the capture and the burst spectrum.
By specification, the energy range of a standard energy spectrum of the Tool is
defined in a way such that the hydrogen peak is centered at the 65th channel.
Figure 3.3 Unprocessed gamma spectra of a water tank measurement shown in raw counts.
adjusts the gain settings of the signal amplifier to make sure the hydrogen peak is
aligned.
2. B: Oxygen peak at 6.129 MeV. In realistic measurements, the oxygen peak is almost
always observable in the burst spectrum, and is usually present in the background
spectrum. However, the counts that contribute to the oxygen peak come from two different sources.
In the burst spectrum, most of the oxygen peak counts come from (n, n’γ) reaction
with 16O isotope. After the reaction, excited 16O nucleus de-excites by emitting gammas, and 6.129 MeV gamma is the most intense one.
Another source of the oxygen peak is oxygen activation delayed gamma. Above 10.2 MeV, the 16O nucleus can undergo (n, p) reaction, and produce 16N, that is
16
O + n−→ 16N + p
16
N is a radioactive isotope with a half-life of 7.13 s. It decays by emitting β− and
becomes 16O again. After the β− decay, the 16O nucleus is in excited state, and
de-excites by emitting gammas, which is the same as the (n, n’γ) reaction gammas. Figure 3.5 shows the probability of the (n, p) reaction at high energy region. It
can be seen that the (n, p) reaction of 16O is only possible above 10 MeV, and
the maximum probability is about 6.5%. Figure 3.6 shows the decay scheme of 16N and the energies levels of 16O and the gamma energies. The most intense 16O
de-excitation gamma is 6.129 MeV, and is de-excitation from the second level down
to the ground level.
Similar to the oxygen activation peak, another commonly seen neutron activation
delayed gamma peak is the 28Al decay peak, as shown in Figure 3.7. 28Al is a
radioactive isotope with a half-life of 2.24 minutes. 2813Al decays to excited 2814Si by
emitting β− particle. The excited 28Si subsequently de-excites by emitting a 1.779
MeV gamma. The decay scheme is shown in Figure 3.8. This 28Al decay peak also has two sources: 28Si activation and 27Al activation.
As shown in Figure 3.9, at higher energy range,2814Si has a relatively high probability
of undergoing (n, p) reaction and produce 2813Al, that is,
18
Figure 3.5 (n, p) reaction ratio of 16O. Data from ENDF data files.
When the sample has abundant Si to be activated, the 28Al decay peak is usually present in the spectrum.
Alternatively, the 28Al isotope can also be produced by 27Al(n, γ)28Al reaction.
Aluminum is generally not as abundant as Si in the rocks, but still can be significant,
such as granite which has about 7% Al by weight. As a somewhat extreme example, Figure 3.10 shows the background spectrum of a large cubic aluminum block sample.
3. C1 and C2: Natural lanthanum element itself has a low radioactivity. Natural La
element constitutes 99.911% stable 139La, and 0.089% radioactive 138La, which has
a half-life of 1.05×10¹¹ years. The hump marked by ‘C1’ and the peak marked by
‘C2’ in Figure 3.4 correspond to radiations originate from inside the detector.
For 34.5% of the probability, 13857La decays to excited 13858Ce through β− emission,
as shown in Figure 3.11. The decay product subsequently de-excites to ground
state by emitting a 0.789 MeV gamma. When the de-excitation gamma escapes
the detector without depositing energy, the only energy deposition is the decay
electron, with an end point of 255 KeV[28]. On a standard energy spectrum of
Figure 3.7 Background spectrum of a sandstone measurement.
Figure 3.9 (n, p) reaction ratio of 28Si. Data from ENDF data files.
usually not observable due to lower level discriminator settings. When both the
de-excitation 0.789 MeV gamma and the decay electron are absorbed by the detector,
a hump feature, marked by ‘C1’ in Figure 3.4 is formed. The left edge of the hump
corresponds to the energy of the gamma, which is 0.789 MeV, and the hump ranges
from 0.789 MeV to approximately 1.044 MeV, as a result of both the gamma and
the electron depositing their energies in coincidence.
Figure 3.11 13857La β− decays to 13858Ce. The branching ratio is 34.4%. Data from ENSDF data files.
For 65.6% of the probability,13857La decays to excited13856Ba through electron capture,
as shown in Figure 3.12. The decay product subsequently de-excites to ground state
by emitting a 1.436 MeV gamma. At the same time, as an electron is absorbed by the 138La nucleus, the lower orbital electron vacancy has to be filled by upper
orbital electron. The exact process how the electron vacancy is refilled is not
unique, and involves X-ray emission, Auger electron emission, or combinations of
both. Previous research[29] indicated that the energy of the emitted X-ray photon
is on average either 35.5 KeV or 4.5 KeV, depending on the orbit the electron
was in before being captured. The peak marked by ‘C2’ in Figure 3.4 is actually
two peaks convolved. They correspond to 1.440 MeV, which is the sum peak of
the 138Ba de-excitation and the 4.5 KeV X-ray, and 1.471 MeV, which is the sum
Figure 3.12 13857La electron capture decays to 13856Ba. The branching ratio is 65.6%. Data from ENSDF data files.
usually shows as one slightly wider peak.
3.3
Spectra preprocessing
After the three raw spectra are acquired, two spectral preprocessing are required
be-fore entering the spectral elemental analysis stage. They are alignment and background subtraction
3.3.1
Alignment
Several factors may affect the gain settings, or scale, of the energy spectra. The factors
include temperature, count rate, power supply stability, etc. Although significant gain
shifting is not likely, small variations always exist. Figure 3.13 shows a comparison of the
raw, unprocessed capture spectra of two separate measurements of a water tank.
Mis-alignment can be clearly observed in the figure, especially around the oxygen activation
peak.
To maintain a consistent measurement and analysis, by specification, the Tool defines
that the energy spectra should have 256 channels, ranging from 0 eV to 8.823 MeV, such
Figure 3.13 Unprocessed capture spectra of two separate water tank measurements. 2216A and 2216B are measurement IDs.
1. The firmware on the Tool actively searches for the hydrogen peak during
measure-ment, and adjusts the amplifier gain setting to maintain the hydrogen’s centroid.
2. After the spectra are measured, the processing code also searches for specific
ele-mental characteristic peaks, which are scattered over the entire range of the spectra, and then realigns the spectra.
To perform the spectra alignment, two algorithms are needed: peak search and
spec-tral rebinning.
Peak search
A peak search algorithm primarily estimates the centroid of a peak within specified
channel range of a spectrum. Optionally, the algorithm can also estimate the amplitude of the peak and the background. Currently there are two methods implemented.
1. Differentiation method. This method first applies two filters to adjust the shape of
The first filter to be applied is a Gaussian filter to smooth the spectrum. The filter
to be convoluted with the measured spectrum is shown in Figure 3.14. The FWHM
of the filter is 4.43. Take the water tank measurement shown in Figure 3.13 as an
example. Figure 3.15 shows what the spectrum looks like after the Gaussian filter
is applied to the raw capture spectrum. Notice that the entire spectrum is much
smoother, and the peaks are broadened. As the primary purpose is only to find the
centroids of the peaks, limited broadening does not affect the results.
Figure 3.14 The Gaussian filter used for smoothing the measurement spectrum. The FWHM≈4.43.
The second filter to be applied is a background removal filter to make the peaks more
pronounced. Here the ‘background’ does not refer to the radiation background.
Instead, this background removal filter treats the spectrum as a series of pulses,
and removes the positive component of the signal by applying the removal filter
shown in Figure 3.16. After the filter is applied, the sum of counts of the entire
spectrum is 0. Figure 3.17 shows a comparison of the raw measurement and the
Figure 3.15 Comparison of the raw capture spectrum of water tank measurement (2216A) and after the Gaussian filter is applied.
that as the processed spectrum has both positive and negative signals, so that
logarithm ordinate can no longer be used. Due to the amplitude, the shape of
the processed spectrum between channel 130 to channel 190, corresponding to the
oxygen activation peaks, is not clearly visible. Figure 3.18 shows the details by
zooming to channel 130 to 190, which clearly shows three peaks.
Finally, the spectrum is differentiated, and a typical differentiation method is used
to identify the centroids of the peaks. Figure 3.19 shows how the shape of the
spectrum changes after each filter is applied, and how the oxygen activation peak
and its escape peaks are identified using this algorithm. The dashed lines mark the
centroids of the peaks identified using differentiation method. The centroids of the
three peaks shown in the figure in channels are: 143.20, 156.83, 170.72.
2. Peak fitting method. It is known that the gamma peaks measured by
scintilla-tion detectors are Gaussian peaks[30][31]. To correctly estimate the centroid and amplitude of the peak itself, accounting for the background, a small portion of
the spectrum, near the vicinity of the peak of interest, can be fitted to a model.
cu-Figure 3.16 The background removal filter used for removing the positive component of the spectrum.
Figure 3.18 Figure 3.17 zoomed to channel 130 to channel 190 to show the details.
bic polynomial background term would generate satisfactory results in most cases.
Mathematically, the model is
y(x) = √A
2πσ2 exp
−(x−µ)2
2σ2 +c
0+c1x+c2x2 +c3x3 (3.2)
where,xis the independent variable, and for this particular fitting, is always 0.5 or
a positive integer plus 0.5, y is the number of counts in the (x+ 0.5)th channel, A
is a coefficient proportional to the amplitude of the peak, µ is the centroid of the
peak, σ is the standard deviation of the peak, c0, c1,c2, and c3 are the polynomial coefficients.
Equation 3.2 may be difficult to fit using typical nonlinear fitting method, because
there are 7 parameters in largely different magnitudes. A fitting code based on
Equation 3.2 and an improved linear-nonlinear joint fitting method, which will be
elaborated in Chapter 4, has been developed and solves the problem nicely.
As an example, use the capture spectrum of the water tank measurement 2216A
again, but take the gamma counts instead of the count rate, use the portion from
channel 163 to channel 184, and fit to Equation 3.2. The fitting shows the centroid
of the peak is 170.71, which is almost identical to that estimated by the
differ-entiation method (170.72). In addition, the fitting also shows the value of the A
parameter, which is proportional to the amplitude of the peak, is 3348, and the
standard deviation of the peak is 1.61. The overall reduced χ2 of the fitting is
1.22, which indicates a good fit. The fitted peak, background, and measurement are shown in Figure 3.20.
Both the differentiation method and the fitting method can be used for estimating
properties of peaks, but they are not interchangeable. The differentiation method can both identify peaks and estimating the centroids of the peaks it identifies. In addition,
it has no requirements on the shapes of the peaks, or in other words, the differentiation
methods estimates the local maximum only. This is especially helpful when the centroid
of a convolved peak is of interest. For example, the 138La peak, which is actually two
peaks convolved, with the 1.471 MeV peak slightly higher. The fitting method, on the
other hand, would have difficulties fitting peaks which are not clean.. It will not estimate
the centroid of the 138La 1.471 MeV peak correctly. Neither can the fitting method be
Figure 3.20 Oxygen peak of the capture spectrum of the water tank measurement fitted to Equation 3.2.
estimate the amplitude of the peak, which can be helpful in spectral analyzing during
the development phase. The elemental standard generation work introduced in Chapter
4 relies on the peak fitting to a great extent.
Rebinning algorithm
Rebinning, or sometimes also referred to as gain shifting or alignment, is a very typical
spectrum adjustment operation, which numerically contracts, expands, and/or shifts the
energy spectrum. Rebinning is characterized by two parameters, the multiplicative factor
M, and the additive factor A. M > 1 is analogous to tuning up the gain setting of the amplifier when taking the measurement, which expands the spectrum, and thus the
energy range after rebinning is narrower. M < 1 means the spectrum is contracted,
and thus the energy range after rebinning is wider. A > 0 means the entire spectrum is
shifted towards the higher energy side (right) as a whole, andA <0 means the spectrum
is shifted towards the low energy side.
By definition, a spectrum measured by the Tool has 256 channels. The specification
also defines a continuous real axis spanning from 0 to 256, such that, theithchannel spans