International Journal of Research
Available at https://edupediapublications.org/journalsp-I SSN: 2 3 4 8 -6 8 4 8 e-I SSN: 2 3 4 8 -7 9 5 X Vol ume 0 3 I s s ue 1 8
Dec ember 2 0 1 6
Revealed a spot in the setting with optimized specifically measuring
fluorescence microscope images
1. A STHA PURA M A PA RNA ,2. M r.P.V.VA RA PRA SA D RA O
1PG Scholar, Department of ECE, SLC's Institute of Engineering and Technology, Piglipur Village, Hayathnagar
Mandal, Near Ramoji Film City, Ranga Reddy District, Hyderabad, Telangana
2Assosciate Professor, Department of ECE, SLC's Institute of Engineering and Technology, Piglipur Village, Hayathnagar
Mandal, Near Ramoji Film City, Ranga Reddy District, Hyderabad, Telangana
Abstract—Accurately detecting subcellular particles in fluorescence microscopy is of primary interest for further quantitative analysis such as counting, tracking, or classification. Our primary goal is to segment vesicles likely to share nearly the same size in fluorescence microscopy images. Our method termed adaptive thresholding of Laplacian of Gaussian (LoG) images with autoselected scale (ATLAS) automatically selects the optimal scale corresponding to the most frequent spot size in the image. Four criteria are proposed and compared to determine the optimal scale in a scale-space framework. Then, the segmentation stage amounts to thresholding the LoG of the intensity image. In contrast to other methods, the threshold is locally adapted given a probability of false alarm (PFA) specified by the user for the whole set of images to be processed. The local threshold is automatically derived from the PFA value and local image statistics
estimated in a window whose size is not a critical parameter. We also propose a new data set for benchmarking, consisting of six collections of one hundred images each, which exploits backgrounds extracted from real microscopy images. We have carried out an extensive comparative evaluation on several data sets with ground-truth, which
demonstrates that ATLAS outperforms
existing methods. ATLAS does not need any fine parameter tuning and requires very low computation time. Convincing results are also reported on real total internal reflection fluorescence microscopy images.
I. INTRODUCTION
subcellular particles in fluorescence microscopy is indeed of central interest for further quantitative analysis as thesis grant was partly supported by Brittany Council. The associate editor coordinating the review of this manuscript and approving it for publication was Prof. Jan Sijbers. Color versions of one or more of the figures in this paper are available
Fig. 1. Cell images depicting particles of similar scale. (a, b) Tagged vesicles (bright spots) are of almost constant size over the image. Rab11 is tagged with mCherry in (a), (b) TfR is tagged with
pHluorin in (b).
particle counting particle pattern
recognition particle tracking or dynamics classification All thesesubcellular analyses require a reliable, accurate and efficient
detection of particles in fluorescence
microscopy images. Our goal is to segment exocytotic vesicles in cell images acquired in total internal reflection fluorescence
microscopy (TIRFM). Among fluorescence microscopy image modalities, TIRFM is the
perfect tool to investigate processes
occurring close to or at the cell surface such as endocytosis and exocytosis processes]. The physical size of exocytotic vesicles spans across a limited range. Given the limited depth of field (DOF) of TIRFM, the variation of the scale of these fluorescently labeled objects in the 2D images is also limited.
In this paper, we will focus on M10 cell images showing the cargo proteins Langerin and Transferrin receptor (TfR) tagged with pHluorin, or the Rab11 GTPase tagged with mCherry. These proteins are associated to transport intermediates such as vesicles recycling to the cell surface and appearing as bright spots, which can be round or elongated, as depicted in Fig. 1. Another application of the presented method could be
the identification, detection and
quantification of adhesion molecular
complexes, in cells migrating or not. These biological architectures are relatively small and regular at the single cell, composed of multiple molecular partners.
framework with automatic scale selection and local adaptive thresholding. Our method exploits the Laplacian of Gaussian (LoG) of
the intensity image and automatically
detects the characteristic scale of the objects of interest. To cope with inhomogeneous background, thresholding is adapted to local image statistics, while a single probability of false alarm (PFA) is set for the whole image or even the collection of images to be processed. The local image statistics are estimated in a Gaussian window, whose size has a very low impact on the detection
performance, as demonstrated in the
experimental results. In short, we will automatically infer from image data the optimal value of the critical parameters usually left to the user guidance in other methods, that is, LoG scale and detection threshold. We name ATLAS (Adaptive Thresholding of LoG images with Auto-selected Scale) the method described in this paper. ATLAS comprises several significant improvements and extensions compared to the preliminary method SLT-LoG we introduced in :
• We now resort to a discrete filter for the scale-space representation which allows us to deal with any arbitrary scale, i.e., with scales of any precision;
• We have designed four original scale selection criteria;
• We have produced and made publicly available a new benchmark dataset for spot detection methods;
• We have conducted an extended
comparative evaluation with existing
methods on several datasets, and we have evaluated our method on a larger range of real images.
While our primary goal is to detect exocytic vesicles in 2D TIRFM images, the ATLAS method can be applied to other types of images as well, provided objects to be detected are of similar size in the image or of a couple of sizes at most. Comparisons of spot detection methods were reported In and providing with a broad overview of stateof- the-art methods. Nevertheless, the dataset used in these two previous comparative works remains limited in terms of content and challenges. Indeed, real TIRFM images are far more complex than images of this dataset, specifically, the signal-to-noise ratio (SNR) is generally lower in real images and objects to be detected are smaller and often darker. We have constructed a new dataset with ground truth exploiting backgrounds
extracted from real TIRFM image
simulators designed in and We have thus quantitatively evaluated our method and compared it with other methods on a total of four datasets. The remainder of the paper is structured as follows.
II. RELATED WORK
In the authors provide a broad panorama of spot detection methods, and thoroughly evaluate the performance of a dozen methods. As explained by Smal et al. [17], the common detection framework consists in first denoising the image and enhancing the spots to be detected. Then, highest (or lowest) values of the enhanced signal, corresponding to spots, are extracted. The simplest way of detecting spots in a gray level image is to threshold the image intensities from the intensity histogram. The
threshold value can be automatically
selected by techniques such as Otsu’s method or entropy minimization. However, a single global threshold cannot tackle
complex images where variation in
background intensities may exceed spot intensity magnitude. Therefore, numerous space-varying thresholding methods were proposed In particular, local threshold values are deduced from local statistics to detect cell nuclei in More advanced methods, such as detectors based on top-hat (TH) or LoG filter as in the SEF (Spot
consists, for every point, in multiplying the wavelet coefficients of different scales to reveal correlations across the scales. From a given wavelet scale, spots respond more strongly to IUWT than uncorrelated noise. For low SNRs, however, noise has a higher response than spots at smallest scales, inducing wrong detections. Hence, smallest scales – up to a characteristic scale – must be discarded to lower the false detection rate. The WMP map is finally thresholded to get the binary detection map. The multiscale variance stabilizing transform (MS-VST) method relies on variance stabilization to rule out insignificant coefficients of the IUWT Then, the image is reconstructed without taking into account the coarsest scale, corresponding to the background
structures, nor the smallest ones
corresponding to noise. The spots are finally detected by thresholding the reconstructed image. Therefore, with both IUWT-based methods, the set of wavelet scales must be chosen accordingly to the spot size. Finally, h-dome (HD) methods detect local maxima, called domes, in a LoG- or Gaussian-filtered image. The kernel must be chosen smaller than the spots. Peaks of the filtered image with an amplitude greater than a given height h (hence, the name of the
method) are extracted. The so-built “dome map” comprises small domes corresponding to noise, domes corresponding to spots, and large domes corresponding to background structures. To discard irrelevant large and
small domes, samples are generated
according to the domes map seen as an importance sampling function.
Domes containing too few samples are removed since they probably correspond to noise. Domes where samples are too scattered are also removed, because they probably correspond to large background structures. Thus, the maximum dome size must be carefully set. However, the objects to detect do not often have the same magnitude h, so that the method sometimes merges very bright neighboring spots, and sometimes misses less bright spots. To tackle this problem,
Rezatofighi et al. [34] proposed a method called maximum possible height dome (MPHD) for locally detecting the best height threshold h. Then, the norm of the spatial image gradient is thresholded, which is more robust to strong background variations than
directly thresholding intensity. Two
supervised detection methods were also involved in the comparative study reported
based on classical machine learning
fluorescence microscopy sequences, the statistics of the image may vary in time (e.g., due to photo-bleaching), so that one threshold should be set for each image according to its intensity range. Obviously, this approach is not applicable
to sequences containing hundreds of frames, or to datasets containing images of various dynamic ranges. In contrast, as described in we propose a locally adapted threshold automatically inferred from local intensity statistics.
The user on his/her side only fixes once for all a PFA value which can be used for all the images of the conducted experiment.
III. ADAPTIVE SEGMENTATION A. Local Threshold
Once the object scale is determined, we can proceed to vesicle segmentation in the acquired fluorescence microscopy images. Since the scale selection step relies on LoG, it is natural to detect vesicles based on this particular filter. Furthermore, it has been shown in [8] that LoG is close to the optimal filter in applications like ours, that is
detecting subresolved objects in
fluorescence microscopy images. As
explained, our goal is to extract the lowest values of the selected LoG map Hf (·, s_). When the background is complex or the image exhibits large contrast variations, the
use of a global threshold τ is not satisfactory, as illustrated in Fig.. Instead, we propose to locally infer a threshold τ (p)
for every point p ∈ _ from local image
Let us point out that we need to compute −1 only once.
The local thresholding can thus
automatically adapt to the local image statistics, while the PFA setting does not depend on the image intensity range. As a consequence, the spot detection is not affected by photobleaching when processing fluorescence microscopy image sequences. Indeed, the PFA is a parameter which is not directly related to the image properties but to the desired performance of the algorithm. Thus, it can be set once for all for a whole set of images in a given experiment
IV. EXPERIMENTAL RESULTS
We have compared ATLAS to state-of-the-art spot detection methods in a wide variety
of cases. Comparative quantitative
evaluation was carried out on several datasets with groundtruth. The first dataset is generated with the Synthetic Data Generator ImageJ plugin introduced Twelve methods were compared on this dataset, which is (to our knowledge) the most complete comparison of spot detection methods to date, but the images remain somewhat too artificial and too simple. As mentioned in the Introduction section, we have conducted comparative experiments on three other datasets involving more complex contents with the most competitive
detection methods, namely MS-VST,
MPHD, HD and C-CRAFT. First,
Boulanger et al. [19] and
Rezatofighi et al. proposed particle
dynamics simulators, referred in the sequel as Traffic simulator and TIRFM simulator, respectively. The Traffic simulator was used in to evaluate the performance of several methods. Secondly, we have constructed another image dataset named
Spot in M10 where image backgrounds are extracted from real TIRFM images. As stated in
A. Performance Measures
ATLAS delivers a binary detection map. In order to evaluate the performance of the method and compare it to other ones, we compute the centroid of every segmented connected component, resulting in a set of locations {δ}. Then, following
an object ω of the ground-truth is correctly detected if and only if:
(1) its nearest neighbor δ in the set of detected centroids is closer than 4 pixels away, and
parameter setting. As in compute the true positive ratio TPR = NTP/(NTP + NFN) and the modified false positive ratio FPR* = NFP/(NTP + NFN). The value of TPR when FPR* = 0.01 is denoted TPR* and is used to compare methods. Moreover, to compare ATLAS with the detection methods tested in, namely HD, MS-VST and C-CRAFT, we compute the precision Prec = NTP/(NTP + NFP) and recall Rec = NTP/(NTP + NFN). Varying the threshold parameter for the existing methods or the PFA value for ATLAS, we can plot the free-response receiver-operator characteristic (FROC), that is the TPR-versus-FPR* curve, and the precision-versusrecall curve. That way, the behaviors of the methods can be evaluated more thoroughly. Additionally, we compute the area under the FROC curve as a performance score over a wide range of thresholds or PFA values. We also resort to the F-measure defined by the harmonic mean of precision and recall F = 2Prec.Rec/(Prec+Rec), and more precisely to the best reachable F-measure F*.
B. Synthetic Data Generator
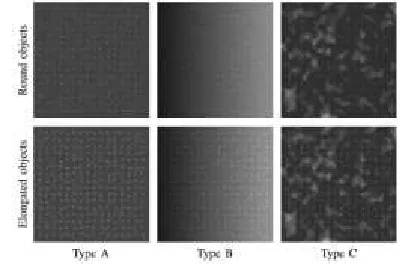
In twelve methods are evaluated over six image sets of 16 images each. They are depicted in Fig.. Two object shapes are considered: isotropic Gaussian spots of standard deviation 2 pixels, and elliptic
Gaussian spots of standard deviations 5 and 2 pixels along the two principal axes, respectively. Three types of background are generated: uniform intensity (type A), horizontal intensity gradient (type B), and large random structures (type C). A Poisson noise is added
Fig. Sample images from the Synthetic Data Generator benchmark for SNR = 2. Types are defined in the main text.
V. CONCLUSION
We have proposed a novel and efficient vesicle segmentation method called ATLAS which involves an automatic scale selection and a local threshold setting. It is dedicated to situations where most of the visible structures share about the same size in the image. The selected scale can be of any arbitrary precision. After determining the optimal scale, a LoG operator is applied on the images. The segmentation threshold is automatically and locally set according to a
given PFA value. Overall, ATLAS
various datasets, including a new one we
have constructed and made publicly
available for further comparison.
Satisfactory segmentation results on several challenging real TIRFM images have been reported. We have shown that ATLAS is not sensitive to the Gaussian window size in the segmentation step. Moreover, the PFA value is a user-friendly parameter which allows the user to adapt the method to the targeted
detection sensitivity according to the
application needs and the further
exploitation of the detection results. Thus, no specific knowledge is required on the algorithm itself, that is, the method can be used as a black box by someone nonexpert in image processing. We have shown that ATLAS can be successfully applied to different kinds of images. We have also demonstrated that ATLAS can deal with a couple of scales if needed. We will further investigate the detection and exploitation of a wider set of scales if one or two scales are not sufficient to accurately describe the structures of interest. We also plan to apply ATLAS to three-dimensional images.
REFERENCES
[1] M. Chalfie, Y. Tu, G. Euskirchen, W. W. Ward, and D. C. Prasher, “Green fluorescent protein as a marker for gene expression,”
Science, vol. 263, no. 5148, pp. 802–805, 1994.
[2] J. Byun, M. R. Verardo, B. Sumengen, G. P. Lewis, B. S. Manjunath, and S. K. Fisher, “Automated tool for the detection of cell nuclei in digital microscopic images: Application to retinal images,” Molecular Vis., vol. 12, pp. 949–960, Aug. 2006. [3] C. Jackson, E. Glory-Afshar, R. F. Murphy, and J. Kovaˇcevi´c, “Model building and intelligent acquisition with application to protein subcellular location classification,” Bioinformatics, vol. 27, no. 13, pp. 1854–1859, 2011.
[4] I. F. Sbalzarini and P. Koumoutsakos, “Feature point tracking and trajectory analysis for video imaging in cell biology,” J. Structural Biol., vol. 151, no. 2, pp. 182– 195, Aug. 2005.
[5] K. Miura, Tracking Movement in Cell
Biology (Advances in Biochemical
Engineering), vol. 95, J. Rietdorf, Ed. Berlin, Germany: Springer-Verlag, 2005. [6] K. Jaqaman et al., “Robust single-particle tracking in live-cell time-lapse sequences,” Nature Methods, vol. 5, no. 5, pp. 695–702, 2008.
[8] D. Sage, F. R. Neumann, F. Hediger, S. M. Gasser, and M. Unser, “Automatic tracking of individual fluorescence particles: Application to the study of chromosome dynamics,” IEEE Trans. Image Process., vol. 14, no. 9, pp. 1372–1383, Sep. 2005. [9] J. Boulanger, A. Gidon, C. Kervran, and J. Salamero, “A patch-based method for repetitive and transient event detection in fluorescence imaging,” PLoS One, vol. 5, no. 10, p. e13190, Oct. 2010.
[10] L. Sironi, J. Solon, C. Conrad, T. U. Mayer, D. Brunner, and J. Ellenberg, “Automatic quantification of microtubule dynamics enables RNAi-screening of new mitotic spindle regulators,” Cytoskeleton, vol. 68, no. 5, pp. 266–278, May 2011. [11] A. Basset, P. Bouthemy, J. Boulanger, J. Salamero, and C. Kervrann, “Localization and classification of membrane dynamics in TIRF microscopy image sequences,” in Proc. IEEE Int. Symp. Biomed. Imag., Beijing, China, Apr. 2014, pp. 830–833. [12] W. M. Reichert and G. A. Truskey,
“Total internal reflection fluorescence
(TIRF) microscopy. I. Modelling cell contact region fluorescence,” J. Cell Sci., vol. 96, no. 2, pp. 219–230, 1990.
[13] N. Deng, Y. Xu, D. Sun, P. Hua, X. Zheng, and H. Duan, “Image processing for fusion identification between the GLUT4
storage vesicles and the plasma membrane,” J. Signal Process. Syst., vol. 54, nos. 1–3, pp. 115–125, Jan. 2009.
[14] K. Letinic, R. Sebastian, A. Barthel, and D. Toomre, “Deciphering subcellular processes in live imaging datasets via
dynamic probabilistic networks,”
Bioinformatics, vol. 26, no. 16, pp. 2029– 2036,
2010.
[15] J. G. Burchfield, J. A. Lopez, K. Mele, P. Vallotton, and W. E. Hughes, “Exocytotic vesicle behaviour assessed by total internal
reflection fluorescence microscopy,”
Traffic, vol. 11, no. 4, pp. 429–439, Apr. 2010.
[16] A. Basset, J. Boulanger, P. Bouthemy, C. Kervrann, and J. Salamero, “SLT-LoG: A vesicle segmentation method with automatic scale selection and local thresholding applied to TIRF microscopy,” in Proc. IEEE Int. Symp. Biomed. Imag., Beijing, China, Apr. 2014, pp. 533–536.
[17] I. Smal, M. Loog, W. J. Niessen, and E. Meijering, “Quantitative comparison of spot
detection methods in fluorescence
microscopy,” IEEE Trans. Med. Imag., vol. 29, no. 2, pp. 282–301, Feb. 2010.
images,” BMC Bioinformat., vol. 11, no. 1, p. 248, 2010.
[19] J. Boulanger, C. Kervrann, and P. Bouthemy, “A simulation and estimation framework for intracellular dynamics and
trafficking in videomicroscopy and
fluorescence imagery,” Med. Image Anal., vol. 13, no. 1, pp. 132–142, 2009.
[20] S. H. Rezatofighi et al., “A framework for generating realistic synthetic sequences of total internal reflection fluorescence microscopy images,” in Proc. 10th Int. Symp. Biomed. Imag., Apr. 2013, pp. 157–