111
Dynamic Analysis of Multistory Building Using Response
Spectrum Method and Seismic Coefficient Method - A Comparison
Suchi Nag ChoudharyP
1
P
and Dr. P.S BokareP
2
P
1
P
M-Tech Scholar, Department Of Civil Engineering, RSR Rungta College Engineering and Technology, Bhilai, Chhattisgarh,(490024) India
P
2
P
Principal, RSR Rungta College Engineering and Technology Bhilai, Chhattisgarh, (490024) India
ABSTRACT
Frequency of earthquake occurrence has expanded causing extreme harm to human life and property. Consequently need of exact seismic examination of structures emerges. There are various static and dynamic techniques for seismic investigation out of which seismic co-efficient technique and response spectrum method are used in this research. In this paper these techniques are connected for seismic investigation of G+10 multistoried building. Response spectrum analysis of building is carried out using advanced version of software STAAD-PRO-V8i whereas seismic coefficient analysis is done using hand calculation from Codal
formula. Comparative study these earthquake methods are carried out and presented and explained here
.
Keyword: Seismic force analysis, staad-pro-v8i software, response spectrum method, seismic coefficient method.
1.
Introduction
The viable outline and development of seismic tremor safe structures has significantly more prominent significance in this nation because of fast mechanical advancement and grouping of populace in urban areas. Seismic outline methodologies are expressed to guarantee the structure ought to have the capacity to oppose minor and continuous shaking force without managing any harm. Earth endures sudden shaking brought on because of tectonics plate development or volcanic emission and some counterfeit causes as atomic response or blasts these are known as tremors. Different quakes happened in amid past years which brought about awful impact on life of human and economy of living being. These tremors are important to be assessed and computed as to outline new structures uncommonly multistory building. Seismic impact for the most part created because of parallel or flat powers follows up on any structure. In present research, the quake examination of G+10 storied working under zone IV is finished by utilizing two techniques which are Seismic Coefficient Method and Response Spectrum Method. The structure is been composed and dissected utilizing STAAD-PRO-V8i.
2. Literature review
Various literatures are reviewed which are based on study of analysis of seismic forces and its impact effect on living life. Literature review focused on various work done by various authors on analysis of seismic forces under various zones of earthquakes the seismic analysis is performed using various software. Review also explained studies performed to reduce or control seismic effect and its hazardous effect.
112
ETABS and STAAD PRO.Assuming that material property is linear static and dynamic analysis are performed. Base shear value is more in the zone 5 and that in the soft soil in irregular configuration. Story drift value is more in the story 12 in the irregular configuration.[1].Patil et al., 2013, analysed high-rise building using program in STAAD PRO with various condition of lateral stiffness system. Some models are prepared as brace frame and shear wall frame analysis is done with response spectrum method. This analysis produced the effect of higher modes of vibration & actual distribution of forces in elastic range in a better way. Building with short time period tends to suffer higher accelerations but smaller displacement. More accurate values of response may be obtained for buildings by the modal analysis method, using modified design response spectra for inelastic analysis. A significant amount of increase in the lateral stiffness has been observed in all models of brace frame and shear wall frame as compared to bare frame.[2]
Mohan, 2011, compared and studied linear equivalent static analysis performed for regular buildings up to 90m height in zone I and II, dynamic analysis should be performed for regular and irregular buildings in zone IV and V. In present work, two multi stored buildings, one of six and other of eleven stories have been modeled using software package SAP 2000 for earthquake zone V in India. The above studies it can be concluded that equivalent static method can be used effectively for symmetric buildings up to 25 m height. For higher and unsymmetrical buildings response spectrum method should be used.[3]
Literature reviewed presented above explained various different software methods for seismic analysis using response spectrum method those are as SAP-2000, ETAB and STAAD-PRO. However, none of the above literature explains appropriate software method for seismic analysis.
Hence, this work emphasizing analysis effect of seismic forces on G+10 multistoried building using advanced version of STAAD-PRO i.e. STAAD-PRO-V8i.carried on for dynamic analysis for response spectrum method and also method for static analysis for seismic coefficient method is explained.
3. Methodology
SEISMIC ANALYSIS: to calculate equivalent forces on structure the lateral forces are computed by different strategies (methods), seismic coefficient method (SCM), that is static method of analysis which is easy to apply when compared to response spectrum method (RSM) which is dynamic method. For surveying the precision of these two techniques, a relative review for G+10 building has been done in this research using manual calculation and using software STAAD-PRO-V8i.
3.1 Seismic coefficient method:
Seismic coefficient method is a static method to evaluate and design an earthquake resistive structure. Seismic coefficient method considers all horizontal as well as vertical forces for calculation and analysis. [4]
[1] Seismic Base Shear (VRbR):
VRbR= ARhR W
Where,
ARh R= design seismic coefficient at horizontal direction.
W = seismic weight of the building
[2] Natural time period (TRaR):
For reinforced concrete framed building
TRaR=0.075hP
113
For steel framed buildingTRaR=0.085hP
0.75
Where,
h = height of building
Distribution of design forces:
QRi R= VRB
𝑊𝑖ℎ𝑖2 ∑𝑛𝑗=1𝑊𝑖ℎ𝑗2
Where,
QRiR = Design lateral force at floor i,
WRiR = Seismic weight of floor i,
hRiR = Height of floor i measured from base,
n = Number of stores in the building is the number of levels at which the masses are located.
3.2 Response Spectrum Method
Dynamic analysis shall be performed to obtain the design seismic forces and its distribution along the height of the building at different level.
[1] Modal mass (M
RkR): MRkR=
[ ∑ 𝑤𝑖 Ø𝑖𝑘 ]2 𝑔∑𝑤𝑖 Ø𝑖𝑘2
[2] Modal Participation factor (PRkR): PRKR=
∑𝑤𝑖 Ø𝑖𝑘 ∑𝑤𝑖 Ø𝑖𝑘2
[3] Story shear forces in each mode(VRikR): VRikR= ∑ 𝑄𝑖𝑘
𝑛 𝑗=𝑖+1
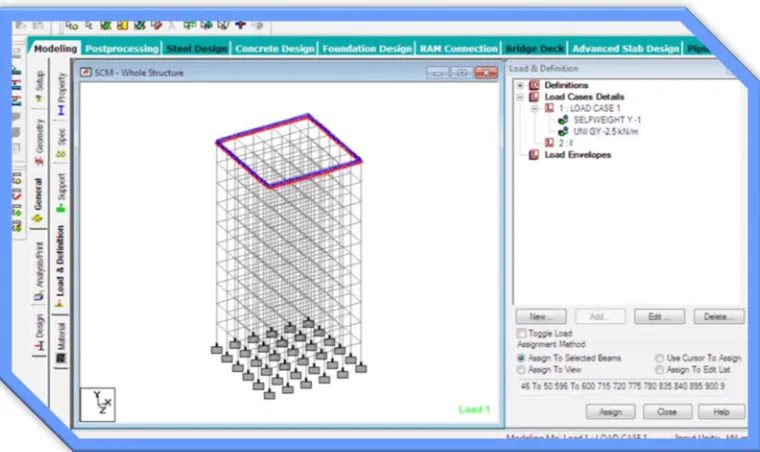
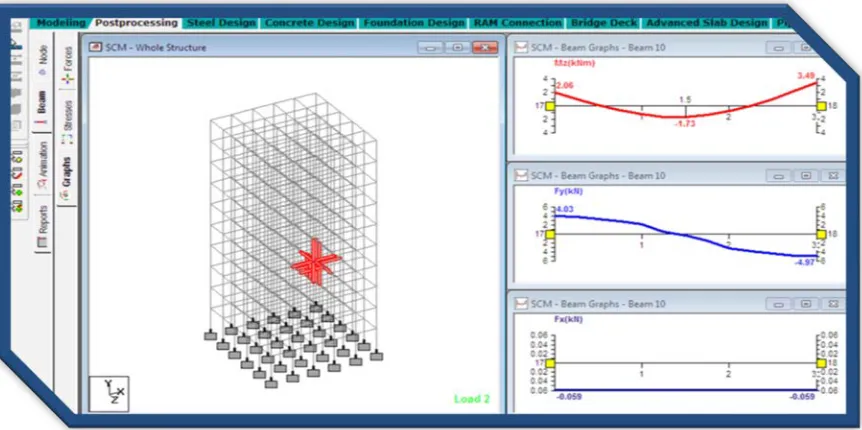
3. ANALYSIS OF STRUCTURE
114
Figure No.1-3D Model of Structure
115
Figure No. 3-Top view of various loading on frame
116
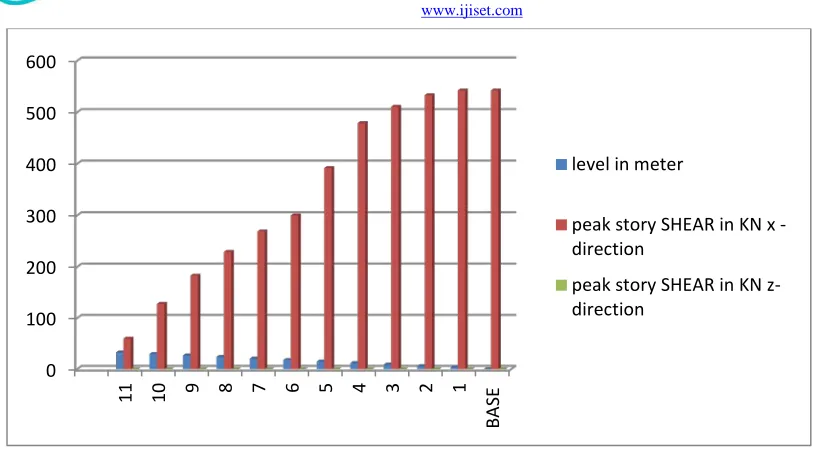
Figure 5. Graphical representation for peak flow
4. RESULTS AND DISSCUSSION
After applying both the methods response spectrum method and seismic coefficient method both the methods on a g+10 multistoried building result is represented using graphs
Table No. 1-FOR PEAK STORY
Story level in meter peak story SHEAR in KN
x - direction z- direction
11 33 60.07 0
10 30 128.12 0
9 27 183.11 0
8 24 229.33 0
7 21 268.75 0
6 18 300.18 0
5 15 391.93 0
4 12 479.26 0
3 9 511.03 0
2 6 533.17 0
1 3 542.5 0
BASE 0 542.5 0
0 100 200 300 400 500 600
11 10 9 8 7 6 5 4 3 2 1
BA
SE
level in meter
peak story SHEAR in KN x -direction
117
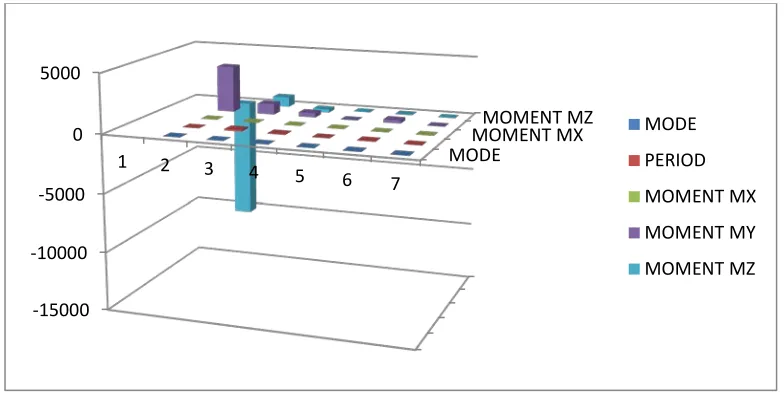
Table No 2-FOR MOMENT
MODE PERIOD MOMENT
MX MY MZ
11 1.265 3942.12 3942.12 3942.12
10 120.17 901.24 901.24 901.24
9 48.14 363.05 363.05 363.05
8 0 0.01 0.01 0.01
7 35.37 265.28 265.28 265.28
6 0 -0.01 -0.01 -0.01
Figure 6. Graphical representation for Moment
Table No 3-FOR BASE SHEAR
MODE MASS PARTICIPATION FACTOR IN % BASE SHEAR IN KN
X Y Z X Y Z
1 82.23 0 0 525.2 0 0
2 8.09 0 0 120.17 0 0
3 3.26 0 0 48.41 0 0
4 0 0 0 0 0 0
5 2.3 0 0 35.37 0 0
MODEMOMENT MX MOMENT MZ
-15000 -10000 -5000 0 5000
1 2 3 4 5
6 7
118
6 0 0 0 0 0 0
Figure 7. Graphical representation for Base shear
5. Conclusion
As talked about before seismic investigation has a prime significance also, it ought to be done all the more exactly. Among the two techniques (RSM and SCM), SCM is a surmised approach as it take seismic load as static and RSM is more exact as it consider dynamic nature of seismic load. However SCM is simple to apply as contrast with RSM. Similar review has demonstrated that SCM indicate direct dissemination of base shear though RSM demonstrates none direct in reality in RSM Base Shear at lower story is higher than SCM.
6. References
[1] Mr. S.Mahesh, M. D. (NOV-DEC 2014). Comparison of analysis and design of regular and irregular configuration of
multi Story building in various seismic zones and various types of soils using ETABS and STAAD. IOSR Journal of Mechanical and Civil Engineering (IOSR-JMCE), 1-8.
[2] Prof. S.S. Patil, M. S. (2013). Seismic Analysis of High-Rise Building by Response Spectrum. International Journal Of
Computational Engineering Research, 1-8.
[3] Mohan, R. (2011). Dynamic Analysis of RCC Buildings with Shear Wall. International Journal of Earth Sciences and
Engineering, 1-5.
[4] Indian Standard CRITERIA FOR EARTHQUAKE RESISTANT DESIGN OF STRUCTURE. (2002). NEW DELHI :
BUREAU OF INDIAN STANDARDS.
0% 20% 40% 60% 80% 100%
X Y Z
X Y
Z MODE
MASS PARTICIPATION
FACTOR IN % BASE SHEAR IN KN