Theses and Dissertations
2017
The Association Of Changes In Cardiorespiratory
Fitness With Changes In Cardiometabolic Risk
Factors
Leanna Marie Ross University of South Carolina
Follow this and additional works at:https://scholarcommons.sc.edu/etd Part of theExercise Science Commons
This Open Access Dissertation is brought to you by Scholar Commons. It has been accepted for inclusion in Theses and Dissertations by an authorized administrator of Scholar Commons. For more information, please [email protected].
Recommended Citation
by
Leanna Marie Ross Bachelor of Science Saint Mary’s College, 2011
Master of Science
University of South Carolina, 2013
Submitted in Partial Fulfillment of the Requirements For the Degree of Doctor of Philosophy in
Exercise Science
The Norman J. Arnold School of Public Health University of South Carolina
2017 Accepted by:
J. Larry Durstine, Major Professor Mark A. Sarzynski, Committee Member
Steven N. Blair, Committee Member Robin P. Shook, Committee Member Clemens Drenowatz, Committee Member
To my Lord and Savior, Jesus Christ, my parents, Charles and Ardeth, my brother, Ryan, and my family and friends who have been a constant source of support, encouragement, and love. 2 Peter 3:18
As I reflect on my time at USC, I am reminded of numerous opportunities that have not only prepared me for my career as a scientist, but also enriched my life as a whole. I am forever grateful for the people that God introduced to my life during this journey who have provided encouragement, support, laughter, kindness, mentorship, and friendship. You all fill a special place in my heart.
association with numerous cardiovascular disease (CVD) risk factors and mortality. As CVD remains the number one cause of death in America, the detrimental effects of low CRF present a substantial health threat. The studies presented in this dissertation syndicate both epidemiologic and clinical data that will enrich the knowledge base regarding the magnitude of change in CRF in relation to CVD risk factors.
Recently, the American Heart Association established a new construct termed ideal cardiovascular health (CVH), which is characterized by seven metrics known as Life’s Simple 7. The concept emphasizes seven positive health factors and behaviors. The promotion of achieving and retaining these metrics at an ideal level serves to improve CVH and decrease public health burden and CVD mortality. This first study of this dissertation found that higher levels of CRF are strongly associated with better CVH profiles, which was demonstrated by individuals with moderate and high CRF exhibiting almost 11 and 40 times greater odds of having average or optimum CVH scores, respectively, compared to low fit individuals. Additionally, longitudinal analyses showed that improvements in CRF over time are associated with significant improvements in CVH score. These findings support the vital role CRF plays in public health efforts aiming to prevent the development of CVD and reduce CVD mortality risk.
Dedication ... iii
Acknowledgements ... iv
Abstract ... v
List of Tables ... viii
List of Figures ... ix
Chapter 1 Overall Introduction ... 1
Chapter 2 General Methodology ... 7
Chapter 3 Literature Review ... 26
Chapter 4 The Association of Cardiorespiratory Fitness and Ideal Cardiovascular Health in the Aerobics Center Longitudinal Study ... 41
Chapter 5 Cardiorespiratory Fitness and Cardiometabolic Disease Risk Factor Responsiveness Following Aerobic Exercise Intervention ... 57
Chapter 6 Overall Discussion ... 81
Table 4.1 Definition of poor, intermediate, and ideal levels for each
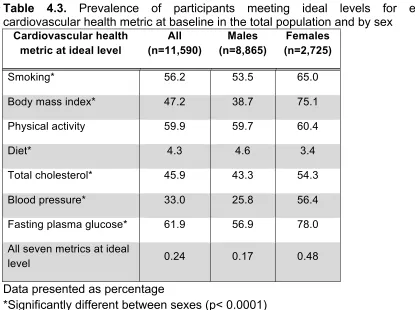
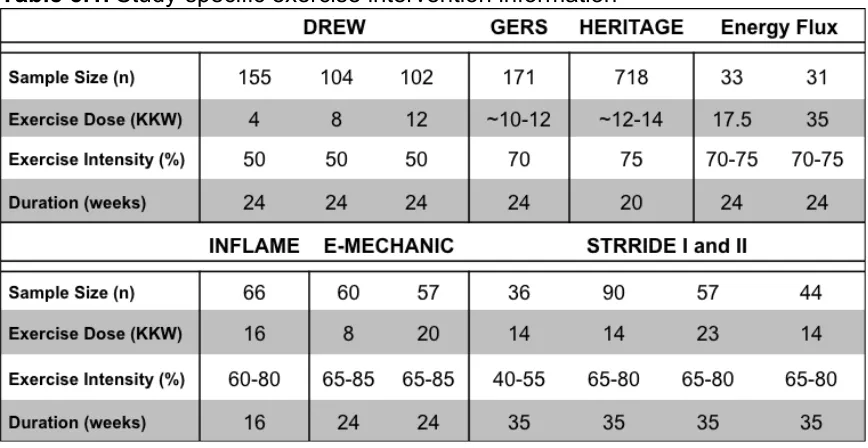
cardiovascular health metric ... 53 Table 4.2 Baseline characteristics by sex ... 53 Table 4.3 Prevalence of participants meeting ideal levels for each cardiovascular health metric at baseline in the total population and by sex ... 54 Table 5.1 Study-specific exercise intervention information ... 73 Table 5.2 Baseline characteristics by study ... 73 Table 5.3a Mean change and prevalence of low response for each
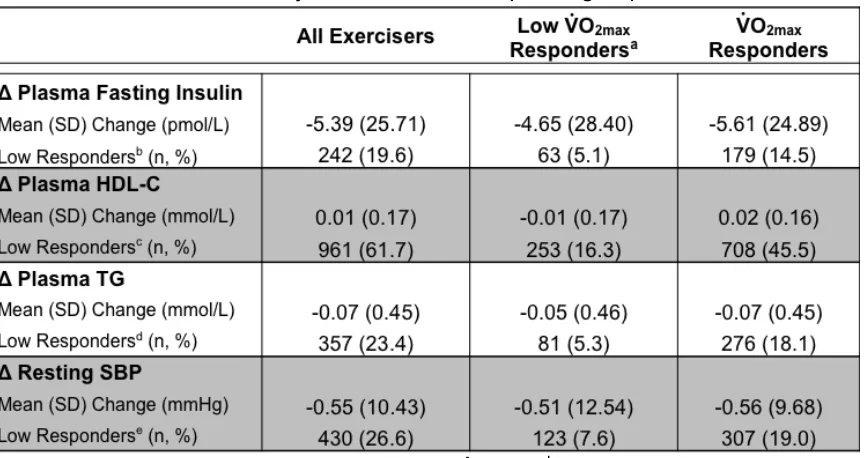
cardiometabolic risk factor by absolute V̇ O2max response group ... 74 Table 5.3b Mean change and prevalence of low response for each
Figure 4.1 Prevalence of inadequate, average, and optimum scores for
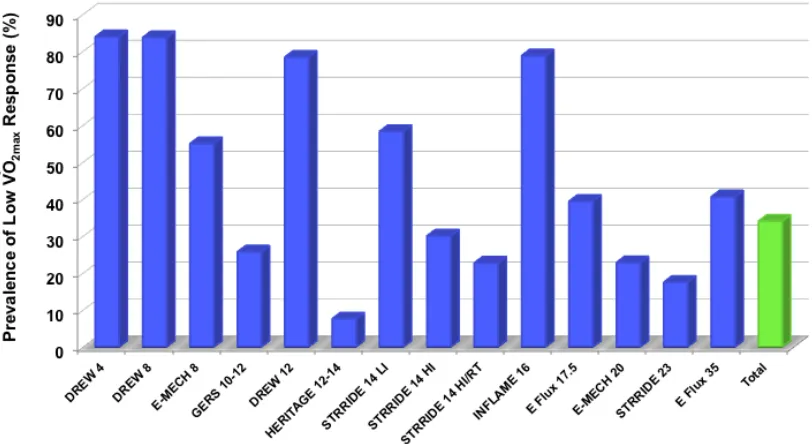
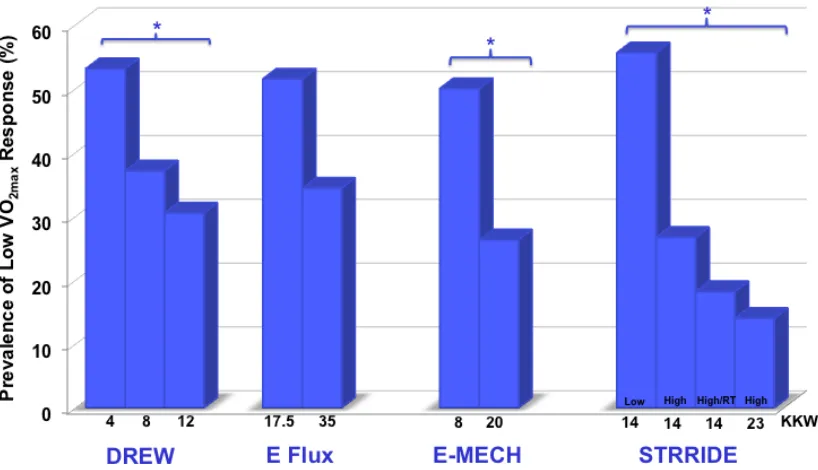
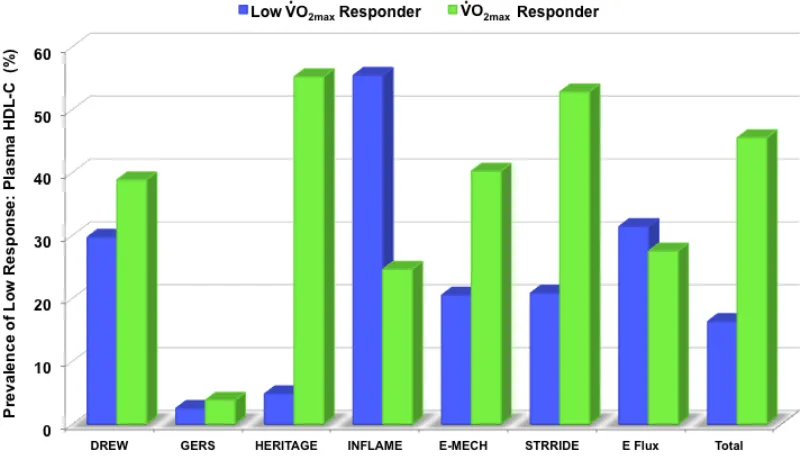
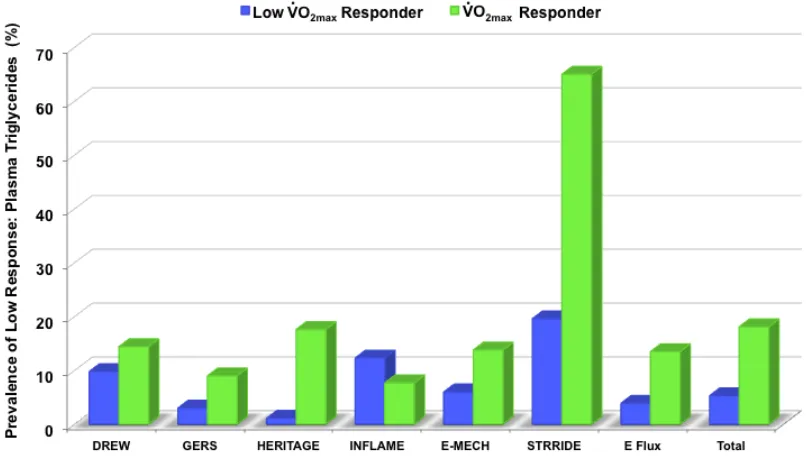
cardiovascular health by baseline fitness category ... 54 Figure 4.2 Average treadmill time in the total population and by sex based on ideal cardiovascular health category ... 55 Figure 4.3 Adjusted odds of being in the average or higher ideal cardiovascular health category by baseline fitness category ... 55 Figure 4.4 Percent change in ideal cardiovascular health score by change in fitness group ... 56 Figure 5.1 Distribution of absolute V̇ O2max training response across studies ... 75 Figure 5.2a Prevalence of low V̇ O2max response based on absolute terms for each exercise intervention ordered by increasing dose of exercise ... 75 Figure 5.2b Prevalence of low V̇ O2max response based on relative terms for each exercise intervention ordered by increasing dose of exercise ... 76 Figure 5.3 Prevalence of low V̇ O2max response based on relative terms for studies employing multiple interventions ordered by increasing dose of exercise ... 76 Figure 5.4a Prevalence of low response for plasma fasting insulin across studies by relative V̇ O2max groups ... 77 Figure 5.4b Prevalence of low response for plasma HDL-C across studies by relative V̇ O2max groups ... 77 Figure 5.4c Prevalence of low response for plasma triglycerides across studies by relative V̇ O2max groups ... 78 Figure 5.4d Prevalence of low response for resting systolic blood pressure
across studies by relative V̇ O2max groups ... 78 Figure 5.5a Distribution of risk factor response score for all exercisers by
Figure 5.6a Distribution of risk factor response score amongst absolute low
OVERALL INTRODUCTION
Cardiorespiratory fitness (CRF) is well established as having a strong inverse association with numerous cardiovascular disease (CVD) risk factors and mortality.1 As CVD remains the number one cause of death in America,2 the detrimental effects of low CRF present a substantial health threat. Recently, the American Heart Association (AHA) launched a new primordial prevention approach called, “Life’s Simple 7” which emphasizes seven positive health factors and behaviors [blood cholesterol, blood pressure (BP), fasting plasma glucose, diet quality, physical activity (PA), smoking, and body mass index (BMI)]. The promotion of achieving and retaining these health metrics at an ideal level serves to improve cardiovascular health (CVH) and decrease public health burden and CVD mortality in the United States (U.S.).3 Despite the strong associations between CRF and each individual component of “Life’s Simple 7,” the associations between CRF and ideal CVH in adults cross-sectionally or longitudinally are currently unknown.
clinically significant gains in CRF with aerobic training (i.e., low VO2max response) is of great interest. The ability to identify individuals who respond unfavorably to an exercise intervention will facilitate adjustment of their exercise prescription to maximize clinically important health adaptations.
The studies of this dissertation syndicated both epidemiologic and clinical data to enrich the knowledge base regarding the magnitude of change in CRF and cardiovascular health markers. The relationship between changes in CRF and changes in ideal CVH profile were established by analyzing data from a large prospective, longitudinal study. Then, data from eight large exercise training studies comprised of 14 different standardized exercise interventions was utilized to assess the prevalence of low V̇ O2max response and determine if V̇ O2max responsiveness is related to concomitant changes in cardiometabolic risk factors. Thus, the purpose of these studies was to 1) identify the relationship between ideal cardiovascular health and CRF both cross-sectionally and longitudinally, 2) ascertain the prevalence of low V̇ O2max response across several standardized aerobic exercise interventions, and 3) identify the relationship between V̇ O2max responsiveness and changes in CVD risk factors across the aforementioned exercise interventions. The following aims were proposed to accomplish these goals.
investigations. This study will provide valuable insight as to whether ideal CVH is associated with CRF and whether improvements in CRF over time are associated with beneficial changes in ideal CVH score.
Objective 1.1: To determine the cross-sectional association of ideal CVH with CRF
Hypothesis 1.1: We hypothesized that higher CRF, as a continuous variable, will be correlated with greater ideal CVH score. We also hypothesized that participants in the moderate to high categories of CRF will have increased odds for being in average or higher ideal CVH categories.
Objective 1.2: To examine the longitudinal association of changes in CRF with changes ideal CVH score
Hypothesis 1.2: We hypothesized that increases in CRF over time are associated with beneficial changes in ideal CVH score.
defined in both absolute and relative terms based on technical error (TE) and coefficient of variation values derived from three repeatability studies in the HERITAGE Study. Results from this aim determined the association between V̇ O2max responsiveness and concomitant changes in cardiometabolic risk factors [resting systolic blood pressure (SBP) and fasting insulin, high-density lipoprotein cholesterol (HDL-C), and triglycerides (TG)]. This enhanced understanding will improve the ability to develop and adjust future exercise programming.
Objective 2.1: To identify cutpoints to define responsiveness of change in V̇ O2max following standardized aerobic exercise interventions
Objective 2.2: To determine the prevalence of low V̇ O2max response across multiple standardized aerobic exercise interventions
Objective 2.3: To examine whether exercise dose and/or intensity is associated with the prevalence of low V̇ O2max response
Hypothesis 2.3: We hypothesized that greater exercise dose and intensity will yield lower prevalence of low V̇ O2max response, with intensity playing a larger role in V̇ O2max responsiveness.
Objective 2.4: To compare differences in changes of cardiometabolic risk factors between V̇ O2max response groups
Hypothesis 2.4: V̇ O2max responders will have greater beneficial changes in cardiometabolic risk factors compared to low V̇ O2max responders.
responses, however we hypothesize that no individual will be a low responder for all traits.
These studies are likely the first to evaluate the relationship between CRF and the AHA’s ideal CVH score in adults. In addition, we will be one of the first to examine whether improving CRF relates to a positive change in ideal CVH score over time. Recent investigations have found that increasing numbers of ideal CVH metrics and scores are associated with more favorable future CVD outcomes.4-16 Thus, our study’s examination of CRF’s association with increasing ideal CVH score will provide meaningful insight for future investigations regarding CRF’s role in public health efforts aiming to prevent the development of CVD.
GENERAL METHODOLOGY
Aim 1
Aim 1 evaluated if ideal cardiovascular health (CVH) as defined by the
AHA’s “Life’s Simple Seven”3 is associated with CRF (Objective 1.1). In addition,
the relationship between changes in CRF and changes in ideal CVH score over
time was examined (Objective 1.2).
Study Design
This study employed both cross-sectional and longitudinal analyses. A
cross-sectional analysis examined if CRF is associated with ideal CVH. A
longitudinal analysis was used to examine the relationship between changes in
CRF and changes in ideal CVH score over time.
To address aim 1, data from the ACLS was utilized. The ACLS is a
prospective observational study of participants who were self-, employer-, or
physician-referred for an extensive medical examination at the Cooper Clinic in
Dallas, Texas. The study investigated the health outcomes associated with
physical activity and CRF levels. All participants received written and oral
informed consent and the ACLS study has been reviewed and approved annually
Study Population
This study included participants from the ACLS who completed at least
two medical examinations by a physician after a 12-hour (hr) overnight fast
between the years of 1987-1999. The medical examination was a complete
preventive medical evaluation including physical examination, personal and
family health history, questionnaires (demographics and health habits),
anthropometry, resting electrocardiography, blood chemistry analyses, blood
pressure, and a maximal exercise treadmill test. Health history questionnaires
included: personal history of myocardial infarction, stroke, hypertension,
diabetes, and cancer; parental history of CVD; smoking status, alcohol intake,
and PA. Participants also completed a 3-day diet recall. Time between
examinations ranged from 12 months to 11 years. Details of the examinations
have been described elsewhere.17 Participants with complete data on CRF and
all of the AHA’s “Life’s simple 7”3 health behaviors and factors (smoking, BMI,
PA, dietary data, blood cholesterol, blood pressure, and fasting plasma glucose)
were included. Participants were excluded if they had any form of CVD or cancer,
or if they had abnormal findings on electrocardiography at baseline.
Measurements
Anthropometrics. Anthropometric measures were taken and BMI was calculated as weight in kilograms divided by height in meters squared. BMI
values were classified as follows: normal (18.5-24.9 kg/m2), overweight
(25.0-29.9 kg/m2), or obese (≥30.0 kg/m2). Resting blood pressure was measured by
accuracy, two measures were taken and if the readings differed by more than 5
mmHg, then a third measure was taken and all the measures were averaged.
Blood samples were taken from the antecubital vein after 15 to 20 minutes (min)
of sitting. Concentrations of total cholesterol and fasting plasma glucose were
measured by automated techniques.18-20
Cardiorespiratory fitness. Maximal treadmill testing using a modified
Balke protocol was used to assess CRF, which was defined as treadmill time in
min, at baseline and during follow-up visits, as previously described.17, 21 Three
CRF groups were created from age- and sex-specific quintiles based on the
previously established cutpoints of treadmill time: low (lowest 20%), moderate
(middle 40%), and high (upper 40%) CRF.17
Change in CRF as a continuous variable was calculated as the difference
in treadmill time between the first two adjunct examinations and divided by the
number of years between them. Annual change in CRF was used to define
change in fitness because the intervals between the follow-up examinations
varied among individuals in our cohort. Annual change in CRF was categorized
by grouping participants into categories of loss, stable, or gain, based on tertiles
of change in CRF. For example, a participant categorized in the low CRF group
at baseline and increased to the moderate CRF group at follow-up would be
categorized as gain in the CRF change groups.
Diet. Participants were asked to keep detailed records of everything they
consumed over two pre-assigned weekdays and one weekend day for the 3-day
portion sizes were given to each participant. Registered dietitians at the Cooper
Clinic coded and analyzed the diet records using the Cooper Clinic Nutrition and
Exercise Evaluation system. Achievement of the AHA diet goals were
categorized as follows: 4.5 or more servings of fruits and vegetables per day, two
or more 3.5 oz. servings per week of fish, shellfish, or other seafood, three or
more servings per day of whole grains, and less than 1500 mg per day of
sodium. Diet scores were assigned by giving a point for each diet goal met (i.e.,
consuming <1500 mg/day of sodium is one point) for a total possible score of
four points.
Physical Activity. Participants completed a formerly validated questionnaire to assess leisure time PA over the past three months, which
included type, frequency, and duration of activity. PA categories were created
based on the responses to 10 specific activities: walking, jogging, running,
treadmill exercise, cycling, stationary cycling, swimming, racquet sports, aerobic
dance, and other sports related activities. The intensity of the activities was
estimated using speed-specific or activity-specific MET values from the
Compendium of Physical Activities.22 MET-min per week (min/wk) were then
calculated by multiplying the MET value for each activity by frequency and
duration. Then, MET-min/wk for all activities was added together. For the present
study, participants were classified into three categories based on the 2008
Physical Activity Guidelines for Americans:23 inactive (0 MET-min/wk), insufficient
AHA Ideal Cardiovascular Health. Ideal CVH was determined by assessing the presence of seven positive health factors and behaviors that include: abstinence from smoking within the past year, ideal body mass index, physical activity at goal levels, consumption of a dietary pattern that promotes cardiovascular health, untreated total cholesterol (<200 mg/dL), untreated blood pressure (<120/80 mmHg), and the absence of diabetes mellitus and clinical CVD.3 Each of these ideal CVH metrics will be classified as poor (value of 0), intermediate (1) or ideal (2). Ideal CVH was calculated by summing the scores across all seven categories, with each poor metric receiving no points, each intermediate metric receiving one point, and each ideal metric receiving two points. Participants’ were categorized based on their total ideal CVH score out of 14 possible points as follows: inadequate (0-4 points), average (5-9 points), and optimum (10-14 points).
Change in total ideal CVH score as a discrete variable was calculated as the difference in total ideal CVH score between the first two adjunct examinations, and divided by the number of years between them. Change in total ideal CVH score was categorized by grouping participants into categories of loss, stable, or gain, based on tertiles of change as described above for change in CRF categories.
Data Analysis
general linear and logistic regression models were used to evaluate the association of baseline CRF with baseline ideal CVH score and to estimate the odds of being in the average or optimum ideal CVH categories by baseline CRF categories, respectively. These cross-sectional analyses controlled for age, sex, and year of examination.
To investigate the longitudinal association between changes in CRF and changes in ideal CVH, we employed linear regression models adjusting for age, sex, and time between exam dates. Separate models that included CRF and ideal CVH as either continuous or categorical variables were used. All models were performed in the total population and stratified by sex (removing sex as covariate in model).
SAS version 9.4 was used for all statistical analyses. The threshold for statistical significance was set at the p<0.05 level.
Aim 2
Aim 2 established cutpoints in order to define responsiveness for change
in V̇ O2max following standardized aerobic exercise interventions (Objective 2.1). Using this definition, assessment of the prevalence of low V̇ O2max response across 14 large, standardized aerobic exercise interventions was completed (Objective 2.2). Furthermore, aim 2 examined whether exercise dose, intensity, and/or program duration is associated with the prevalence of low V̇ O2max response (Objective 2.3). Subsequently, Aim 2 investigated the relationship
exercise interventions. This aim compared the difference of changes in
cardiometabolic risk factors between V̇ O2max response groups (Objective 2.4).
Additionally, this aim explored the distribution of low responses across all traits
via a total risk factor response score (Objective 2.5).
Study Design
This study employed both cross-sectional and longitudinal designs to
analyze data from previously completed experimental trials. A longitudinal design
was used to determine participants’ change in V̇ O2max from baseline to post
aerobic exercise intervention. Two cutpoints were applied to the V̇ O2max change scores in order to define low V̇ O2max response in both absolute and relative terms. Subsequently, these created categories of V̇ O2max responsiveness were used in a cross-sectional analysis in order to determine the prevalence of low V̇ O2max response for each intervention and determine if V̇ O2max responsiveness is related to concomitant changes in cardiometabolic risk factors. To address aim 2,
data from 14 completed aerobic exercise interventions from eight of the largest
exercise training studies was utilized.
Study Population
The present study examined data from 14 distinct supervised exercise
interventions (n=1,724) from the following completed exercise training studies:
Health, Risk Factors, Exercise Training And Genetics Family Study (HERITAGE),
Dose-Response to Exercise in Women (DREW), Gene Exercise Research Study
(GERS), Energy Flux, Examination of Mechanisms of Exercise-induced Weight
Studies of a Targeted Risk Reduction Intervention through Defined Exercise
(STRRIDE) I and II. These interventions provide a diverse array of populations,
standardized exercise programs, and baseline fitness levels. Overall, these
exercise interventions ranged from doses of 4-35 kcal·kg-1·week-1 (KKW);
intensities of 50-85% V̇ O2max; and durations of 20-35 weeks. All participants from these exercise training studies received written and oral informed consent. The
studies were all reviewed and approved by each institution’s Institutional Review
Board.
Exercise Training Study Protocols
DREW. The DREW Study was a randomized controlled dose-response
exercise trial. The present study sample will include 361 previously sedentary,
postmenopausal women (63% White) with a BMI of 25-40 kg/m2, resting systolic
blood pressure of 120-159 mmHg, and resting diastolic blood pressure ≤99
mmHg who completed one of three 24-week aerobic exercise programs. The
three exercise programs expended 4 (n=155), 8 (n=104), or 12 (n=102) kcal per
kg of body weight per week (KKW). All participants alternated training sessions
on a cycle ergometer or treadmill with a target intensity of 50% V̇ O2max. Exercise training sessions were completed three to four times per week.24
GERS. The GERS sample will include 171 previously sedentary,
non-diabetic, non-smoking men and women (56%) aged 50-71 years (73% White).
Participants had no history of CVD, were normotensive or had
medication-controlled blood pressure, and had a BMI <37 kg/m2. The exercise training
Participants used various types of aerobic exercise equipment including cycle
ergometers, treadmills, rowers, and elliptical, skier, and stepping machines.25 Exercise training progressed to a target exercise intensity of 70% V̇ O2max.26, 27
HERITAGE. The HERITAGE sample included 718 (66% White) men and
women (56%) aged 17-65 years who completed a 20-week endurance exercise
program. Participants were sedentary at baseline, normotensive to untreated
mildly hypertensive (<160/100), and body mass index (BMI) was less than 40.0
kg/m2. The exercise program consisted of aerobic exercise performed three days per week on a cycle ergometer. Training progressed to a target exercise intensity of 75% V̇ O2max.28
Energy Flux. The Energy Flux Study was a randomized controlled
exercise trial. The present study sample will include 65 men and women (46%)
aged 21-45 years (48% White) who completed one of two 24-week aerobic
exercise interventions. Participants were previously sedentary, generally healthy
adults with a BMI of 25-35 kg/m2. The two exercise intervention programs expended 17.5 (n=33) or 35 (n=32) KKW. Training progressed to target exercise
intensity 70-75% maximal heart rate (HR) (based on most recent maximal
exercise test). All exercise was performed on a treadmill 3-6 times per week.
INFLAME. The INFLAME sample will include 66 previously sedentary,
generally healthy, non-smoking men and women (65%) who completed a
16-week aerobic exercise intervention. Participants (65% White) were aged 30-75
Exercise training expended 16 KKW at a target exercise intensity 60-80%
V̇ O2max. Exercise was performed on either a treadmill or cycle ergometer 3-5 times per week.29
E-MECHANIC. E-MECHANIC was a six-month randomized controlled
exercise trial. The sample to be used for the present study includes 117 men and
women (72%) who completed one of two aerobic exercise interventions.
Participants (68% White) were non-smoking, generally healthy, previously
sedentary adults (aged 18-65 years) with a BMI of 25-45 kg/m2. The two exercise
groups expended 8 (n=60) or 20 (n=57) KKW for 24 weeks. All exercise was
performed on a treadmill at a target intensity of 65-85% V̇ O2max. Exercise sessions were completed 3-5 times per week.30
STRRIDE. The STRRIDE I and II studies were randomized controlled
exercise trials lasting for eight months. The present study sample includes 227
(83% White) non-smoking men and women (50%) who completed one of four
exercise training interventions. Participants were free of diabetes and coronary
artery disease, aged 40-65 years with a BMI 25-35 kg/m2, resting blood pressure
<160/90 mmHg, and mild-to-moderate dyslipidemia [low-density lipoprotein
cholesterol (LDL-C) 130-190 mg/dL and/or HDL-C 40mg/dL (men) or 45 mg/dL
(women)]. Combining STRRIDE I and II, participants completed one of four
8-12 repetitions per set; n=44). Aerobic exercise was performed three times per week on treadmills, elliptical machines, or cycle ergometers.31, 32
Study-Specific Measurements
DREW. Full details of the DREW study design and methods are available elsewhere.24 The DREW Study participants completed laboratory and self-report measures at baseline and six months. Measures included: V̇ O2max, resting BP, anthropometry, dietary habits, PA history, medication use, menstrual history, personal and family medical history, and fasting cholesterol, TG, and glucose. V̇ O2max was assessed via two maximal cycle ergometer tests on separate days at baseline and follow-up. Participants practiced on the cycle ergometer during the initial baseline medical assessment. Prior to exercise testing, resting electrocardiography (ECG), heart rate (HR), and BP were measured. Participants exercised at 30 Watts (W) for 2 min, 50 W for 4 min, followed by increases of 20 W every 2 min until exhaustion. Throughout the test, BP, HR, ECG, V̇ O2, carbon dioxide (CO2) production, ventilation and respiratory exchange ratio (RER) were measured. Respiratory gases were measured using a ParvoMedics True Max 2400 metabolic measurement cart (Sandy, UT). Two fitness tests were performed on separate days at baseline and follow-up. The average V̇ O2max from these two tests was used as V̇ O2max.
At baseline and follow-up, blood samples were obtained via an antecubital
vein following a 10-12 hr fast. Fasting blood glucose concentration and blood
lipid profiles were determined with a Dimension RXL analyzer (Oxford, CT).
Additionally, plasma insulin was measured by electrochemiluminescence.
GERS. Full details of the GERS study design and methods are available
elsewhere.26, 27 Study measurements included medical history, fasting blood
samples (genotyping and plasma lipids), glucose tolerance testing, physical and
cardiovascular examination by a physician, and maximal exercise testing at
baseline and post-training. V̇ O2max was assessed via Bruce maximal treadmill exercise testing.33 HR, BP, and ECG results were recorded prior to the start of
the test, at the end of each exercise stage, and after completion of the test. V̇ O2 was measured continuously and directly throughout the test using a customized
metabolic system (Marquette Respiratory Mass Spectrometer, Rayfield Mixing
Chamber, VMM Ventilatory Turbine).
Participants were fasted and sat quietly in the laboratory for 15 min prior to
resting BP measurements were obtained. BP was measured while the
participants were seated with their arm at heart level. Two measurement values
had to agree within ± 5 mmHg. Averages from two days of BP measures were
used to determine resting BP.
Blood samples were obtained in the morning following an overnight fast.
For plasma lipid levels, blood samples were taken on two separate days and
averaged. At least three days before exercise training began, blood samples
Post-training samples were obtained 24-36 hr after the participant’s final exercise
training session. Plasma insulin levels were determined via radioimmunoassay
(Linco Research, St. Charles, MO). Plasma HDL-C levels were measured after
precipitation with dextran sulfate on a CDC-certified Hitachi 717 analyzer.
HERITAGE. Full details of the HERITAGE study design and methods are
reported elsewhere.28 Participant measures included: blood samples (plasma
lipids, glucose, insulin, sex steroids, glucocorticoids), body fat and fat distribution,
dietary and activity habits (questionnaires), several genetic analyses, and two
maximal exercise tests at baseline and follow-up. These two tests were
conducted at approximately the same time of day with at least 48 hrs between
the two tests. All maximal exercise tests were performed on a cycle ergometer
and included the following measures: ventilatory rate (V̇ E), V̇ O2, volume of carbon
dioxide expired (V̇ CO2), RER, BP, HR, cardiac output, stroke volume, and blood variables (glucose, free-fatty acids, lactate, and total proteins).
Respiratory gases were measured by using a SensorMedics 2900 metabolic cart.
The average V̇ O2max from the two tests was calculated and recorded as V̇ O2max for each subject given that both values were within 5% of each other. If V̇ O2max from the two tests differed by more than 5%, the higher V̇ O2max value was used.
Following a 5-min rest period, resting BP was measured using an
automated blood pressure unit (Colin STBP-780; San Antonio, TX). At 2-min
intervals, four readings were taken. Resting BP was recorded as the mean of
Blood samples were obtained from venipuncture of an antecubital vein
into vacutainer tubes containing EDTA. Blood draws were performed in the
morning following a 12-hr fast. Blood samples were collected twice at baseline on
separate days. Post-training blood samples were taken at 24 and 72 hr after the
final training session. Samples were obtained early in the follicular phase of the
menstrual cycle for eumenorrheic women. Total cholesterol and TG levels were
determined in plasma and lipoproteins by enzymatic methods (Technicon
RA-500 Analyzer; Bayer Corporation Inc., Tarrytown, NY). HDL-C fractions were
obtained after precipitation of LDL in the infranatant via the heparin manganese
chloride method. Fasting plasma insulin samples were obtained at baseline as
well as one and three days after the final exercise bout. Plasma insulin (i.e.,
immunoreactive insulin) was measured by radioimmunoassay following
polyethylene glycol separation.
Energy Flux. Full details of the Energy Flux Study design and methods
are in submission. Measurements of body composition, energy expenditure,
resting metabolic rate, peak oxygen consumption (V̇ O2peak), dietary intake (four day diet recall), blood chemistry (glucose, leptin, grehlin, C-reactive protein,
apolipoprotein B, β-hydroxybutyrate, a lipid panel), and several questionnaires
regarding health behavior, current mood status, and overall health were
completed at baseline, three and six months. V̇ O2peak was assessed on a treadmill using a modified Bruce protocol with ECG. This exercise test consisted
of two-minute stages in which the participants worked to volitional fatigue, as
recorded during the last 30 seconds (s) of each stage. Expired gases were
collected continuously via a stationary metabolic system (True One 2400,
ParvoMedics, Sandy, UT) to determine V̇ O2peak. Participants in both exercise groups performed a second fitness test at the end of the four-week run-in period
to adjust exercise intensity due to potential acute training adaptations.
Resting BP was measured using a sphygmomanometer and stethoscope
while the participant was sitting quietly. At least two measurements were taken to
be within 10 mmHg for systolic BP and within 5 mmHg for diastolic BP. The
average of the measurements was recorded as resting BP.
Following a 12-hr fast and 24-hr abstention from physical activity, blood
samples were obtained at baseline, 3-months, and 6-months (post-intervention).
Blood samples were obtained from an antecubital vein into tubes containing
EDTA. Samples were stored at -80°C and sent in entirety to LabCorp (Columbia,
SC) for fasting HDL-C, TG, and insulin analysis upon completion of the study.
INFLAME. Full details of the INFLAME design and methods can be
obtained elsewhere.29 Study measurements were completed at baseline and
post-training and included the following: anthropometrics, blood chemistry
(C-reactive protein, lipids, fasting glucose, and insulin), BP, CRF, and energy intake.
Fitness testing was performed on a cycle ergometer with ECG. Participants
cycled at 30 W for 2 min, 50 W for 4 min, and subsequent increases of 20 W
every 2 min until participants could no longer maintain a pedal cadence of 50
were recorded. Respiratory gases were measured using a ParvoMedics’
TrueOne 2400 (Sandy, UT) Metabolic Measurement Cart.35
At least four BP measurements were performed after a 30-min recumbent
rest period using an automated blood pressure unit (Colin STBP-780). Each
measurement was separated by 2 min.
Throughout the trial, blood samples were taken at three separate visits: 3
ml at the orientation session, 20 ml at baseline (approximately two weeks later),
and 20 ml at the 4-month follow-up assessment. Participants were fasted for
10-12 hr for each of the blood samples. Additionally, participants refrained from
consuming alcohol or exercising for 24 hr and acutely refrained from using
aspirin or anti-inflammatory medications for 48 hr prior to blood samples being
obtained. Plasma insulin was measured by electrochemiluminescence. Fasting
blood glucose concentration and blood lipid profiles were measured with a
Dimension RXL analyzer.
E-MECHANIC. Details of the E-MECHANIC study design and methods are available elsewhere.30 Primary assessments for this study occurred at
baseline and post-training (24 weeks), and also utilized a truncated assessment
period at week 4 to identify potential short- term changes in outcome variables.
Participant assessments included anthropometrics, body composition, energy
metabolism, physical activity (including V̇ O2max), and blood chemistry. V̇ O2peak was determined by a graded treadmill exercise test. Treadmill speed began at
2.4 mph on a level grade for two min. Treadmill speed and/or grade increased
caloric expenditure rate was measured during exercise training with a metabolic
cart. At least two resting BP measurements were taken after the participant
rested in a seated position for at least five min.
STRRIDE. For the STRRIDE (i.e., STRRIDE I) and STRRIDE AT/RT (i.e.,
STRRIDE II) studies, full details of study design and methods are available
elsewhere.31, 32, 36 Study measurements included anthropometrics, BP, blood
chemistry (carbohydrate and lipid metabolism), food intake, Metabolic Syndrome
z score, and cardiorespiratory fitness at baseline and post-training.31 Additionally
in STRRIDE II, overall strength was measured.32 To assess V̇ O2peak, maximal cardiopulmonary exercise tests with ECG and expired gas analysis were
performed on a treadmill. Expired gases were measured using a ParvoMedics’
TrueMax 2400 Metabolic Cart (Sandy, UT). The protocol consisted of 2-min
stages, increasing the work rate by approximately 1 MET per stage. The V̇ O2 for the last 40 s of each state were averaged to determine V̇ O2peak.
For STRRIDE I, resting BP was measured in the standing position just
prior to maximal exercise testing. For STRRIDE II, resting BP was taken every 20
min during the last hr of the 3-hr intravenous glucose tolerance test (GTT).
Values were averaged to obtain resting BP.
Fasted blood samples were taken at baseline and post-intervention
approximately 30-min prior to the start of the GTT. In regards to
post-intervention, blood samples were obtained 16-24 hr after the final exercise
training session. Blood samples were taken into EDTA tubes from an intravenous
inter-assay variability, pre- and post-intervention plasma samples from the same
subject were analyzed together. Fasting insulin was measured by immunoassay (Access Immunoassay System, Beckman Coulter, Fullerton, CA). Fasting HDL-C and TG concentrations were estimated with NMR spectroscopy (LipoScience,
Raleigh, NC). Data Analysis
In order to quantify low V̇ O2max responsiveness, we applied the findings of Skinner et al.’s report regarding the reproducibility of V̇ O2max measured from maximal exercise testing in HERITAGE to the additional aerobic exercise
interventions.37 Based on technical error (TE) and coefficient of variation values derived from this study, low V̇ O2max response was defined in both absolute (gain <120 ml/min from baseline value) and relative (gain <5% of study-specific
baseline average V̇ O2max) terms. Subsequently, the prevalence of low V̇ O2max response across interventions was calculated based on both the absolute and
relative definitions. We used within-study group comparisons to compare the
relative low V̇ O2max responsiveness within studies that employed multiple exercise interventions.
Based on previous literature from HERITAGE,37-42 low response for each cardiometabolic trait following exercise training was defined as any change value
beyond 1xTE in a direction indicating a worsening of the risk factor was considered a low response. Baseline characteristics were summarized for the
calculations. For each of the cardiometabolic risk factors, a logistic regression
was performed to compare the distribution of low response between V̇ O2max response groups.
A total response score for all of the cardiometabolic risk factors was
calculated for each participant. Each risk factor classified as a low response
received no points, while each risk factor classified as a response received one
point. Thus, a participant that did not display any low responses would receive
four total points for their cardiometabolic risk factor score. A Χ2 test was
performed to compare the distribution of the total response score between
CHAPTER 3
LITERATURE REVIEW
Cardiorespiratory fitness
CRF is defined as the ability of the circulatory, respiratory, and muscular
systems to supply oxygen to the body in order to perform physical work. Since
CRF integrates numerous systems in the body, CRF quantifies the functional
capacity of an individual and reflects total body health. CRF can be measured
directly via maximal exercise tests and is expressed as V̇ O2max. Although less precise, estimated CRF can be easily derived from the peak work rate achieved
on a treadmill or cycle ergometer. Estimated CRF is commonly expressed in
terms of metabolic equivalents (METs; a multiple of the resting metabolic rate
approximating 3.5 mL·kg−1·min−1).
Cardiorespiratory fitness and mortality risk
Whether estimated or measured directly, mounting evidence has
developed over the past 30 years establishing a strong inverse relationship
between CRF and risk for CVD and all-cause mortality.17, 43, 44 Additionally, low
levels of CRF are associated with higher mortality rates attributable to several
cancers, especially colon and breast cancers.45 Moreover, mortality risk is
notably reduced as CRF improves.46 In a recent scientific statement from the
terms of survival benefit per MET. Collectively, these studies showed that each
1-MET increment in CRF, which is a small, relatively attainable increment in
fitness, was associated with a 10-25% improvement in survival.47 Furthermore,
mortality risk reduction has even been shown to decrease by as much as 30% in
low fit individuals (peak MET level <5) with CVD who improved exercise capacity
following cardiac rehabilitation participation.48
Recently, Naci and Ioannidis published a network meta-analysis to
compare the effectiveness of exercise and pharmaceutical drug intervention on
mortality risk.49 This study included 16 meta-analyses (12 drug and four exercise)
along with three additional recent exercise trials, which collectively totaled 305
randomized controlled trials (n=339,274). This analysis examined the benefits of
exercise on the secondary prevention of coronary heart disease, treatment of
heart failure, diabetes prevention, and stroke rehabilitation. This study did not
find a statistical difference between exercise and pharmaceutical interventions in
terms of mortality benefits for secondary prevention of coronary heart disease
and diabetes. The results also showed that exercise and physical activity
interventions were actually more effective than pharmaceutical interventions for
the secondary prevention of stroke mortality. The authors noted that evidence
from randomized controlled trials regarding mortality benefits from exercise
intervention is scarce, especially when compared to the pharmaceutical
intervention evidence (only 57 out of 305 trials were exercise interventions).
that exercise and drug interventions are potentially similar in effectiveness for
mortality benefits.49
Cardiorespiratory fitness and cardiovascular disease risk
Several recent studies have shown the prominent role that CRF plays as a
predictor of adverse CVH outcomes (e.g., acute myocardial infarction, ischemic
heart disease, and CVD mortality). Compared to traditional risk factors, such as
hypertension (HTN), insulin resistance, lipid abnormalities, smoking, and obesity,
low CRF is the strongest predictor of risk for adverse CVH outcomes, including
mortality.50-58 Remarkably, CRF level is not solely a critical risk factor for CVD;
CRF also plays an influential role as a moderator for traditional CVD risk factors.
Hypertension
Chronic HTN is a major risk factor for CVD. Among individuals who
develop adverse CVH outcomes, HTN is the most common risk factor. As stated
by the Joint National Committee on Prevention, Detection, Evaluation, and
Treatment of High Blood Pressure, the direct relationship between CVD risk and
blood pressure (BP) begins at 115/75 mmHg.59 For each increment of 20/10
mmHg, CVD risk doubles.60
In 1984, Blair and colleagues were the first to investigate the relationship
between measured CRF and HTN incident.61 Participants were normotensive,
predominantly white, well-educated men and women (n=6,039) from the Aerobics
Center Longitudinal Study (ACLS). Participant follow-up ranged from one to 12
years. Blair et al. found that low fit individuals had a 1.5 times increased risk for
sex, body mass index, baseline BP, and follow-up interval. For low fit individuals
that were also in the highest BP category at baseline, risk for developing HTN
increased tenfold.61 These findings were confirmed by Sawada et al.62 in 3,305
normotensive Japanese men that were followed for five years. After adjusting for
age, body fat, baseline BP, and additional confounding variables, relative risk for
the development of HTN was 1.9 times greater for the least fit group compared to
the group with the highest fitness level.62 In 2003, Carnethon et al. looked at the
relationship between CRF in young adulthood and the development of CVD risk
factors in 2,478 participants from the Coronary Artery Risk Development in
Young Adults (CARDIA) study. The authors reported that each one-minute
decrease in maximal treadmill time performance was associated with a 19%
higher 15-year risk of incident HTN among men and women after adjustment for
age, sex, weight gain, and other confounding variables.63 In addition, a
subsequent study from the ACLS examined the association between CRF and
incident HTN exclusively in women who were normotensive at baseline. Results
showed that for each 1-MET increment in maximal exercise treadmill test
performance, there were 19% lower odds for developing HTN.64
Lifestyle interventions, such as increased physical activity and weight loss,
contribute significantly to successful BP control. These positive lifestyle
modifications provide beneficial changes in BP with minimal side effects.65
Several meta-analyses have reviewed numerous well-controlled aerobic exercise
studies and have consistently documented significant reductions in resting BP
recommend approaches that include regular physical activity to prevent and treat
HTN.59, 83-86
In 2013, Cornelissen and Smart published the largest meta-analysis to
date on randomized controlled trials investigating the effects of exercise training
on resting blood pressure (n=5,223; 3,401 exercisers and 1,822 sedentary
controls).80 This study included exercise interventions of endurance (105 groups),
dynamic resistance (29 groups), combined endurance and resistance training (14
groups), and isometric resistance training (5 groups) in adults who ranged from
normotensive to hypertensive. For the purpose of this literature review,
discussion focuses on endurance exercise training. Overall, training duration
ranged from four to 52 weeks and included one to seven exercise sessions per
week (majority of sessions lasted 30-60 minutes). Exercise intensity ranged from
35-95% V̇ O2peak. Endurance exercise training-mediated decreases in BP averaged 3.5 mmHg for systolic BP and 2.5 mmHg for diastolic BP. Additionally,
the largest reductions in BP following endurance training were significantly
greater in hypertensive individuals compared to prehypertensive and
normotensive individuals. These results are consistent with previous systematic
reviews stating that structured aerobic exercise interventions of moderate
intensity and adequate volume result in an independent reduction in resting BP of
approximately 4-10 mmHg in systolic and 3-8 mmHg diastolic BP regardless of
age or sex for individuals with stage 1 HTN.65, 85, 87, 88 Based in part upon this
scientific evidence, Pescatello and colleagues published an exercise prescription
following to elicit the greatest BP benefit for adults with HTN: ≥30 minutes per
day of moderate intensity aerobic exercise on most days of the week and
dynamic resistance exercise 2-3 days per week, totaling ≥150 minutes of
exercise per week.
Insulin resistance
Insulin resistance develops when the body produces insulin but does not
use insulin efficiently to uptake glucose into cells for energy usage and storage,
causing a buildup of glucose in the blood. This hyperglycemic state triggers the
pancreas to increase β-cell production of insulin to try to counteract the high
levels of blood glucose. Eventually, the β-cells can no longer meet the demands
for insulin production caused by hyperglycemia, exacerbating the levels of
glucose in the blood. Insulin resistance can lead to the development of Type 2
diabetes mellitus (T2D) and CVD. As stated by the AHA, an individual with T2D
is at approximately two to four times greater risk for dying from CVD compared to
a non-diabetic individual.2, 90
Several large observational cohort studies, including the Harvard Alumni
Study91, US male physicians92, and the Nurses’ Health Study93, 94, have
established physical activity participation as a highly effective way to avert or
delay T2D onset, and can reduce adverse CVH outcome and mortality risk
amongst those with T2D. In addition to general physical activity participation,
there is a well-documented, inverse, curvilinear association between CRF and
risk of prediabetes, T2D, and metabolic syndrome.93, 95-99 Individuals with
between each CRF level. Conversely, those with low CRF that gain small
increments in CRF are associated with large decreases in risk for developing
T2D, highlighting the importance of physical activity and exercise interventions
targeting individuals who are the least fit and stand the most to gain from
improved CRF.47
In the human body, skeletal muscle is the largest consumer of glucose.
Not only does insulin stimulate uptake of glucose into muscle cells, but these
cells also have glucose transporter proteins, GLUT-4 specifically, that instigate
glucose uptake. Exercise increases glucose uptake into working muscle cells via
the GLUT-4 transporter in an insulin-independent manner.100 A strong evidence
base exists with numerous exercise training studies supporting the idea that both
aerobic and anaerobic exercise training can improve both glucose uptake and
insulin sensitivity, making exercise a remarkable modulator for T2D and CVD
risk.101, 102
The seminal study by the Diabetes Prevention Program study provided
strong evidence that lifestyle modifications including diet and exercise were more
effective than pharmaceutical treatment using metformin in reducing the
incidence of T2D.103 Participants (n=3,234) were nondiabetic and had elevated
fasting and post-load plasma glucose concentrations. Participants were
randomized to one of three groups: placebo, metformin (850 mg twice daily), or a
lifestyle modification group. Participants in the lifestyle intervention group were
encouraged to achieve goals of 7% weight loss and ≥150 minutes per week of
intervention reduced T2D incidence by 58%, which was significantly greater than
the 31% reduction in the metformin group. This study stated that in order to
prevent a single case of T2D during a three-year period, 6.9 individuals would
have to participate in the lifestyle intervention, while 13.9 individuals would have
to receive metformin.
In 2014, Conn and colleagues were the first to publish a comprehensive
meta-analysis regarding the effects of supervised exercise training on insulin
sensitivity in healthy adults.104 This analysis included both published and
unpublished exercise intervention studies that measured insulin sensitivity, and
included 78 study reports and a total of 2,509 men and women. Unfortunately,
only 68 of the reports provided adequate details of the exercise intervention. Of
those reported, the median of the average exercise session time during
supervised training was 51 minutes; the median of average session frequency
was three per week; and the median of mean total number of exercise sessions
was 51. Overall, this review documented moderate improvements in insulin
sensitivity in healthy adults following supervised exercise interventions (mean
effect size 0.38 and 0.43).
Recently, Bird and Hawley reviewed the literature regarding the effects of
physical activity and exercise on insulin sensitivity to provide an update on the
latest research published between 2013 and 2016.105 In addition to furthering the
support of physical activity’s beneficial association with insulin sensitivity, the
authors summarized the following new findings: aerobic exercise may increase
emerging that shows increases in both exercise volume and intensity modulate
insulin sensitivity, aerobic exercise combined with resistance exercise may be
the most effective approach compared to either exercise mode alone, and
exercise induced benefits in insulin sensitivity may be augmented by appropriate
dietary changes.
Dyslipidemia
Another major risk factor for CVD is dyslipidemia, a condition in which
plasma cholesterol, TG, or both are elevated. Dyslipidemia can include both low
levels of HDL-C; (HDL particles remove cholesterol from arteries) and high levels
of LDL-C (LDL particles increase fatty deposits in arteries), which leads to
increased risk of plaque buildup and blockages. Prevalence of lipid abnormalities
in the United States estimated from the 2003-2006 National Health and Nutrition
Examination Survey (NHANES) are as follows: 53% of U.S. adults have lipid
abnormalities; 27% have high LDL-C; 23% have low HDL-C; and 30% have high
TG. In a previous epidemiological study from 2000, low levels of HDL-C and
elevated total cholesterol to HDL-C ratios were independently associated with
risk for coronary artery disease (CAD). For every 1 mg/dL increase in HDL-C,
there was a 2% decreased risk for CAD in men and a 3% reduction in risk for
women.106
In 2015, Sarzynski et al.107 examined the associations of baseline CRF
and changes in CRF on incident dyslipidemias in participants from the CARDIA
study (n=4,898). Over a 25-yr follow-up period, a significant inverse relationship
HDL-C, high TG, and high LDL-C) and baseline CRF. For example, the 25-yr incident
rate for high TG was 42% lower in the highest CRF quartile at baseline compared
to the lowest CRF quartile. For each of these dyslipidemic traits, those in the
highest sex-specific CRF quartile at baseline had significantly lower incidence
rates than the other three CRF quartiles. For each additional stage completed
during maximal fitness testing (two min per stage), risk for incident low HDL-C,
high TG, and high LDL-C was decreased by 9%, 16%, and 14%, respectively.
When evaluating the influence of sex and race, the association of baseline CRF
with 25-yr incidence of high TG appeared to be limited to white participants only.
There were no significant associations found in black participants. Longitudinal
results from adjusted regression models were not significant for the prediction of
5-yr incidence of dyslipidemias based on 20-yr change in CRF. On the other
hand, baseline CRF did significantly predict 5-yr incidence of high TG.107 The
results from this study support the notion that achieving higher levels of CRF are
related to decreased risk for incidence of dyslipidemias, particularly high TG.
A recent report looked at the impact of both baseline CRF and changes in
CRF on the risk for developing atherogenic dyslipidemia in men and women from
the ACLS.108 Atherogenic dyslipidemia was defined by the following: low HDL-C
(<40 mg/dL), high LDL-C (≥160 mg/dL), and high TG (≥200 mg/dL). A total of
9,651 participants were followed over an average of 8.9 years. During follow-up,
193 participants developed atherogenic dyslipidemia. Participants with high
levels of CRF at baseline had 43% lower odds of developing atherogenic
LDL-C, and TG were accounted for in the analysis, this association became
nonsignificant. When looking at changes in CRF over time, participants who
maintained their fitness level had 43% lower odds of developing atherogenic
dyslipidemia compared to those who had a reduction in CRF level. This
relationship remained statistically significant after additional adjustment for
baseline lipid metrics.108 Therefore, this study demonstrated a protective effect of
CRF against the risk for developing atherogenic dyslipidemia.
The majority of epidemiological and clinical evidence supports the
following concept: when adequate intensity, duration, and volume of aerobic
exercise are performed by both healthy individuals and those with dyslipidemia,
there are favorable and independent alterations in blood lipids and lipoproteins.88,
109-111 Mounting evidence exists suggesting that the magnitude of changes in
HDL-C is related more to the volume of exercise rather than the intensity.109, 110,
112 To achieve significant changes in HDL-C, volume of exercise needed is
estimated to be 1,000 to 1,500 kcal/week.113,88
When looking at the components of dyslipidemia, the evidence describing
increases in HDL-C with exercise is more consistent in comparison to the
evidence describing reductions in total cholesterol, LDL-C, and TG
concentrations.111, 112, 114 LDL-C is largely unaffected by regular exercise when
body weight and diet remain unchanged.114-116 When exercise is combined with
alterations in diet in patients with dyslipidemia, LDL-C reductions can be greater
exercise training has been shown to attenuate reductions in HDL-C that typically
result from low-fat diets.117-120
Kodama and colleagues performed a meta-analysis investigating the
effects of aerobic exercise training studies on HDL-C.121 Twenty-five aerobic
training randomized controlled trials were included for review. Average
intervention duration was 27 weeks with a mean frequency of 3.7 sessions per
week, mean session time of 40.5 minutes, mean estimated energy expenditure
was 1,019 kcal/week, and mean absolute and relative intensity was 64.8%
V̇ O2max and 5.3 METs, respectively. Overall, the exercise interventions produced
a modest, yet highly significant beneficial change in HDL-C of 2.53 mg/dL. This
analysis estimated a minimal exercise volume threshold of 900 kcal/week or 120
minutes of total exercise per week to induce a significant elevation in HDL-C. In
addition, each 10-minute increase in exercise duration corresponded to
approximately a 1.4 mg/dL elevation in HDL-C. Finally, exercise training was
found to be more effective in participants with lower body mass index or higher
baseline HDL-C levels.
Overweight and obesity
According to the World Health Organization (WHO), overweight (OW) and
obesity (OB) are classified by the following: OW is a body mass index (BMI)
between 25.0-29.9 kg/m2 and OB is a BMI greater than or equal to 30 kg/m2.
Based upon NHANES data from 2009-2012, 69% of U.S. adults are OW and
35% are considered OB.122 As documented by numerous reports, there is a
OW and OB well-established CVD risk factors.122-128 In addition, excess risk
results from OW and OB coexisting with several other major CVD risk factors,
like HTN, atherosclerosis, metabolic syndrome, dyslipidemia, T2D, and
obstructive sleep apnea.129 Increased adiposity, especially visceral adiposity, has
also been shown to independently provoke alterations in cardiac structure and
function, further compounding the effects of OB on CVD risk.129, 130
Both central and peripheral hemodynamics are altered by weight gain and
OB that predispose individuals to ventricular dysfunction and heart failure,
including increased central and total blood volume, decreased systemic vascular
resistance, and increased left ventricular (LV) stroke volume and filling
pressures, cardiac output, and pulmonary artery pressures.130-133 OB increases
the likelihood of having LV remodeling, left atrial enlargement, increased right
ventricular mass, and greater end-diastolic volume.134-137 Moreover, OB is
associated with LV diastolic dysfunction, subclinical LV systolic dysfunction, and
reduced right ventricular ejection fraction. 132, 138-141
Although a strong association between excess adiposity and CVD risk
exists, the evidence base demonstrating a phenomenon termed the “obesity
paradox” has grown. Recent evidence from Lavie and colleagues has shown a
better prognosis in patients with CVD who are OW and mildly OB compared to
patients with CVD who are leaner. Patients with CVD who are underweight
usually display the worst outcomes.131, 132 Currently, the mechanisms by which
this phenomenon relates to CVD outcomes are poorly understood.129 Although
suggests that muscle mass, strength, and CRF are major prognostic
determinants in OB patients with CVD (specifically coronary artery disease and
heart failure) and is important to note.142-145
A complex interaction exists between adiposity and CRF in regards to
CVD risk and mortality, referred to as the “fit and fat” phenomenon, where high
levels of CRF largely negate the adverse health effects of body fatness and
additional CVD risk factors like OW/OB, T2D, and HTN.146-155 Two landmark
fitness-fatness studies arose from the ACLS in 1999.154, 155 Both of these studies
analyzed data from over 21,000 men with approximately 8-10 years of follow-up
from the ACLS and found that low CRF was strongly, independently, and
inversely associated with CVD and all-cause mortality, regardless of body
fatness. These pivotal studies concluded that OB did not appear to increase
mortality risk in fit men, and that low CRF is as important as T2D, HTN, high
cholesterol, and smoking as a predictor of CVD and all-cause mortality in OW
and OB men. Since then, these findings have remained consistent amongst
additional ACLS reports in both men and women.156 For example, in 14,345 men
from the ACLS, Lee and colleagues found that each 1-MET increase in CRF
between two maximal exercise tests that were on average 6.3 years apart was
associated with a 15% reduction in all-cause mortality and a 19% reduction in
CVD mortality (results were after adjustment for potential confounders and
changes in CRF).157 Change in BMI was not associated with CVD or all-cause
Additionally, men who lost fitness had higher risks of all-cause and CVD mortality
regardless of change in BMI.
There are several factors that appear to play a role in the alteration of
CVD risk due to increases in exercise and CRF in OW/OB patients, such as body
composition, insulin resistance, endothelial dysfunction, oxidative stress, platelet
reactivity, and inflammation.129 As visceral adiposity is a strong predictor of
CVD,158 one example of CRF-mediated changes in CVD risk is the ability of
exercise training to influence the distribution of body fat.36, 159-162 In 2013, Vissers
et al. conducted a meta-analysis of 15 exercise training studies without
hypocaloric diet on the effects of exercise on visceral adipose tissue (VAT) in
OW adults.162 This study analyzed data from 9 controlled and 6 uncontrolled
exercise trials (n=852), including aerobic, strength, or combined aerobic and
strength training interventions, that had measures of VAT from computed
tomography (CT) scan or magnetic resonance imaging (MRI). Overall, this
meta-analysis found that aerobic training of moderate or high intensity had the greatest
effect for reducing VAT in men and women compared to low intensity aerobic or
strength training. This study found that after just 12 weeks of intervention,
aerobic exercise training could beneficially reduce VAT (as measured by CT
analysis) by more than 30 cm2 in women and 40 cm2 in men. Thus, this study
concluded that decreases in VAT can be achieved via moderate and high
intensity aerobic exercise without hypocaloric diet in OW/OB individuals, which