University of South Carolina
Scholar Commons
Theses and Dissertations
2017
Targeting Aberrant Glycosylation In Colon And
Prostate Cancer With An Improved Synthetic
Lectin Array
Tanya Hundal
University of South Carolina
Follow this and additional works at:https://scholarcommons.sc.edu/etd Part of theChemistry Commons
This Open Access Dissertation is brought to you by Scholar Commons. It has been accepted for inclusion in Theses and Dissertations by an authorized administrator of Scholar Commons. For more information, please [email protected].
Recommended Citation
T
ARGETINGA
BERRANTG
LYCOSYLATION INC
OLON ANDP
ROSTATEC
ANCER WITH ANI
MPROVEDS
YNTHETICL
ECTINA
RRAYby
Tanya Hundal
Bachelor of Science
Guru Nanak Dev University, 2009
Master of Science Delhi University, 2011
Submitted in Partial Fulfillment of the Requirements
For the Degree of Doctor of Philosophy in
Chemistry
College of Arts and Sciences
University of South Carolina
2017
Accepted by:
John J. Lavigne, Major Professor
Mythreye Karthikeyan, Chair, Examining Committee
Qian Wang, Committee Member
Peisheng Xu, Committee Member
© Copyright by Tanya Hundal, 2017
DEDICATION
ACKNOWLEDGMENTS
When I joined this lab, I did not feel a day older than a child who was just
learning how to walk. Ever since then, I have had some special people watching over
influencing me and seeing me grow. I feel blessed to meet so many people who have
been guiding beacons throughout my Ph.D. journey. The scope of this page would not
cover how grateful I feel to have so many well-wishers and supporters. I would have to
start by thanking Dr. Geeta Hundal, whose dream was that I get educated from the finest
and achieve a Ph.D. one day. When I succeed, she would be the happiest human on the
planet. I want to thank my younger brother Karan, who had to endure through all of my
‘mock-teaching classes’ growing up as kids. Little did I know that his passive reception
would help me realize the love I have for teaching!
To my Ph.D. supervisor/mentor/Orgo-I “Rock star” Dr. John J. Lavigne, I humbly
express my gratitude. I am so thankful for his guidance (on professional and on personal
front) and patience (he winced every time I talked about boronic acids). He has taught me
a valuable lesson on how Science is not all black and white and that everything in the
middle is all that makes a difference.
To my committee members, Dr. Wang, Dr. Karthikeyan and Dr. Xu, for always
educating me through discussions and challenging questions. To my teaching mentor, Dr.
Sheryl Wiskur, for sharing her innumerable pedagogical skills with me. To my former lab
mates, and colleagues Dr. Kathleen O’ Connell, Dr. Erin Gatrone, Dr. Anna Veldkamp,
lab mates and friends, Rong, Steve, Ashley, Grace and Dan for their words of
encouragement, humor and peanut butter cups.
I am very thankful to the close friends that I made here at USC, Naimah, Anusha,
Shraddha, Bojidha and Vinya. Not only have they all been the greatest people to have as
roommates and friends, but their personal journeys of thesis completion inspires this slug
to finish as well! To all my close friends over the years: Naval, Neha, Varinda. Shivam
ABSTRACT
Cancers of the colon and prostate, though treatable, necessitate early detection to
improve patient outcomes. Current diagnostics, (visual methods or biopsies) besides
being invasive, are subjective towards interpretation, thus decreasing accuracy.
Alternatively, blood-based tests involving measuring of specific biomarkers (like CEA
and PSA for colon and prostate cancers, respectively) are associated with high
false-positive rates and are more useful for monitoring post-treatment patient health, thus
driving efforts to identify better screening and diagnostic techniques.
Abnormal glycosylation of integral membrane and secreted glycoproteins is known to
take place at the onset of many diseases, including cancer, and presents as the over, under
or new occurrence of certain glycans. The aim of this study is to design synthetic lectins
(SLs) that could discriminate cancer-associated glycans (CAGs) and to investigate global
glycosylation changes associated with colon and prostate cancers. Further, the ability of
an array of SLs to discriminate cells based upon their metastatic potential, demonstrates
an alternative approach to detect colon and prostate cancers by looking at aberrant
glycosylation changes rather than hunting for a specific biomarker.
Chapter 1 details on abnormal protein glycosylations. An account of how diols in
glycans can be investigated using boronic acids mediated glycan sensors in the past. This
follows introduction to Lavigne group peptide-boronic acid conjugates (Synthetic
Lectins). A discussion of SL-array platform and its utility at discriminating proteins
Chapter 2 describes various chemical modifications done to the SLs (peptide
sequences and boronic acid moieties) in order to establish structure and activity
relationships against purified glycoprotein analytes. Purified glycoproteins were used
since the glycans displayed in them are also present in CAGs and have a positive disease
correlation. The aim of these experiments is to gain an insight on chemical basis of
SL-glycoprotein interactions. Several hypothesis were drawn on the design of new SLs.
Positive charges on SLs helped pre-organization of SL-glycoprotein interaction.
Chapter 3 aims at incorporating new SLs into the pre-existing SL array to investigate
colon and prostate cancer in vitro. The chemical make-up of the SLs that statistically
contributed the most to discriminate cancer is evaluated. An extended SL array
(combining old and new SLs), can discriminate normal, low metastatic and high
metastatic states from secreted proteins of different prostate and colon cells with >99%
accuracy. Metastatic potential of colon and prostate correlate with variation in i). number
of Arginine (R) residues and ii). number of phenyl rings in SL peptide sequences.
Chapter 4 details on quantifying sialic acid content in vitro and investigating any
correlations with the metastatic potential of colon and prostate cell lines. Further, several
CAGs were classified using SL array with >99% accuracy. The positively charged amino
acids (e.g., Arg) and those containing phenyl ring residues (e.g., Tyr, Phe) appear to be
the principal factors involved in discriminating CAGs. Based on the relative importance
that charged amino acids and phenyl boronic acids in SLs have at evaluating metastatic
potential; several tissue specific SLs were found and their peptide sequence homology
TABLE OF CONTENTS
DEDICATION ... iii
ACKNOWLEDGMENTS ... iv
ABSTRACT ... vi
LIST OF TABLES ... xii
LIST OF FIGURES ... xiv
LIST OF ABBREVIATIONS ... xvii
CHAPTER 1 INTRODUCTION AND BACKGROUND ... 1
1.0 OVERVIEW ... 1
1.1 COLON AND PROSTATE CANCER STATISTICS ... 1
1.2 COLORECTAL AND PROSTATE CANCER DETECTION AND DIAGNOSIS 2 1.3 ABERRANT GLYCOSYLATION: HALLMARK OF CANCER ... 4
1.4 LECTINS: CARBOHYDRATE BINDING PROTEINS ... 6
1.5 INTERACTIONS BETWEEN BORONIC ACIDS AND DIOLS ... 7
1.6 ADVENT OF BORONIC ACID FUNCTIONALIZED GLYCAN SENSORS .... 10
1.7 CROSS-REACTIVE SYNTHETIC LECTIN ARRAYS ... 14
1.8 OUR APPROACH: BORONIC ACID FUNCTIONALIZED SYNTHETIC LECTIN ... 15
1.9 PROPOSED SYNTHETIC LECTIN AND GLYCAN BINDING ... 16
1.11 NON-COVALENT PROTEIN INTERACTIONS IN AQUEOUS
ENVIRONMENT ... 22
1.12 REFERENCES ... 26
CHAPTER 2 : INVESTIGATION OF STRUCTURE-ACTIVITY RELATIONSHIP BETWEEN SYNTHETIC LECTINS AND GLYCO-PROTEINS ... 32
2.0 OVERVIEW ... 32
2.1 VARIATION OF INTRA-DIAMINO BUTANOIC ACID DISTANCE ... 33
2.2 VARIATION ON SL5 BY ALTERING BORONIC ACID ATTACHMENTS .... 37
2.3 COMPARING DISSOCIATION CONSTANTS OF SL5 AND ITS MUTANTS 41 2.4 PEPTIDE SEQUENCE MUTATIONS ON POLAR AND NON-POLAR AMINO ACIDS... 43
2.5 PEPTIDE SEQUENCE MUTATIONS ON POSITIVELY CHARGED AMINO ACIDS... 47
2.6 CONCLUSIONS... 51
2.7 FUTURE DIRECTIONS ... 53
2.8 EXPERIMENTAL PROCEDURES ... 55
2.9 REFERENCES ... 65
CHAPTER 3 : EMPLOYING DESIGNED SYNTHETIC LECTINS IN ARRAY TO EVALUATE METASTATIC POTENTIAL OF HUMAN COLON, AND PROSTATE CANCER IN-VITRO ... 66
3.0 OVERVIEW ... 66
3.1 INVESTIGATING COLON CANCER USING EXTENDED LECTIN ARRAY AND PROTEINS EXTRACTED FROM COLON CANCER CELL MEMBRANES 68 3.2 INVESTIGATING COLON CANCER USING EXTENDED LECTIN ARRAY AND SECRETED PROTEINS FROM COLON CELLS ... 72
3.3 IMPACT OF MANY LECTINS IN SL ARRAY ON TOTAL VARIANCE OF PCA MODEL... 83
3.5 INVESTIGATING PROSTATE CANCER USING EXTENDED LECTIN
ARRAY AND SECRETED PROTEINS FROM PROSTATE CELLS ... 88
3.6 CONCLUSIONS... 95
3.7 FUTURE DIRECTIONS ... 98
3.8 EXPERIMENTAL PROCEDURES ... 99
3.9 REFERENCES ... 108
CHAPTER 4 : IN-VITRO CHEMICAL TARGETS OF EXTENDED SL ARRAY AND ITS STRUCTURAL CORRELATIONS WITH CANCER TARGETS ... 111
4.0 OVERVIEW ... 111
4.1 SIALIC ACID QUANTIFICATION OF COLON AND PROSTATE CELLS ... 112
4.2 INTERACTION OF SL-ARRAY WITH SECRETED COLON PROTEINS THAT CONTAIN OR ARE DEVOID OF SIALIC ACIDS ... 119
4.3 RESPONSE OF CANCER ASSOCIATED GLYCANS TO SL ARRAY ... 122
4.4 APPLICATIONS OF SL ARRAY TO DISCERN HUMAN PROSTATE TISSUE SAMPLES... 127
4.5 DESIGNING FUTURE SL TARGETS FOR COLON AND PROSTATE CANCER ... 131
4.6 CONCLUSIONS... 142
4.7 FUTURE DIRECTIONS ... 144
4.8 EXPERIMENTAL PROCEDURES ... 145
4.9 REFERENCES ... 156
BIBLIOGRAPHY: ... 157
APPENDIX A : LC-MS OF PEPTIDE SEQUENCES OF SELECT SLS ... 167
APPENDIX B : 22-UNIT SL ARRAY ... 179
APPENDIX C : TOP SEVEN SLS FOR ALL TISSUES TOGETHER ... 180
LIST OF TABLES
Table 1.1: Synthetic Lectins (SLs) with their peptide sequences that show binding with
the proof of concept glycoproteins. ... 18
Table 1.2 Colon cell lines used for SL binding analysis; listed is the species, cell type and origin of the cell lines. ... 20
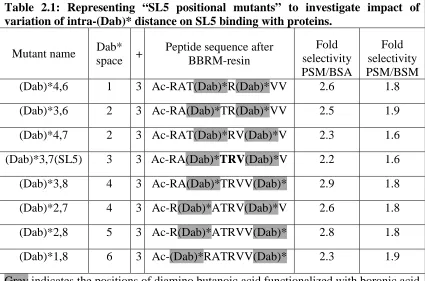
Table 2.1: Representing “SL5 positional mutants” to investigate impact of variation of intra-(Dab)* distance on SL5 binding with proteins. ... 34
Table 2.2: Showing “SL5 Boronic acid mutants’ ... 38
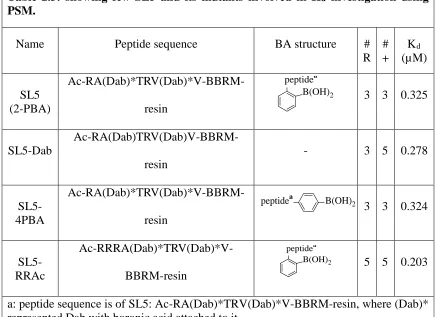
Table 2.3: showing few SL5 and its mutants involved in Kd investigation using PSM. .. 41
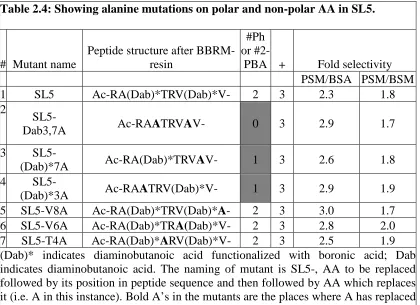
Table 2.4: Showing alanine mutations on polar and non-polar AA in SL5. ... 43
Table 2.5: Showing SL5 Arginine (R) mutants. ... 48
Table 3.1: Designed SLs after structure and activity relationship evaluation. ... 67
Table 3.2: Human colon cell lines used with extended lectin array. ... 69
Table 3.3: SLs most significant at classifying proteins from colon cell membrane according to their metastatic potential. ... 69
Table 3.4: All 20 SLs in extended lectin array. ... 73
Table 3.5: SLs most significant at classifying proteins secreted from colon cell lines with metastatic potential. ... 75
Table 3.6: Cancer associated glycans in malignant tissues... 89
Table 3.7: Human prostate cell lines used with extended SL array. ... 89
Table 3.8: Showing most significant SLs at classifying proteins secreted from prostate cells according to their metastatic potential. ... 91
LIST OF FIGURES
Figure 1.1: Some examples of cancer-associated glycans (CAGs) that are often involved
in aberrant glycosylation during oncogenesis and disease progression.14. 15, 20 ... 4
Figure 1.2: Showing two major types of protein glycosylation. ... 5
Figure 1.3: Glycosylation reactions catalyzed by the action of glycosyltransferase causing several regulatory functions.21 ... 7
Figure 1.4: Interaction between boronic acids and 1,2- or 1,3-cis diols commonly present
in glycans. ... 8
Figure 1.5: The equilibrium between phenylboronic acid and a diol lies towards boronate ester formation (2 &4) in basic aqueous solution. ... 8
Figure 1.6: Showing proposed equilibrium by Anslyn group by incorporating an
aminomethyl group ortho to phenylboronic acid and facilitating binding of phenyl
boronic acid with diols at physiological pH. ... 9
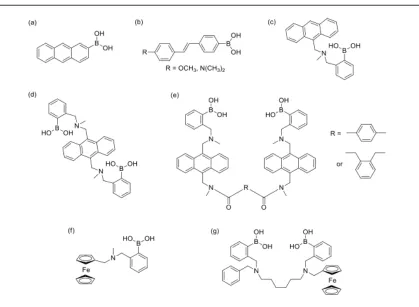
Figure 1.7: Structures of boronic acid functionalized sensors used for glycan sensing. (a) Yoon and Czarnik first fluorescent probe, (b) Lakowicz group’s Intramolecular charge transfer (ICT) sensors, (c-d) Shinkai’s and Wang’s group (e) Photoinduced electron transfer (PET) sensors, (f-g) James’ group electrochemical sensors. ... 11
Figure 1.8: Animated view of cross-reactive sensors/receptors arranged into a sensor array. ... 14
Figure 1.9: General scheme of synthetic lectin (SL) attached to a polymeric resin bead. 16
Figure 1.10: Schematic representation of Boronic acid and SL interaction with a glycan or glycoprotein. ... 17
Figure 1.11: Detected response from SL1-5 binding with four purified proteins as measured by fluorescence. ... 19
Figure 1.12: Discrimination of healthy (♦), cancerous low metastatic (●) and metastatic
(▲) colon cell lines using SL array shown by guided statistical grouping using
linear discriminant analysis score plot. ... 21
Figure 2.1: Showing impact of changing (Dab)* distance on SL5 with four purified
proteins. ... 35
Figure 2.2: Impact of mutating boronic acid in SL5 on binding with proteins. ... 39
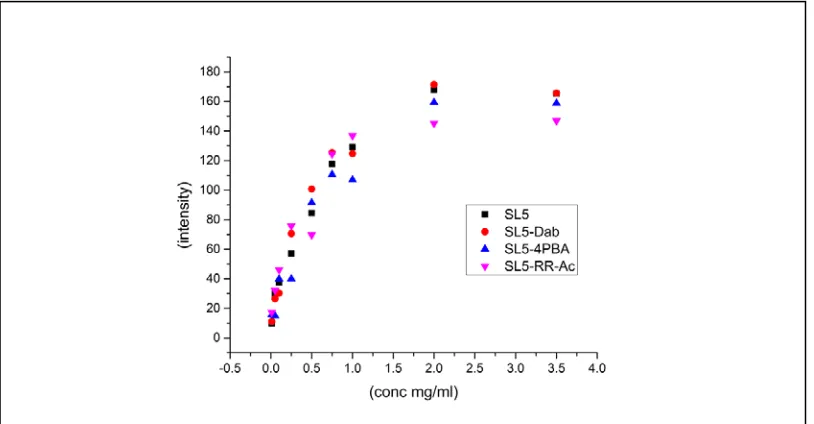
Figure 2.3: Response of SL5 and its mutants with varying PSM concentration. ... 42
Figure 2.4: Showing response of SL5 peptide sequence mutants with four proteins. ... 45
Figure 2.5: SL5 Arginine positively charged mutants. ... 49
Figure 2.6: Showing boronic acid mutants, which can be evaluated either by complementing with or by replacing 2-PBA. ... 54
Figure 3.1: Guided statistical plot (LDA) generated using extended lectin array with proteins extracted from cell membranes of four different colon cell lines. ... 70
Figure 3.2: Bar-graph showing output of extended lectin array with extracted proteins extracted from colon cell membranes of four different cell lines. ... 71
Figure 3.3: Unguided (PCA) plot showing output generated by extended lectin array with four colon cell line proteins (both cell membrane and cell-secreted) having different metastatic potentials. ... 74
Figure 3.4: Showing unguided/PCA plot using 20-unit SL array on secreted proteins from colon cells. ... 76
Figure 3.5: Showing component loading values of PCA output generated by SL array containing 20 SLs with colon cell secreted proteins. ... 79
Figure 3.6: Showing A: unguided/PCA plot of 20-unit SL array with secreted proteins from colon cells being impacted by B: Removal of Area ② SLs from PCA model; C: Removal of Area ① SLs from PCA model. ... 80
Figure 3.7: Showing normalized fluorescence intensity signal of SL7 and SL11-R8A over SL5-R1,5,11A (negative Arginine control SL)... 82
Figure 3.8: Showing unguided/PCA plot of SL array with secreted proteins from colon using array having A: 20 SLs. B: five “key discriminatory” SLs. ... 83
Figure 3.9: LDA plots showing direct impact of boronic acid moiety in SLs included in array at classifying different protein samples from colon cells. ... 86
Figure 3.10: Alizarin red dye binding with SL5 and SL5-Dab... 87
SLs with lower number of phenyl rings (0-2); C: SLs with greater number of phenyl rings (4) and lower positive charge (0 to +2). ... 92
Figure 3.12: Showing guided/LDA 3-class plots based on cell type of secreted proteins from prostate cell lines ... 94
Figure 3.13: Illustrating 3-D PCA plot of normal (green) and metastatic (red) cell lines. 98
Figure 4.1: Showing amount of total sialic acid isolated from colon cell secreted proteins on top of a PCA plot generated using an SL array. ... 116
Figure 4.2: Showing amount of total sialic acid isolated from prostate cell secreted proteins on top of a PCA plot generated using an SL array. ... 117
Figure 4.3: Illustrates SL array mediated 4-class guided (LDA) plot of isolated proteins with and without sialic acid residues. ... 120
Figure 4.4: Illustrates unguided (PCA) plot of cell secreted proteins with and without sialic acids responding to a 20-unit SL array. ... 121
Figure 4.5: Selective binding of Synthetic Lectins (SL). ... 123
Figure 4.6: Guided statistical output of SL array with various CAGs. ... 126
Figure 4.7: Showing unguided/ (PCA) plot discerning four patient-matched tissue samples having prostate cancer using 22 unit SL-array. ... 129
Figure 4.8: Illustrating Split and Pool combinatorial method. ... 134
Figure 4.9: Flowchart showing the incubation of different SL libraries with different healthy and metastatic dual-labeled protein analytes. ... 135
Figure 4.10: Schematic depicting Edman degradation. ... 136
Figure 4.11: Binning chart representing population diversity of bead fluorescent intensity in 3-BA and 2-BA SL libraries ... 138
Figure 4.12: Binning chart representing population diversity of bead fluorescent intensity in 3-BA and 2-BA SL libraries ... 139
LIST OF ABBREVIATIONS
2-PBA ... 2-formyl phenyl Boronic Acid
4-PBA ... 4-formyl phenyl Boronic Acid
AA ... Amino Acid
A ... Alanine
BA ... Boronic Acid
(BOC)2O ... Di-tert-butyl dicarbonate
BSA ... Bovine Serum Albumin
BSM ... Bovine Submaxillary Mucin
CAG ... Cancer Associated Glycan
CHCA ... α-Cyano-4-hydroxycinnamic acid
DMF ... N,N’-Dimethylformamide
Dab ... Diaminobutanoic Acid
(Dab)* ... Diaminobutanoic Acid plus 2-formyl phenyl boronic acid
DSR ... Discosoma sp. Red
F ... Phenylalanine
FITC ... Fluorescein isothiocyanate
Fmoc ... Fluorenylmethyloxycarbonyl
G ... Glycine
GFP ...Green Fluorescent Protein
H2O ... Water
I ... Isoleucine
ivDde ... 1-(4,4-Dimethyl-2,6-dioxocyclo-hexylidene)-3-methylbutyl
K ... Lysine
Kd ... Dissociation constant
L ... Leucine
Lea ... Lewis A
Lex ... Lewis X
M ... Methionine
MALDA ... Linear Discriminant Analysis
MALDI ... Matrix Assisted Laser Desorption/Ionization
MeOH ... Methanol
MRBB ... Methionine,Arginine,β-Alanine, β-Alanine
MS/MS ... Mass Spectrometry/Mass Spectrometry
N ... Asparagine
NBF ... Neutral Buffered Formaldehyde
NaBH4 ... Sodium Borohydride
OVA ... Ovalalbumin
PBA ... Phenylboronic Acid
PBS ... Phospho Buffer Saline
PCA ... Principal Component Analysis
PSM... Porcine Stomach mucin
R ... Arginine
S ... Serine
SL ... Synthetic Lectin
sLea ... sialyl Lewis A
sLex ... sialyl Lewis X
T ... Threonine
TFA ...Thomsen Friedenreich Antigen
TIS... Triisopropylsilane
V ... Valine
W ... Tryptophan
CHAPTER 1
INTRODUCTION AND BACKGROUND
1.0OVERVIEW
Cancer, the rampant growth and invasion of abnormal cells in the body, is one of
the leading causes of death not only in the United States but also worldwide. Colon
cancer ranks as the third leading cause of death for both men and women. Whereas,
prostate cancer is the second leading cause of death from cancer in men, here in the
States. It is a well-known fact that the early diagnosis is a paramount for an optimal
patient outcome. Post-translational modifications causing an advent of abnormal changes
in glycosylation during the onset and progression of the disease, is a cancer hallmark.
This anomalous glycosylation allows several glycans to serve as biomarkers. This chapter
will shed some light upon the current cancer diagnostics and the necessity for the new
ones. It will then discuss how polymeric boronic acid-peptide conjugates: also known as
synthetic lectins (SLs) develop as glycan sensors. Later, how an array of such
cross-reactive sensors are useful in designing a novel cancer diagnostic.
1.1COLON AND PROSTATE CANCER STATISTICS
Cancer is one of the leading causes of morbidity and mortality worldwide, with
approximately 14 million new cases in 2012.1 American Cancer Society estimates that
there will be 1,688,780 new cases of cancer and reports 600,920 deaths in the year 2017.
cancer is the second deadliest of the cancers in men. In 2017, there will approximately
50,000 deaths and 27,000 deaths due to colorectal and prostate cancer respectively.2
1.2COLORECTAL AND PROSTATE CANCER DETECTION AND DIAGNOSIS
WHO funded International Agency for Research on Cancer establishes that cancer
mortality can reduce, provided there is an earlier detection and treatment available.
Approximately 30-50% percent of cancers are preventable through screening and early
detection strategies. There is a high five-year survival rate in case of colon cancer of 90%
when the diagnosis reports the disease is localized within the bowel walls (Stage I). The
rate of survival plummets to 68%, once cancer metastasizes in to the lymph nodes (stage
III): thus necessitating early detection.3
There are some non-invasive colorectal cancer screening techniques too (gFOBT,
FIT, stool DNA test), which look for blood in the stools, collectively have an accuracy
rate of 38-51% hence they present high false-positive rates.4 On the other hand, invasive
visual methods of screening, such as colonoscopy are also present.5 Colonoscopy
although quite sensitive yet it has a set of complications, e.g. bleeding, lacerations,
increased risk of infection and high price-point.6-8 Yet, colonoscopy provides a more
accurate detection than the non-invasive procedures like FIT and gFOBT albeit
associated with high false-negative rates.9 While the FIT has success with identifying
advances neoplasms, the main disadvantage with the FIT over colonoscopy is that it has
higher false-negative results in detecting T1 cancer versus T2- T4.10
There are invasive diagnostic techniques to determine prostate cancer, like Digital
Rectal Exam (DRE) and Trans Rectal Ultrasound (TRUS). These involve monitoring
of TRUS is its invasive nature, leading to morbidity related to diagnosis due to infections,
hematuria and haematospermia.11 DRE lacked sensitivity in general especially at the
onset of prostate cancer.12, 13 Increasing the specificity and sensitivity, while at the same
time reducing the ‘invasiveness’ of a diagnostic procedure, has been a driving factor in
the search for colorectal cancer biomarkers.
The other method of diagnosis is with use of biomarkers to diagnose and stage
cancers. For example, Carcinoembryonic antigen (CEA) is a glycosylated cell-surface
glycoprotein and in healthy patients, CEA levels can range from 2.5 to 5 ng/mL. The
correlation of colorectal cancer with an increased CEA levels in patients with Stage I
cancer is only 4%, while in patients with stage II cancer is 25%.14 Similarly there is CA
19-9 test, which measures the antibody against sialylated-Lewis a (sLea) (which typically
increases in colorectal cancer) showed lack of disease specificity Both CEA and CA
19-9 tests are associated with high false-positive rates of 16 and 60% respectively.15 In 2000,
the American Society of Clinical Oncology (ASCO) recommended that the CEA and CA
19-9 tests no longer be used as a diagnostic tool, but rather be used to monitor disease
progression.16
Along with DRE and TRUS, monitoring of a serum-based glycoprotein called
Prostate-Specific Antigen (PSA) completes the diagnostic triad for prostate cancer.17 PSA
levels above 4.0 ng/mL, meant some abnormality and the patient is recommended
biopsy.18 Besides prostate cancer, age, level of activity and inflammation are also the
reasons for elevated PSA, thus deeming it non-specific. PSA has notoriously high
false-positive rate and only 25% of the men that undergo biopsies actually have cancer.19 Not
most are also ineffective in early stages of cancer, when the disease is most treatable.
This calls for a development of a detection procedure with high positive correlations and
minimal invasion. Hence, the long-term goal of this project is the development of a
sensitive and preferably easy to use sensor, with the ability to detect colon and prostate
cancer related targets.
1.3ABERRANT GLYCOSYLATION: HALLMARK OF CANCER
Aberrant glycosylation (term coined by Meezan et. al. in 1969) of integral cell
membrane proteins and secreted glycoproteins occurs during carcinogenesis.20, 21 Over
70% of proteins (both membrane-bound and secreted) undergo glycosylation.22
Post-translational glycan modifications associated with cancer are termed as
Cancer-Associated Glycans (CAGs) (Figure 1.1). Aberrant glycosylation also takes place at the
onset of many diseases including cancers, inflammation, as well as lysosomal storage
diseases. The glycans on the glycoproteins can be under, over, or neo-expressed.
O O O O O O O HO OH OH HO H3C NHAc OR OH OH OH OH CO2 HO AcHN OH HO
sLex O
O O O O O O HO OH OH HO H3C
AcHN OH OH OH CO2 HO AcHN OH HO sLea OR HO O O O O O O OH OH HO H3C OH O OH OH OH HO Ley O O O O O HO OH OH HO H3C NHAc OR OH OH OH HO Lex O O HO CO2 HO AcHN OH HO O HO OH OH OR OH OH OH H3C O OR AcHN HO HO OH O OR AcHN HO HO sTn Tn OR O HO CO2 HO AcHN OH HO sialic acid O HO OH OH OH H3C fucose O O O O O HO OH OH HO H3C AcHN OR HO OH OH HO Lea OH O OH AcHN O HO OH O OH OH HO HO TF Antigen
Figure 1.1: Some examples of cancer-associated glycans (CAGs) that are often involved in aberrant glycosylation during oncogenesis and disease
progression.14. 15, 20
This altered glycosylation occurs on both the membrane-bound proteins as well as the
secretory proteins.23 Aberrant glycosylation process takes place at the onset of cancer and
continues as the disease progresses.24 There are two sites for protein glycosylation:
N-linked and O-N-linked glycosylation (Figure 1.2) For instance, sialyl Lewis X (sLex) and
sialyl Lewis A (sLea) are CAGs that have increased abundance in colon cancer cells, they
are few of the glycans looked at with the SL array.23 There never is one CAG associated
with one type of tissue malignancy, but a mélange of glycosylations alter, which change
the overall glycan makeup by changing the amount of sialylation or fucosylation.25
Taking this as a phenotypical characteristic of cancerous tissue.26, 27, cells are probed with
lectins (carbohydrate binding peptides), specifically synthetic lectins (SLs) to detect
abnormal glycosylation.28, 29 For instance, sialyl Lewis X (sLex) and sialyl Lewis A (sLea)
are CAGs that have increased abundance in colon cancer cells, they are few of the
glycans looked at with the SL array.29 While many glycoproteins are used to detect
cancer (PSA and CEA), these diagnostics rely on detecting the amount of the
glycoproteins themselves and not the changes in the glycan structures of the Figure 1.2: Showing two major types of protein glycosylation.
N-glycans are shown covalently linked to asparagine (Asn) residue of proteins, specifically the Asn-X-Ser/Thr motif. O-glycans are linked hydroxyl groups of the
glycoproteins. Harnessing the overall change in glycosylation pattern can prove to be a
useful tool for cancer detection.
1.4LECTINS: CARBOHYDRATE BINDING PROTEINS
CAGs can also be monitored using antibodies30 and natural lectins31, 32, Lectins are
carbohydrate-binding proteins that serve a variety of functions in the body. Lectins can
serve as recognition signals on the surface of the cell31, play a role in protein folding and
cell-cell interaction.33 They can also be involved in cellular functions like cell adhesion,
and cell migration.21 Figure 1.3 shows the impact of glycosylation on E-cadherin and
integrin (common glycoproteins involved in cell adhesion). Different type of
glycosylations instigate different form of cellular functions. Lectins have high selectivity
for a particular target, natural lectins and natural lectin arrays have been of interest in
research in a variety of research areas (endocytosis, adhesion, EMT), but, we will limit
this discussion to cancer-related areas. Studies are looking at lectins as diagnostic tools.
One such study investigated natural lectin microarrays as a means for distinguishing
glycosylation patterns in serum from 24 different patients (model including 10 normal
patients, 8 patients with chronic pancreatitis and 6 patients with pancreatic cancer).
This microarray included five different natural lectins, however, due to the specificity
of lectins only five different glycan structures could be detected. The researchers were
able to distinguish between serum samples; however, the experiments required a large
amount of sample preparation (including glycoprotein enrichment followed by RP-HPLC
to isolate glycoproteins before they are blotting them on a microarray and analyzed using
lectins). This study also found several glycoproteins that over-expressed sialylation and
Natural lectins are expensive, unstable and give incomplete results. Natural lectins
tend to loose binding specificity when they are extracted out of their native protein
conformation. Besides this, the number glycan motifs and the number of glycan linkages
severely outweigh the number of known natural lectins. For instance, the accuracy of an
assay developed for Carcinoembryonic Antigen (CEA) is only 4% and 25%, respectively
in the diagnosis of colorectal cancer of stage I and II respectively, thus making it an
unsuitable candidate for screening and more useful for prognosis of colon cancer.14
1.5INTERACTIONS BETWEEN BORONIC ACIDS AND DIOLS
In an attempt to cross-over the previously stated disadvantages of using natural
lectins, boronic acids have been utilized in several different glycan sensors because Figure 1.3: Glycosylation reactions catalyzed by the action of glycosyltransferase causing several regulatory functions.21
boronic acids are known to form covalent yet reversible boronate esters with 1,2- and 1,3-
diols, which are found on glycans, to produce cyclic boronate esters. The interaction
between boronic acids and diols commonly found on glycans
is illustrated (Figure 1.4). When using boronic acids in glycan sensors, it is important to
understand what influences the boronic acid-diol interaction. The equilibrium exists
between phenylboronic acid and a diol in solution and illustrated in (Figure 1.5).
The equilibrium is very dependent on pH. At lower pH, the acid and diol stay
unbound since any boronic ester that forms, contains an empty p-orbital in Boron. At
higher pH, (when pH increases more than pKa of phenylboronic acid: 8.8) boronic acid
Figure 1.4: Interaction between boronic acids and 1,2- or 1,3-cis diols commonly present in glycans.
This leads to formation of proposed reversible and covalent boronate ester bond between boronic acid found on SLs and cis (1, 2- or 1, 3- ) diols of the CAGs.
B OH OH
OH HO
R1 R2 - 2H
2O
B O O
R1
R2
n
n
n = 1, 2
stays as a boronate anion (in Figure 1.5, 1 2 or 3 4). The boronate anion has a
tetrahedral geometry, making the bond angles around the boron similar to the bond angle
of the cycle boronate ester. Therefore, at physiological pH, phenylboronic acid does not
form boronate ester and this limits its use in carbohydrate detection sensors.36
In order to use phenyl boronic acids on sensors at physiological pH, the Anslyn group
investigated intramolecular boron-nitrogen interactions. In neutral aqueous solutions, the
incorporation of an ortho-aminomethyl group on to phenylboronic acid facilitated
boronic ester formation with diols.37 The amino methyl group interacts with the empty
p-orbital on the boron transforming the geometry into the favored tetrahedral conformation.
The Anslyn group proposes two reasons for this increase in boronate ester formation.
First, the neutral aqueous stability of the boron is promoted because the nitrogen can act
as an internal Lewis base and increasing boron’s solvolysis. Second, due to this nitrogen
behaving as a base, it donates lone pair to the empty p-orbital to form a weak co-Figure 1.6: Showing proposed equilibrium by Anslyn group by incorporating an aminomethyl group ortho to phenylboronic acid and facilitating binding of phenyl boronic acid with diols at physiological pH.
This happens in two ways, either by increase solvolysis of the boron (left equilibrium) or take place of the coordinating hydroxide molecule and hence acting as an internal base (right equilibrium).
ordinate/dative bond between the nitrogen and the boron. Both of these explanations
facilitate the boronate ester formation at physiological pH (Figure 1.6).37
1.6ADVENT OF BORONIC ACID FUNCTIONALIZED GLYCAN SENSORS
Over the years, several phenylboronic acid functionalized sensors were developed
for different types of saccharide sensing, specifically keeping an interest of detection of
D-glucose. It is mentioned in previous sections, that sensing glycans can be valuable
when trying to diagnose and prognose cancer. The specific recognition of boronic acid
for cis-diols provides selectivity in sensing. Some of the structures of different phenyl
boronic acid functionalized sensors that employed fluorescent, colorimetric, and
electrochemical methods are in (Figure 1.7).
Yoon and Czarnik generated the first aqueous fluorescent chemo-sensing probe using
anthrylboronic acid (Figure 1.7a).38 When the anthrylboronic acid was bound to fructose,
the anionic boronate ester formed and fluorescence intensity decreased. The resulting
cyclic ester of anthrylboronic acid and fructose had pKa of 5.9. The causation of decrease
in fluorescence intensity was proposed to be by the boronate ester formation, which
quenched the fluorescence due to electron transfer from anthracene ring.
Several other groups began to work on development of fluorescent glycan-sensors with
similar intramolecular charge transfer (ICT) complexation. For example, boronic acid
substituted stilbenes were synthesized as glycan sensors by DiCesare-Lakowicz group
(Figure 1.7b).39 The boronate anion acted as the electron-donor and the photo-induced
CT would complete when the fluorophore contained an electron-withdrawing R group
(e.g. –CN). Therefore, whenever the glycan formed boronate ester, the resulting boronate
boronate ester in the addition of a sugar at high pH, the boron does not accept electrons
anymore and this loss of charge transfer disrupts the fluorescent properties.
Shinkai’s group was the first to design Photoinduced Electron Transfer boronic acid
sensors for sugars (Figure 1.7c).40 They introduced N-methyl-o-(aminomethyl)
appendage on to the phenylboronic acid as the recognition motif and connected to a
fluorophore anthracene through a methylene spacer. The amine being ortho to the
boronic acid allowed for the interaction between the boronic acid and diols at neutral pH.
The amine-boron interaction, besides assisting formation of boronate ester also
dictated the molecule’s ability to partake in fluorescence. Without the sugar binding, the Figure 1.7: Structures of boronic acid functionalized sensors used for glycan sensing. (a) Yoon and Czarnik first fluorescent probe, (b) Lakowicz group’s
Intramolecular charge transfer (ICT) sensors, (c-d) Shinkai’s and Wang’s group (e)
Photoinduced electron transfer (PET) sensors, (f-g) James’ group electrochemical
sensor remains in an “off” state due to the nitrogen’s lone pair. While binding the sugar,
the nitrogen coordinates with the boron, causing formation of boronate ester, which
prevented electron transfer and induced fluorescence quenching. These sensors exhibited
some selectivity for sugars with it being the selective for D-Fructose and D-Glucose
equally. The molecule c in Figure 1.7 would lose selectivity when the amounts of
boronic acid or the geometry around the boron was changed. Several other PET based
B-N molecules were made where Figure 1.7d represents yet another example of an
anthracene-based system, this time containing di-boronic acids.41 It had a high selectivity
for D-Glucose over other glycans.
Binghe Wang’s group used a similar strategy to the Shinkai’s PET mechanism and
developed a series of di-boronic acid sensors. These molecules had different linkers
between two anthracene fluorophores (Figure 1.7e).42 Wang’s group found that the
compounds with the para-benzene linker showed moderate selectivity for sialyl Lewis X
in aqueous solution. Di-boronic acid sensor was found to show the strongest fluorescence
enhancement upon binding with sLex. After binding in situ to sLex, the sensor enabled
labeling of hepatocellular carcinoma (HEPG2) cells selectively via binding sLex over Ley
expressing HEP3B cells and COS7 cells, either of which do not express sLex.43
Non-sLex-expressing cells remained un-labeled.
James’s group developed electrochemical sensors, which contained electro-active
ferrocene attached to mono-boronic acid (Figure 1.7f) or di-boronic acid (Figure 1.7g).
Overall, the di-boronic acid sensor was more selective for D-glucose and D-galactose
As discussed earlier, the recognition of more complex saccharides can play a valuable
role in the detection of many different diseases. This is due to the cis-diols that are found
on glycans and glycoproteins and their ability to interact with boronic acids. The variety
of glycan conjugates and glycoproteins that show up during oncogenesis, create the dire
need for glycan-sensing and therefore, boronic acids have been incorporated into many
biosensors for their application in cancer diagnostics.
Borono-lectins are the bio-sensing probes that were developed by Hall and Anslyn
groups. They are boronic acid conjugated short peptide sequences. The selectivity of
these sensors has been greatly improved over the years. One important issue of these
sensors was their biocompatibility. In order to optimize these sensors, they needed to
have good water solubility, low toxicity, and greater stability than the other glycan
sensors. Most of the fluorescent boronic acid sensors had poor water solubility and
therefore needed organic co-solvents for sugar binding studies. Wang’s group after
enjoying the success of anthracene based PET sensors, developed different sensors that
contained quinoline and naphthalene instead. These structures improved water solubility
and stability. When binding to glycans, the fluorescence of these sensors changed. The
changes were specific to each glycan. However, these polycyclic aromatic compounds
are known to be carcinogenic, hence could not be used for sensing in vivo.44-50
While all of these sensors were promising in glycan sensing, they still had limitations.
In order to overcome these limitations, Hall used a library technique to find sensors that
targeted the TF antigen, which is a cancer-associated glycan. He used a peptide backbone
due to its biocompatible properties. The peptide backbone also had the potential to have
selectivity. Hall found that peptides functionalized with boroxoles or boronic acids had
more selectivity for the TF antigen compared to peptides without those groups.51
1.7CROSS-REACTIVE SYNTHETIC LECTIN ARRAYS
Previously, the discussion involved application of natural lectins binding and
recognizing specific glycan residues with high affinity. The specificity of this interaction
is analogous to a lock-key model, which is similar to an antigen/antibody interaction.
Since, one specific glycan does not correspond to one type of cancer, hence oncogenesis
involves a gross change in glycosylation. Therefore, looking for one biomarker that has a
high affinity may not be the best approach. Rather than thinking about one sensor for one
analyte, one can think about a set of cross-reactive sensors forming a sensor array.
(Figure 1.8).52 shows a signal output after interaction of single analyte with many
receptors.
Although aberrant glycosylation is a characteristic of cancer, there are no specific
glycans that have been identified for a specific cancer type. Therefore, instead of looking
for a specific biomarker, we should be looking for a global pattern of glycosylation. Figure 1.8: Animated view of cross-reactive sensors/receptors arranged into a sensor array.
Hence monitoring changes in the abundance of more than one glycan makes it more
useful for the diagnosis of abnormal cells. The basis of utilization of SL sensor array is
the principle of cross-reactivity. As explained earlier, cross-reactive sensor arrays are
composed of multiple ‘receptors’ (SLs in this case), with each receptor interacting
differently with different glycans. Information from these binding interactions, as a
whole, leads to the formation of a reproducible unique pattern for the “analyte” (glycans
in this case). This approach enables the discrimination of cells into normal, cancerous or
metastatic groups. These sensor arrays resemble, in principle, the electronic nose53 or
electronic tongue54 sensors, which involve pattern recognition systems. Each sensor only
has to be incrementally different to create a fingerprint that maximizes variation of the
array response binding to different analytes.
1.8OUR APPROACH: BORONIC ACID FUNCTIONALIZED SYNTHETIC LECTIN
Keeping natural lectin arrays and their binding interactions with glycans in mind,
one can synthesize lectins and then generate a synthetic lectin array to investigate binding
to glycans. In doing so, the cross-reactive property of the lectin array is harnessed, while
avoiding an elaborate usage of too many natural lectins. The Lavigne lab synthesized
Polymeric Lectins and its array. These synthetic lectins (SLs) are short peptide chains
having with Phenyl Boronic acids attached on to them as a side-chain functionality.
These peptide-boronic acid conjugates have several copies of them on each polymeric
resinous bead (typically 300µm size). The advantages to using synthetic lectins are that
they are easy to make, biocompatible, and have low toxicity. (Figure 1.9) depicts a
general synthetic lectin on a resin. It depicts one synthetic lectin on a bead; however,
peptide starts with a Methionine (M, for orthogonal binding), followed by Arginine (R)
and two β-Alanine (B, as spacers). The resin-MRBB unit is followed by eight X amino
acid residues, where X represents a random amino acid chosen (natural as well as
non-natural). The non-natural amino acid which is commonly used is diaminobutanoic acid,
represented as Dab. Dab contains –NH2 on its side chain and each peptide chain contains
two Dab units. The boronic acids (2-formyl phenyl boronic acid) are attached on to this
side chain via reductive amination. As seen in Figure 1.9 there are two phenyl boronic
acid units in each peptide sequence. The N-terminus of the SL sequence is usually
acylated (Ac).
1.9PROPOSED SYNTHETIC LECTIN AND GLYCAN BINDING
Several other research groups have targeted carbohydrates/ CAGs using boronic
acids in their receptors55-60 because they form covalent yet reversible boronate esters with
cis diols (1,2- or 1,3-) present on CAGs.61-63 Our results indicate that boronic acid
incorporation causes enhancement of SL-sugar interaction because of the covalent nature
of its bond formation i.e. a boronate ester linkage.28 Since purified and quantified CAGs
were very expensive for initial studies, the SL-glycan binding were studied by making Figure 1.9: General scheme of a synthetic lectin (SL) attached to a polymeric resin bead.
There are multiple copies of SL on each bead, making it a multivalent system. Ac R X X X X X B B R M POLYMER
BEAD
B
NH HO
HO B
NH HO
use of glycoproteins from chickens, cows and pigs. The glycoproteins used were albumin
from chicken ovalalbumin (OVA) and, mucins of porcine stomach (PSM) and bovine
submaxillary glands (BSM). The mucins were selected because they are enriched in high
mannose, hybrid and complex N-linked and O-linked glycans; all usually being present in
cancer related targets.23 Similarly, OVA also includes complex N-linked glycans which
also make up the core of CAGs. Bovine Serum Albumin (BSA) is a negative glycan
control protein since it remains un-glycosylated.
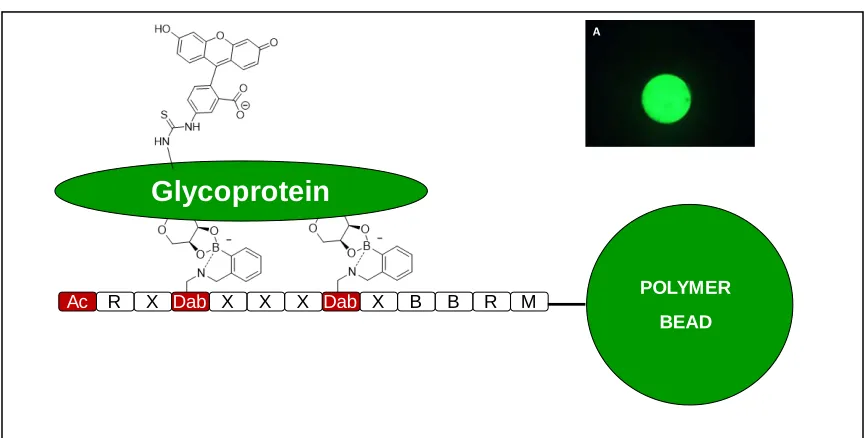
These glycoproteins/ proteins were fluorescently tagged and incubated with SLs. It is
established that higher the SL-glycoprotein binding, higher would be the fluorescence of
polymeric SL bead (Figure 1.10).
Synthetic lectin library design, optimization and peptide sequencing of the synthetic
lectins have been discussed in previous Lavigne et. al. work29, they will also be discussed
later in chapter 4.
Figure 1.10:Schematic representation of Boronic acid and SL interaction with a glycan or glycoprotein.
Greater SL-glycoprotein binding interaction involves greater bead fluorescence. Inset
A depicts image of a single polymeric SL bead under microscope.
Glycoprotein
Ac R X X X X X B B R M POLYMER
BEAD
Dab Dab
From the previously established work, several SLs were found to have higher
selectivity for a particular proof-of-concept glycoprotein (e.g. SL5 for PSM), have been
identified as SL ‘hits’. There are several SLs which are cross-reactive i.e. recognize more
than one glycoprotein in a unique manner (e.g. SL1). The earliest of selective hits and
cross-reactive SLs have been identified and their sequence is depicted in (Table 1.1).
Table 1.1: Synthetic Lectins (SLs) with their peptide sequences that show binding with the proof of concept glycoproteins.
(Dab)* means diaminobutanoic acid, the linker amino acid with phenyl boronic acid on its side chain. Each sequence has 3 arginines hence an overall charge of +3. Ac stands for acylation of N-terminus of the peptide sequence.
SL
Hit Sequence
Overall SL
charge Type
SL1 Ac-RG(Dab)*VTF(Dab)*R-BBRM-resin +3 cross-reactive
SL2 Ac-RT(Dab)*RFL(Dab)*V-BBRM-resin +3 moderately selective
SL3 Ac-RS(Dab)*VTT(Dab)*R-BBRM-resin +3 moderately selective
SL4 Ac-RR(Dab)*TQT(Dab)*Q-BBRM-resin +3 moderately selective
SL5 Ac-RA(Dab)*TRV(Dab)*V-BBRM-resin +3 highly selective
From the analysis, five SLs (designated SL1-SL5) were validated as hits, out of
which SL1 was highly cross-reactive towards all four glycoproteins, whereas SL2 and
SL5 showed selectivity towards a specific glycoprotein. A percentage change in binding,
(Figure 1.11) was obtained by dividing the fluorescence of a similarly sized set of SL
library from the difference between the fluorescence value of re-synthesized SL and
fluorescence value of the library. (Eq 1)
The library was used as a control because it contained all selective and cross-reactive
elements that could have interfered with the assessment of our binding.23
1.10SYNTHETIC LECTINS AND THEIR BINDING WITH CELL LINE PROTEINS
A four-component lectin array was assembled, which included both selective and
cross-reactive SLs (SL1, SL3, SL4 and SL5). This array could discriminate between five
common CAGs (TF antigen, Lea, Lex, sLea and sLex) with 95% accuracy.23 (figure not
included and this work will be discussed in detail later in chapter 4). Being that the SL
array response was able to discriminate between structurally similar polysaccharides (e.g.
sLea and sLex), the next step was to determine if the SLs were able to distinguish
differing cell lines of varying metastatic potential. Metastatic potential will be used Figure 1.11: Detected response from SL1-5 binding with four purified proteins as measured by fluorescence.
Certain SLs reported high selectivity for a specific protein (e.g. SL5 for PSM). SL1 remained cross-reactive for all four proteins. A percentage change in fluorescence obtained by using the average fluorescence of a set of SL library beads as a control. (The library control used because it contained all selective and cross-reactive elements that could have interfered with the assessment of binding). Signals represent average percentage change in luminosity with error bars displaying ±1
standard deviation. 0% 20% 40% 60% 80% 100% 120% 140%
SL1 SL2 SL3 SL4 SL5
throughout the duration of this dissertation. It will mean whether the cell line is
considered healthy/normal, cancerous non-metastatic/lowly-metastatic, and highly
metastatic. (Table 1.2) lists the cell lines used in the experiment described.
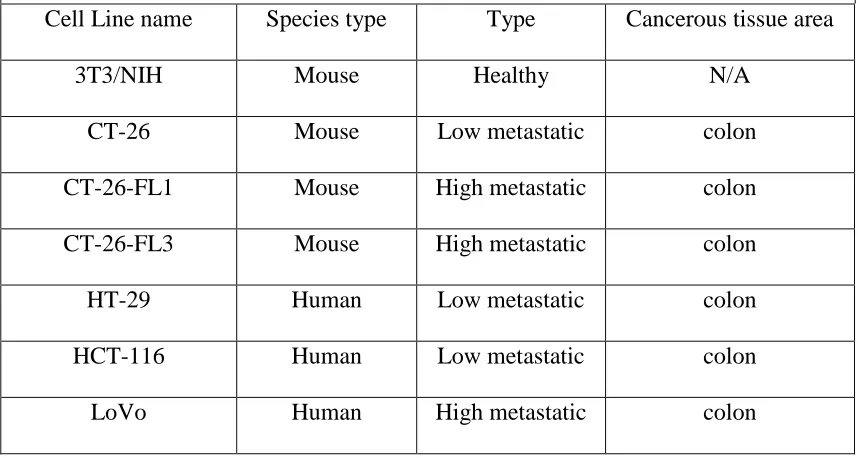
For each cell line the table lists the metastatic potential, cancer type (if applicable), and
the origin of the cancer cell line if it was metastatic, and the species this cancer is derived
from. For instance, LoVo is a human colon cancer metastatic cell line. While it is from
colon cancer, it had metastasized to its secondary site, lymph nodes. F1 and
CT26-FL3 are isogenic mouse cell lines meaning that they are derived from the same cell line,
CT26. For clarity, CT26 is non-metastatic/lowly metastatic with being only 0-5%
metastatic. CT26-F1 is metastatic with a rate of 50% metastatic, and CT26-FL3 is highly
metastatic with a rate of being 95% metastatic. The cell lines were grown according to
ATCC guidelines and the membrane proteins/glycoproteins were extracted using the
Qiagen® membrane extraction kit. Later, these proteins were fluorescently tagged using
Table 1.2 Colon cell lines used for SL binding analysis; listed is the species, cell type and origin of the cell lines.
Cell Line name Species type Type Cancerous tissue area
3T3/NIH Mouse Healthy N/A
CT-26 Mouse Low metastatic colon
CT-26-FL1 Mouse High metastatic colon
CT-26-FL3 Mouse High metastatic colon
HT-29 Human Low metastatic colon
HCT-116 Human Low metastatic colon
FITC and incubated with SL array containing only four lectins. The beads were analyzed
using fluorescence microscopy and imaged. The bright values were obtained using Adobe
Photoshop® as described earlier in this chapter. It is challenging to look at a bar graph to
decipher which responses are different, which is why a statistical method called linear
discriminant analysis (LDA) is used. LDA is a statistical program that tries to minimize
the separation within the same group, while maximizing the differences between other
groups. LDA is a guided statistical method, which means that the program knows which
group each data point should be in. (Figure 1.11) is the LDA plot generated from the data
obtained by incubating four SLs with six cell lines.
The fingerprint pattern was obtained and LDA was used to better distinguish the
similarities and differences in the array response. Interestingly, the four SLs selected for
this study were selected against ‘proof-of-concept’ glycoproteins. None of those Figure 1.12: Discrimination of healthy (♦), cancerous low metastatic (●) and metastatic (▲) colon cell lines using SL array shown by guided statistical grouping using linear discriminant analysis score plot.
The x-axis for discrimination correlates metastatic potential. This type of analysis minimizes the differences within a cell line and maximizes the variations among the cell lines. With SL array, we could observe 97% classification accuracy for three
glycoproteins were present in the cancer cell lines studied, thus illustrating the ability of
array to classify glycoproteins for which it was not originally designed. This
four-component SL array was assembled, and included both selective and cross-reactive SLs
(SL1, SL3, SL4 and SL5). They were able to discriminate classify seven different colon
cancer cell lines in three classes (healthy/cancerous/metastatic) with 97% accuracy23
1.11NON-COVALENT PROTEIN INTERACTIONS IN AQUEOUS ENVIRONMENT
The strongest of the non-covalent interactions include ionic and hydrogen
bonding, but while investigating proteins in aqueous solutions, these interactions become
irrelevant.64 Weaker or “non-conventional” hydrogen bonding interactions, like CH-π
interactions become stronger and more specific. CH-π interactions (first postulated by
Tamres in 1952) involve a CH group, which acts as the hydrogen bond donor (soft acid)
and the electrons of a π-system act as hydrogen acceptor (soft base).65 Nishio et. al.
reported that roughly 29% of all known organic crystal structures in the Cambridge
database containing a phenyl ring and an alkane region show an evidence of a CH-π
interaction. There exists a remarkable difference between the nature of a traditional
Pauling postulated strong hydrogen bond interactions and CH-π interactions.66
The conventional hydrogen bonds mainly contain electrostatic forces, whereas
“typical” CH-π interactions have a major contribution from London dispersion forces,
electrostatic forces and directional polarization.67 However, the magnitude of CH-π
interactions, is considerably smaller than that of a conventional H-bond. In gas phase, an
isolated and conventional neutral H-bond in chloroform solution has an enthalpy gain that
ranges from 1 to 7 kcal·mol-1. Conversely, the enthalpy of a single CH-π interaction is
Despite of the low enthalpic contribution, the total energy provided by CH-π
interactions is significantly greater and thus is due to the participation of multiple CH
and/or π-groups acting together in-sync (multivalency). The occurrence of multiple CH-π
interactions in a supramolecular assembly renders them quite important in terms of total
energy and preferred structure, but they do not have a significant role in controlling
relative orientations of molecules.
Consequently, CH-π interactions exist in a variety of phenomena including molecular
recognition, crystal engineering, supramolecular adhesives and the structure of many
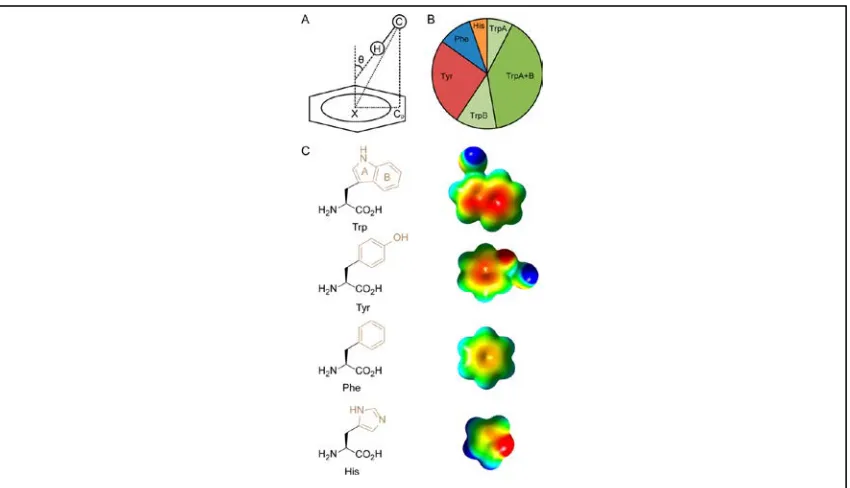
biomolecules.68-70 In (Figure 1.13) Hudson et. al. describe the parameters used to define
the strength of CH-π interactions between C-H donor of carbohydrates and pi-system of
Figure 1.13:(A) Parameters used to identify CH−π interactions:
CH−π angle (θ, ≤ 40°), CH−π distance (C-X, ≤ 4.5 Å), (B) Raw-count distribution of
aromatic side chains identified making CH−π interactions with carbohydrates. For
Trp, CH−π interactions identified for for both rings interacting with separate CH
proton. (C) Structure of aromatic amino acids, with corresponding electrostatic
surface potentials for the π-systems (highlighted in beige) of the side-chain moieties:
indole (Trp); phenol (Tyr); benzene (Phe); imidazole (His). To show the differences
in the π-systems, the scale is shown from ≥130 kJ mol–1 (electropositive, blue) to ≤
aromatic amino acids in proteins. While studying CH-π binding, they collected all data
(Protein Data Bank) for any interaction between atoms of amino acids with and any atom
of a carbohydrate moiety within 4.0 Å distance. Using this dataset and applying CH-π
measurement parameters (Figure 1.13A), they found out that aromatic residues contacted
carbohydrates in the order tryptophan (Trp) ≫ tyrosine (Tyr), Phenylalanine (Phe) >
histidine (His) (Figure 1.13B).71
Brandl et. al. examined a set of 1154 protein structures from the Protein Data Bank
for any CH-donor and pi-acceptor type interactions. They found out that the most
prominent interactions were between aliphatic CH donors and aromatic pi-acceptors and
interactions between aromatic CH donors and aromatic pi-acceptors. About half of all
Phenylalanine (Phe, F) and Tyrosine (Tyr, Y) –rings, were involved as acceptors in
CH-π-interactions. Aromatic CH groups as well as aliphatic side-chains of the long, extended
amino acid residues Lys, Arg and Met, and the Pro ring were preferred as donors.72
Besides CH-π interaction, there also exists cation-π type interactions that contribute to
protein folding as well. In gas phase the cation-π interaction energies between aromatic
amino acids (Phe, Tyr, and Trp) and the interaction energies of protonated amino acids
(Arg (+) and Lys (+)) are in the range from -9 to -18 kcal∙mol-1. In aqueous solutions, the
cation-π energies of H3O (+) and protonated amino acids are less affected by solvation
effects.73
The next chapter (chapter 2) describes various chemical modifications done to the
SLs (peptide sequences and boronic acid moieties) in order to establish structure and
activity relationships against purified glycoprotein analytes. The aim of these
Using what was learnt in chapter 2, several hypotheses were drawn on the design of new
SLs.
Chapter 3 aims at incorporating new SLs into the pre-existing SL array to investigate
colon and prostate cancer in vitro. The chemical makeup of the SLs which statistically
contributed the most to the cancer discrimination, is evaluated.
Chapter 4 details on quantifying sialic acid content in vitro and investigating any
correlations with the metastatic potential of colon and prostate cell lines. Based on the
relative importance that charged amino acids and phenyl boronic acids in SLs have at
evaluating metastatic potential; several tissue-specific SLs were found and their peptide
1.12REFERENCES
1. Ferlay, J.; Soerjomataram, I.; Ervik, M.; Dikshit, R.; Eser, S.; Mathers, C. Cancer
Incidence and Mortality Worldwide: IARC. International Agency for Research on
Cancer GLOBOCAN 2012.
2. Society, A. C., Cancer Facts and Figures 2017, pp 1-76.
3. Ries, L.; Melbert, D.; Krapcho, M. SEER Cancer Statistics Review, 1975–2004,
National Cancer Institute, 2007.
4. Zuckerman, D.R.; Rockey, D.C. A prospective multicenter evaluation of new fecal
occult blood tests in patients undergoing colonoscopy. Am. J. Gastroenterol. 2000,
95, 1331-1338.
5. Singh, H. N. Z.; Demers, A.A.; Kliewer, E.V.; Mahmud, S.M.; Bernstein, C.N. The
reduction in colorectal cancer mortality after colonoscopy varies by site of the cancer.
Gastroenterology2010,139, 1128-1137.
6. Levi, Z. B., S.; Vilkin, A.; Bar-Chana, M.; Lifshitz, I.; Chared, M.; Maoz, E.; Niv,Y.
A higher detection rate for colorectal cancer and advanced adenomatous polyp for screening with immunochemical fecal occult blood test than guaiac fecal occult blood test, despite lower compliance rate. A prospective, controlled, feasibility study.
International J. of Cancer2011,128 (10), 2415-2424.
7. Gupta, S. S., D.A.; Doubenia, C.A.; Anderson, D.S.; Lukejohn, D.; Deshpande, A.R.;
Elmunzer, B.J.; Laiyemo, A.O.; Mendez, J.; Somsouk, M.; Allison, J.; Bhuket, T.l.; Geng, Z.; Green, B.B.; Itzkowitz, S.H.; Martinez, M.E., Challenges and possible
solutions to colorectal cancer screening for the underserved. J. of the National Cancer
Institute2014,106 (4).
8. Gupta, S. H., E.A.; Rockey, D.C.; Hammons, M.; Koch, M.; Carter, E.; Valdez, L.;
Tony, L.; Ahn, C.; Kashner, M.; Argenbright, K.; Tiro, J.; Geng, Z.; Pruitt, S.; Skinner, C., Comparitive effectiveness of fecal immunochemical test outreach, colonoscopy outreach, and usual care for boosting colorectal cancer screening among
the underserved. JAMA Internal Medicine2013,173 (18), 1725-1732.
9. Quintero, E. C., A.; Bujanda, L.; Cubiella, J. et al, Colonoscopy versus fecal
immunochemical testing in colorectal-cancer screening. New England Journal of
Medicine2012,366, 697-706.
10.Han–Mo Chiu, Y. C. L., Chia–Hung Tu, Chien–Chuan Chen, Ping–Huei Tseng, Jin–
Tung Liang, Chia–Tung Shun, Jaw–Town Lin, Ming–Shiang Wu, Association between early stage colon neoplasms and false-negative results from the fecal
immunochemical test. Clinical Gastroenterology and Hepatology 2013, 11 (7),
832-838.
11.Postma, R.; Schroder, F. H.; van Leenders, G. J.; Hoedemaeker, R. F.; Vis A. N.;
Roobol, M. J. Cancer detection and cancer characteristics in the European Randomized Study of Screening for Prostate Cancer (ERSPC) – Section Rotterdam.
12.Schröder, F. H.; van der Cruijsen-Koeter, I.; de Koning H. J.; Vis A. N.; Hoedemaeker, R. F.; Kranse, R.; Prostate cancer detection at low prostate specific
antigen. J Urol.2000,163, 806–812.
13.Schroder, F. H.; van der Maas, P.; Beemsterboer, P.; Kruger, A. B.; Hoedemaeker,
R.; Rietbergen, J. Evaluation of the digital rectal examination as a screening test for prostate cancer. Rotterdam section of the European Randomized Study of Screening
for Prostate Cancer. J Natl Cancer Inst.1998, 1817–1823.
14.Fakih, M.G.; Aruna, P. CEA monitoring in colorectal cancer: what you should know.
Oncology 2006,20, 579-587.
15.Passerini, R.; Cassatella, M. D.; Boveri, S.; Salvatici, M.; Radice, D.; Zorzino, L.;
Galli, C.; Sandri, M. T. The Pitfalls of CA19-9: Routine Testing and Comparison of
Two Automated Immunoassays in a Reference Oncology Center. Am J Clin Pathol
2012,138 (2): 281-287.
16.Bast, R. C., Jr.; Ravdin, P.; Hayes, D. F.; Bates, S.; Fritsche, H., Jr.; Jessup, J. M.;
Kemeny, N.; Locker, G. Y.; Mennel, R. G.; Somerfield, M. R. 2000 update of recommendations for the use of tumor markers in breast and colorectal cancer:
clinical practice guidelines of the American Society of Clinical Oncology. J Clin
Oncol. 2001,19 (6), 1865-78.
17.Candas, B.; Cusan, L.; Gomez, J. L.; Diamond, P.; Suburu, R. E.; Lévesque, J.
Evaluation of prostatic specific antigen and digital rectal examination as screening
tests for prostate cancer. Prostate2000,45, 19–35.
18.Brawer, M. K.; Lange, P. H. Prostate-specific antigen in management of prostatic
carcinoma. Urology1989,33 (5), 11–16.
19.Barry, M. J., Prostate-Specific–Antigen Testing for Early Diagnosis of Prostate
Cancer. New England Journal of Medicine2001,344 (18), 1373-1377.
20.Hollingsworth, M.A; Swanson, B.J. Mucins in cancer: Protection and control of the
cell surface. Nature Rev. Cancer 2004,4, 45-60.
21.Gu, J.; Taniguchi, N. Potential of N-glycan in cell adhesion and migration as either a
positive or negative regulator, Cell Adh Migr.2008,2, (4), 243–245.
22.Dell, A.; Galadari, A.; Sastre, F.; Hitchen, P., Similarities and Differences in the
Glycosylation Mechanisms in Prokaryotes and Eukaryotes. International Journal of
Microbiology 2010,2010, 1-14.
23.Dube, D.H.; Bertozzi, C.R. Glycans in cancer and inflammation, potential for
therapeutics and diagnostics. Nature Reviews2005,4, 477-488.
24.Munkley, J. E.; Hallmarks of glycosylation in cancer. Oncotarget 2016, 7 (23),
35478-35483.
25.Taniguchi, N., Korekane, H. Branched N-glycans and their implications for cell
adhesion, signaling and clinical applications for cancer biomarkers and in
26.Meezan, E.; Wu, H.C.; Black, P.H.; Robbins, P.W. Comparative studies on the carbohydrate-containing membrane components of normal and virus-transformed
mouse fibroblasts. J.Am.Chem. Soc.1969,8, 2518-2524.
27.Turner, G.A. N-glycosylation of serum proteins in disease and its investigation using
lectins, Clinica Chimica Acta. 1992,3, 149–171.
28.Bicker, K.L.; Sun, J.; Lavigne, J.J Boronic acid functionalized peptidyl synthetic
lectins: combinatorial library design, Peptide sequencing, and selective glycoprotein
recognition. ACS Comb. Sci. 2011,13, 232-243.
29.Bicker, K.L.; Sun, J.; Lavigne, J.J. Synthetic lectin arrays for the detection and
discrimination of cancer associated glycans and cell lines. Chem. Sci. 2012,3,
1147-1156.
30.Magnani, J.L. Arch. Biochem. Biophys.2004,426, 122-131.
31.Mody, R.; Joshi, S.; Chaney, W. Use of lectins as diagnostic and therapeutic tools for
cancer. J. Pharm. & Toxic. Methods1995, 33.
32.Shui, W.; Li, Z. Glycoproteomic analysis of tissues from patients with colon cancer
using lectin microarrays and nanoLC-MS/MS.Mol. BioSyst. 2013,9, 1877.
33.Berg, J. M.; Stryer, L. Biochemistry. In Biochemistry, 5th ed.; W.H. Freeman: New
York 2002, (5).
34.Patwa, T. H. Z., J.; Andersone, M.A.; Simeone, D.M.; Lubman, D.M., Screening of
Glycosylation Patterns in Serum Using Natural Glycoprotein Microarrays and
Multi-Lectin Fluorescence Detection. Anal. Chem.2006, 78, 6411-6421.
35.Zhao, J.; H. Z., J.; Andersone, M.A.; Simeone, D.M.; Lubman, D.M., Glycoprotein
Microarrays with Multi-Lectin Detection: Unique Lectin Binding Patterns as a Tool
for Classifying Normal, Chronic Pancreatitis and Pancreatic Cancer Sera Anal. Chem.
2006, 78, 6411-6421.
36.Oshovsky, G. V.; Reinhoudt, D. N.; Verboom, W., Supramolecular Chemistry in
Water. Angew, Chem. Int. Ed. 2007,46 (14), 2366-2393.
37.Collins, B. E.; Sorey, S.; Hargrove, A. E.; Shabbir, S. H.; Lynch, V. M.; Anslyn, E.
V., Probing Intramolecular B−N Interactions in Ortho-Aminomethyl Arylboronic
Acids. J. Org. Chem.2009,74 (11), 4055-4060.
38.Yoon, J.; Czarnik, A. W., Fluorescent chemosensors of carbohydrates. A means of
chemically communicating the binding of polyols in water based on
chelation-enhanced quenching. J. Am. Chem. Soc.1992,114 (14), 5874-5875.
39.DiCesare, N.; Lakowicz, J. R., Spectral Properties of Fluorophores Combining the
Boronic Acid Group with Electron Donor or Withdrawing Groups. Implication in the
Development of Fluorescence Probes for Saccharides. The Journal of Physical
Chemistry A2001,105 (28), 6834-6840.
40.James, T. D.; Sandanayake, K. R. A. S.; Iguchi, R.; Shinkai, S., Novel
Saccharide-Photoinduced Electron Transfer Sensors Based on the Interaction of Boronic Acid