R E S E A R C H
Open Access
SAR image target detection in complex
environments based on improved visual attention
algorithm
Shuo Liu
*and Zongjie Cao
Abstract
A novel target detection algorithm for synthetic aperture radar (SAR) images based on an improved visual attention method is proposed in this paper. With the development of SAR technology, target detection algorithms are confronted with many difficulties such as a complicated environment and scarcity of target information. Visual attention of the human visual system can make humans easily focus on key points in a complex picture, and the visual attention algorithm has been used in many fields. However, existing algorithms based on visual attention models cannot obtain satisfactory results for SAR image target detection under complex environmental conditions. After analysing the existing visual attention models, we combine the pyramid model of visual attention with singular value decomposition to simulate the human retina, which can make the visual attention model more suitable to the characteristics of SAR images. We introduce variance weighted information entropy into the model to optimize the detection results. The results obtained by the existing visual attention algorithm for target detection in SAR images yield a large number of false alarms and misses. However, the proposed algorithm can improve both the efficiency and accuracy of target detection in a complicated environment and under weak-target conditions. The experimental results validate the performance of our method.
Keywords:Visual attention; Singular value decomposition; Variance weighted information entropy (WIE); Target detection; SAR image
1 Introduction
The visual attention model for synthetic aperture radar (SAR) image target detection plays a positive role be-cause the human visual system focuses on the areas of interest and rapidly decides on them [1]. Visual attention greatly improves the ability of the human visual system to deal with images under a complex environment. Therefore, a positive effect can be gained by introducing visual attention into target detection in SAR images.
With the continuous development in military technol-ogy, target detection in a SAR image becomes more dif-ficult. The environment around targets becomes more complicated, and information on targets lessens. Trad-itional detection methods for SAR images such as con-stant false alarm rate (CFAR) have been improved to adapt different conditions, but they are also difficult to perform outstandingly. The reason is that under a
complicated environment and weak-target condition, key pixels are lacking and interference pixels are too much. Limited improvements cannot compensate for defects. Existing visual attention models generally use the Gauss-ian pyramid model proposed by Burt and Crouely to simulate the feature of the human retina [2]. The feature can be described by considering that the centre of the retina has a smaller receptive field; on the other hand, the receptive field at the periphery of the retina is much bigger [3]. Therefore, we can conclude that as the fea-ture sampling density and visual resolution of a position become smaller with the increase in distance from the centre of the human retina, the peripheral information is compressed [4]. After building a Gaussian pyramid model, the visual attention system guides the attention to an area of interest according to some features of a tar-get, such as the shape, colour and intensity [5]. Current visual attention methods are not suitable for target de-tection in a complicated environment or under weak-target conditions [6].
* Correspondence:[email protected]
School of Electronic Engineering, University of Electronic Science and Technology of China, Chengdu 611731, China
The Gaussian pyramid model of visual attention suffers from the difficulty of effectively compressing a SAR image with weak targets. But compressing an image to different rates and keeping important information is of importance for the visual attention algorithm. Therefore, this paper proposes a new visual attention algorithm for target detec-tion. Since the singular value decomposition (SVD) method can keep the important information of a SAR image when the image is compressed [7], combining it with the Gauss-ian pyramid model can produce images with different com-pression ratios, which enable the image to retain the target information and well obscure the environment information. After combining SVD with the Gaussian pyramid model, the variance weighted information entropy (WIE) method is used to distinguish the different types of areas and filter out the regions of interest (ROIs) without targets. As a re-sult, the purpose of efficient target detection under a com-plicated environment and weak targets can be achieved.
The remainder of this paper is structured as follows: Section 2 introduces in detail the classic visual attention model and the pyramid model. Section 3 presents the steps of each detection stage and focuses on the SVD method and the variance WEI. Section 4 presents the ex-perimental results of the SAR target extraction using the proposed techniques, and Section 5 draws the conclusion.
2 Classic visual attention model
The algorithm proposed in this paper is an improvement of Itti. Itti is a classic visual attention model. The Itti model determines the ROI in human eyes, which includes the target to be detected as a set of significant pixels in images, and then extracts the ROI by finding a significant pixel in the image [8-10]. The model can adaptively detect the ROIs in the image. Compared with most of the trad-itional algorithms that need to manually specify the ROI, the Itti model enjoys great advantages in target detection and recognition in image processing. Here, we first intro-duce the calculation process of the Itti model, and the de-tails can be found in the literature [11]. Then, we describe the details on building the pyramid model.
For an image, the first part of the visual attention model is the linear filter, which extracts the colour, intensity and orientation features from the image. For example, the Itti model makes the output of the Gabor filter in four differ-ent directions become the oridiffer-entation feature. The for-mula for the Gabor filter is expressed as follows:
h x;ð y;θi;λ;α;βÞ ¼
whereαandβare the standard deviation,λis the wave-length andθis the direction. The formulas ofxθi andyθi are shown as follows:
xθi ¼xcosð Þ þθi ysinð Þθi ð2Þ
yθi¼−xsinð Þ þθi ycosð Þθi ð3Þ
Then, we build a Gaussian pyramid for every feature. In the second part, a centre-surround difference module is used to extract the feature map. In the third part, a plurality of different feature maps is merged to form the conspicuity map, which is a saliency map, through an ef-fective feature consolidation strategy. In the fourth part, the focus of the attention area is located based on the saliency map. In the final part of the visual attention model, the winner-take-all competition net is used to find the most significant point from the saliency map, and the inhibition-of-return is used to ensure that the area would not be focused again [12-14].
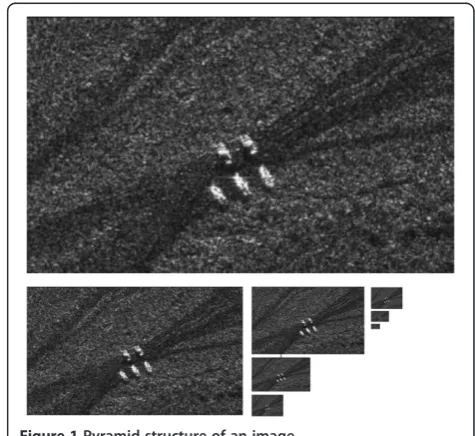
The visual attention model adopts the multi-scale spatial attention to simulate the nonuniform sampling mechanism of the human retina [15]. Burt and Crouely proposed a pyramid structure from the summary of the nonuniform sampling mechanism [16]. Figure 1 shows the pyramid structure of an image.
Two steps are needed to establish the pyramid struc-ture: one is smoothing and the other is downsampling. For a two-dimensional digital image I(i,j), δ represents the pyramid layers. When δ= 0, the formulaIδ(i,j) =I0
(i,j) =I indicates the bottom of the pyramid structure.
Hence, the calculation of the pyramid layers is shown
The Itti model adopts the linear discrete Gaussian fil-ter to perform the smoothing and downsampling in the horizontal and vertical directions of the input image, re-spectively, and forms eight different resolution sub-images [17]. Including the original image, nine sub-images are required to build up the Gaussian pyramid structure. The smoothing filter is [1 4 6 4 1], and downsampling is achieved by a convolution with a [1 1]/2 filter. We use the two filters to achieve our objective, which take the average value of every two pixels in the previous image as one pixel value in the next image. The two steps can be combined into a convolution with a filterK= [1 4 6 4 1]*[1 1]/2 in the horizontal and vertical directions.
3 Improved visual attention model
In recent years, the SVD algorithm has been widely studied. This algorithm extracts the algebraic feature from an image [18]. SVD has the characteristics of en-ergy aggregation for an image [19], which makes it a popular technology in the area of image compression. The features represent the essential characteristics of an image; therefore, the SVD algorithm has the advantage of being insensitive to noise and complexity of an image. The variance WEI is a statistical form of the characteris-tics, which reflects the average information of a figure. It was first used to detect infrared images [20].
3.1 SVD integrated into visual attention
The SVD technique has been paid close attention since its introduction and has been widely used in statistical analysis, signal processing and system theory. The SVD is an extension of the spectral analysis theory. It is es-sentially an orthogonal transformation. If a matrix has a linearly correlated row or column, it can be changed into a diagonal matrix by multiplying the orthogonal matrix on the left with that on the right [21]. After the change, we can obtain some singular values whose number re-flects the independent row (column) vector number of the original matrix. The eigenvalues can construct each individual component of the original signal. The SVD technique has the advantage of fast processing and handing stability. The SVD in modern linear algebra and signal processing theory is defined as follows: ifA∈Rm×n exists, then orthogonal matrices U∈Rm×n andV∈Rm×n exist. The formula is obtained as follows:
A¼UΣVT A¼UΣVH ð5Þ The diagonal elements are arranged in a descending order:
σ1≥σ2≥⋯≥σn≥0;r¼rankð ÞA ð8Þ
To make the visual attention model adjust to the tar-get detection in a complicated-environment SAR image, we combine SVD with the pyramid model. This combin-ation can compress the original image to a number of images with different compression rates. The informa-tion about the targets in the resulting images with dif-ferent compression rates is retained and that on the environment is obscured. This result allows the centre-surround module to find the saliency point more ef-fectively and optimise the detection results under a complicated environment.
The major steps of the proposed SVD-pyramid model method are as follows:
For an original imageA, it is decomposed into a diagonal matrixBand another two orthogonal matrices using SVD.
The number of nonzero elementsRis computed, and the elements are arrayed in a descending order to form vectorP.
Themnumber of biggest elements from vectorPis retained. The remaining elements form vectorQ. The value ofmis equal to 60% ofR.
A new diagonal matrixB1 is constructed using the elements of vectorQ.
A new imageA1 is generated using the diagonal matrixB1 and the two orthogonal matrices. The above steps are repeated until the number of
nonzero elements is less than 1 orR× 0.02.
3.2 Post-processing based on the WIE algorithm
Entropy reflects the average information of a figure. The one-dimensional graph entropy can be expressed as
H¼X255
i¼0
pilogpi ð11Þ
different radiation and usually have a distinct grey value. The WIE algorithm is defined as follows:
H sð Þ ¼−X
255
s¼0
s−s
ð Þ
2
Ps log Psð Þ ð12Þ
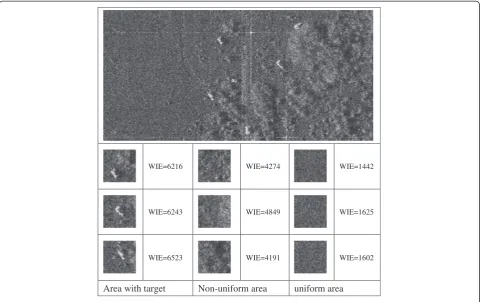
where Ps is the probability of the grey levels in the infra-red image and s is the mean intensity of the infrared image. In particular, when Ps = 0, we let Ps log (Ps) = 0. Considering that the result of the improved visual atten-tion method needs to filter out the false alarms, in this study, we import WIE to achieve this purpose. We test the value of WIE from different areas in a real SAR
image. The results show that different types of regions correspond to a large difference in the WIE value, and similar types of regions correspond to a small difference in the WIE value. When the ROI areas are detected, we compute the values of WIE of these areas and array them in a descending order. Then, we calculate the dif-ferences between adjacent values and array them in an ascending order. Next, we abandon several largest values in sequence 2 and calculate the mean value in sequence 2 as a threshold value. The values in the threshold value region are corresponding to areas with a target. From this result, we can filter out the area without targets. Figure 2 shows the simulation results. The size of all
WIE=6216 WIE=4274 WIE=1442
WIE=6243 WIE=4849 WIE=1625
WIE=6523 WIE=4191 WIE=1602
Area with target Non-uniform area uniform area
Figure 2The WIE value with different types of areas.
samples is 45 × 45 pixels. The sample is divided into three types, which are the area that includes the up and down, the area that contains the target and the uniform area.
The above results show that the WIE value of a real SAR image in different areas has a large difference. Based on the difference, we can determine the areas
without targets. Therefore, the WIE method can be used to achieve the post-processing of the target detection.
3.3 Processing steps
The flow chart of the visual attention based on the SVD algorithm and WIE method mentioned earlier is shown in Figure 3.
(b)
(a)
(c)
(d)
Figure 4The test image and results by different algorithms in a simple environment. (a)The test image of a simple environment.(b)The result of the Itti model algorithm in a simple environment.(c)The result of the two-parameter CFAR method in a simple environment.(d)The result of the improved VA algorithm in a simple environment.
(a)
(b)
(c)
(d)
Because the algorithm employed in this study is based on the Itti model, the detailed steps of the algorithm will not be presented. In the feature extraction module, we use the features that include the intensity, colour, orientation and consistency. In the centre-surround difference module, the no. 2, 3 and 4 images are selected as the centre image, and the numbers of the surround images are 2, 3 and 4.
4 Simulation and results 4.1 Simulation
To verify the feasibility of the proposed algorithm, sev-eral simulations are performed. The simulation data are divided into two types, i.e. type 1 and type 2. Type 1 consists of 20 images, and the size of each image is 384 × 256. These are images in a simple environment and conspicuous target conditions. These targets are tanks in a grassland environment. Type 2 consists of im-ages in a complicated environment and weak targets, and the size of each image is 2,406 × 512. The targets are tanks in grassland and jungle environment.
The simulations are divided into three parts. The first part is the simulation using the Itti model. The second
part is the simulation using the proposed algorithm. The last part is the simulation using the two-parameter CFAR. This detection method is a pixel-level target detection method. The reason we choose CFAR for comparison is that the algorithm is not only the most in-depth and most practical but also an extensive method of a class at present. The simulation of each part satisfies two premises, i.e. simple environment and conspicuous target condition and complicated environment and weak-target condition. Figure 4a shows the test image for the first type of data, which are under the simple environment and conspicuous target conditions. Figure 4b,c,d shows the results ob-tained by the three algorithms. In the figures, red lines and yellow lines show the shifting route and size of FOA, respectively.
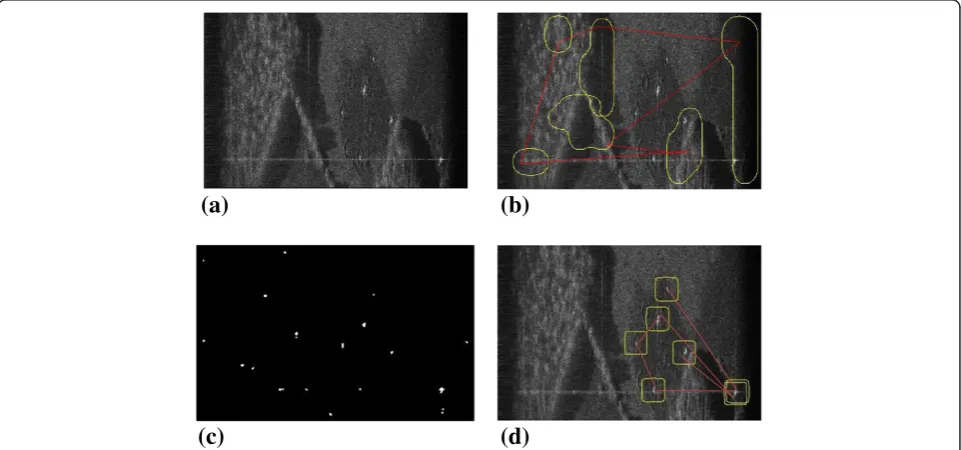
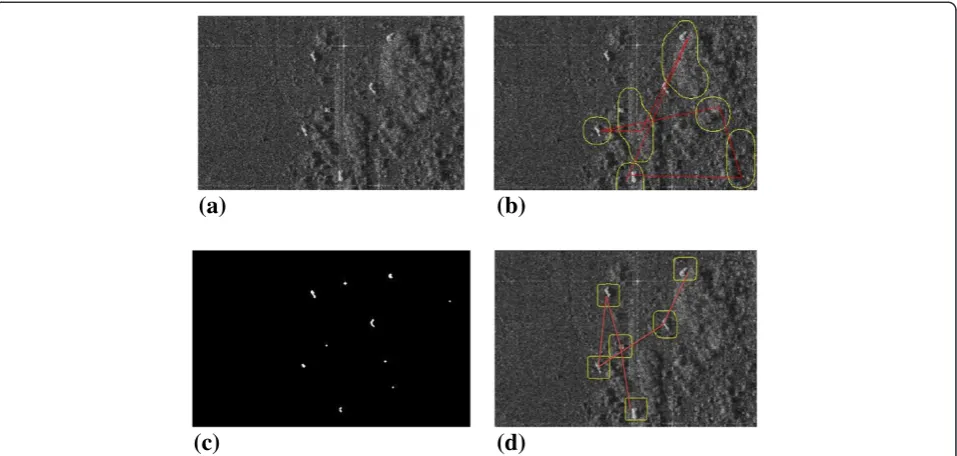
To verify the performance of the improved algorithm under a complicated environment, we perform another simulation using the type 2 data. Figures 5a and 6a show the test images of the type 2 data. They are obtained at different levels of complexity condition. Figures 5b,c,d and 6b,c,d show the results obtained by the three algorithms.
(a)
(b)
(c)
(d)
Figure 6The results of test image 2 by different algorithms in a complicated environment. (a)The test image of a complicated environment.(b)The result of the Itti model algorithm in a complicated environment.(c)The result of the two-parameter CFAR method in a complicated environment.(d)The result of the improved VA algorithm in a complicated environment.
Table 1 Whole performance comparisons among the three algorithms in a simple environment
Number of all targets
Number of detected targets
False alarms
Number of undetected targets
Size of FOA (number of pixels)
Classic algorithm 4 4 0 0 2,000 to 7,000 (large)
CFAR 4 4 0 0
4.2 Results
In the two data types for the simulation, we obtain the following results by comparing the three algorithms. The results are divided into two parts. First, for the data in the simple environment and weak target case, the re-sults are listed in Table 1. The three methods yield four focus of attention (FOA) areas, and the four areas detect the targets well. All three methods do not yield false alarms and undetected targets. We compare the size of the FOA for two kinds of visual attention algorithm. The size of the FOA is measured by the number of pixels in the FOA. Through the simulation, the number of pixels in the FOA in the classic algorithm is 2,000 to 7,000, and it is 1,000 to 1,500 in the proposed algorithm. Therefore, the size of the FOA in the improved method is smaller.
From the type 2 data obtained by the simulation, we obtain the results listed in Table 2. Six targets are present in the SAR image. From the classic algorithm, in the six FOA areas obtained by the Itti model, only three areas cover the targets. The others cover shadow and empty areas. The two-parameter CFAR method detected ten targets. Although the six targets are detected, four false alarms occur. On the other hand, all six target areas obtained by the proposed algorithm exactly cover the targets. In the classic algorithm, the number of pixels in the FOA is 2,000 to 9,000, and in the proposed algo-rithm, it is 1,000 to 1,500. Thus, the FOA size in the im-proved method is also smaller.
By comparing the detected rates, we determine that the performance of the classic algorithm is significantly
lower than that of the other two algorithms and the pro-posed algorithm performs best. From the comparison of the false alarm rates, the false alarm rate and misses of the classic algorithm are high. Although the CFAR method successfully detects all the targets, the false alarm rate is higher than that of the proposed method. The detected rate is defined as the ratio of the number of correct detected target to real target. The false alarm rate is defined as the ratio of the number of false de-tected target to real target. By comparing the three methods, the classic method produces too many false alarms which affect the detection accuracy. Itti model methods miss a lot of targets, but the proposed method can make up for the lack. In summary, the proposed al-gorithm can obtain not only a high detection rate but also a low false alarm rate. The improved visual atten-tion algorithm can adapt to the condiatten-tions of a compli-cated environment and weak target.
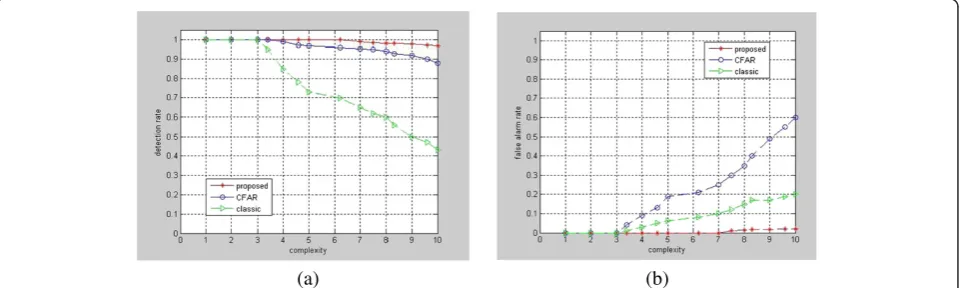
After comparing the performance of the three methods, we study the effect of image complexity on the detection performance of the three methods. We use the GLCM features to describe the spatial distribution and whole complexity of an image. The features include the angular second moment, entropy, inverse different moment and contrast. Figure 7 shows the result.
Figure 7 shows that the detection rate of the classic method rapidly decreases. Because the complexity of the image increases, the background becomes complicated, and the classic method detects more complicated re-gions than real targets. The detection rate of the CFAR method decreases slowly. It is based on a large number
Table 2 Whole performance comparisons among the three algorithms in a complicated environment
Number of
Classic algorithm 13 12 6 7 2,000 to 9,000 (large)
CFAR 13 27 14 0
-The proposed algorithm 13 13 0 0 1,000 to 1,500 (small)
(a) (b)
of false alarms. With the increase in complexity, the detec-tion efficiency rapidly decreases. The proposed method yields better results in both detection and false alarm rates.
5 Conclusions
In this study, we have developed an improved visual at-tention algorithm adapted to SAR image target detection under complicated environment and weak-target condi-tions. The method of combining SVD with the pyramid model and using WIE to filter out the false alarms has been introduced in detail. To validate the performance of the method, some simulations were performed. The results show the feasibility of the improved visual atten-tion algorithm to SAR image target detecatten-tion under complicated environment conditions.
Competing interests
The authors declare that they have no competing interests.
Acknowledgements
This work was supported in part by the National Natural Science Foundation of China under Projects 60802065, 61271287 and 61371048.
Received: 2 January 2014 Accepted: 26 March 2014 Published: 5 April 2014
References
1. DB Walther, C Koch, Attention in hierarchical models of object recognition. Prog. Brain Res.165, 57–78 (2007)
2. L Itti, C Koch, Computational modeling of visual attention. Nat. Neurosci. 2, 194–203 (2001)
3. D Walther,Interactions of visual attention and object recognition: computational modeling, algorithms, and psychophysics. PhD thesis (California Institute of Technology, Pasadena, CA, 2006)
4. JK Tsotsos, Y Liu, J Martinez-Trujillo, M Pomplun, E Simine, K Zhou, Attending to visual motion, computer vision and image understanding. Spec. Issue Attention Perform. Comput. Vision100, 3–40 (2005)
5. V Navalpakkam, L Itti, An integrated model of top-down and bottom-up attention for optimal object detection, inProc. IEEE Conference on Computer Vision and Pattern Recognition (CVPR)(New York, June 2006), pp. 2049–2056 6. J Feng, Z Cao, Y Pi, Multiphase SAR image segmentation with G0 statistical
model based active contours. IEEE Trans. GRS51(7), 4190–4199 (2013) 7. IA Rybak, VI Gusakova, AV Golovan, LN Podladchikova, NA Shevtsova, A
model of attention-guided visual perception and recognition. Vis. Res. 38, 2387–2400 (1998)
8. S Shah, MD Levine, Visual information processing in primate cone pathways-part. I. A model, systems, man, and cybernetics. IEEE Trans.2, 259–274 (1996) 9. Z Li, L Itti, Saliency and gist features for target detection in satellite images.
IEEE Trans. Image Process.20(7), 2017–2029 (2011)
10. R Desimone, J Duncan, Neural mechanism of selective visual attention. Annu. Rev. Neurosci.18, 193–194 (1995)
11. S Lee, K Kim, JY Kim, M Kim, HJ Yoo, Familiarity based unified visual attention model for fast and robust object recognition. Pattern Recogn. 43(3), 1116–1128 (2010)
12. AM Treisman, G Gelade, A feature-integration theory of attention. Cogn. Psychol. 12, 97–136 (1980)
13. K Cater, A Chalmers, G Ward, Detail to attention: exploiting visual tasks for selective rendering, inProc. 14th Eurographics Workshop Rendering (Eurographics Association, Aire-la-Ville, 2003), pp. 270–280
14. L Itti, C Koch, E Niebur, A model of saliency-based visual attention for rapid scene analysis, pattern analysis and machine intelligence. IEEE Trans.20, 1254–1259 (1998)
15. I Rigas, G Economou, S Fotopoulos, Low-level visual saliency with application on aerial imagery. Geosci. Remote Sens. Lett. IEEE10, 1389–1393 (2013)
16. A Borji, L Itti, Exploiting local and global patch rarities for saliency detection, inProc. IEEE Conference on Computer Vision and Pattern Recognition(Providence, 2012), pp. 478–485
17. D Walther, U Rutishauser, C Koch, P Perona, Selective visual attention enables learning and recognition of multiple objects in cluttered scenes. Comput Vision Image Understanding100(1–2), 41–63 (2005)
18. H Andrews, C Patterson, Singular value decomposition (SVD) image coding. IEEE Trans. Commun.24(4), 425–432 (1976)
19. B Arnold,An investigation into using singular value decomposition as a method of image compression(Department of Mathematics and Statistics, University of Canterbury, 2000)
20. L Yang, Y Zhou, J Yang, Variance WIE based infrared images processing. Electron. Lett.42(15), 857–859 (2006)
21. R Ruotolo, C Surace, Using SVD to detect damage in structures with different operational conditions. J. Sound Vib.226(3), 425–439 (1999)
doi:10.1186/1687-1499-2014-54
Cite this article as:Liu and Cao:SAR image target detection in complex environments based on improved visual attention algorithm.EURASIP Journal on Wireless Communications and Networking20142014:54.
Submit your manuscript to a
journal and benefi t from:
7Convenient online submission
7Rigorous peer review
7Immediate publication on acceptance
7Open access: articles freely available online
7High visibility within the fi eld
7Retaining the copyright to your article