DEVELOPMENT AND OPTIMIZATION OF ENZALUTAMIDE-LOADED SOLID LIPID
NANOPARTICLES USING BOX–BEHNKEN DESIGN
TARAKA SUNIL KUMAR K
1,2*, MOHAN VARMA M
2, RAVI PRAKASH P
31Department of Pharmaceutics, Jawaharlal Nehru Technological University, Kukatpally, Hyderabad-500072, Telangana, India. 2Department of Pharmaceutics, Sri Vishnu College of Pharmacy, Bhimavaram, Andhra Pradesh, India. 3Department of Pharmaceutics,
Creative Educational Society’s College of Pharmacy, Kurnool, Andhra Pradesh, India. Email: [email protected] Received: 22 December 2018, RevisedandAccepted: 22 April 2019
ABSTRACT
Objective: The primary motive behind this investigation is to develop and optimize the solid lipid nanoparticles formulation of enzalutamide for the effective drug delivery.
Materials and Methods: The formulation variables were optimized using design of experiments. Box–Behnken design was used for the study and the results were analyzed using response surface methodology. The prepared nanoformulation was characterized for particle size, zeta potential, surface morphology, X-ray diffractometry (XRD), invitro drug release kinetics, and stability study.
Results: The influence of formulation variables, drug-to-lipid ratio, concentration of phosphatidylcholine, and concentration of poloxamer 188 were evaluated by regression analysis. The optimized formulation (F3) was found to have the minimum particle size (253 nm) with maximum entrapment efficiency (89.72%) and drug loading (23.84%). From SEM studies, the data showed a spherical shape for enzalutamide nanoparticles with uniform and relatively narrow particle distribution. From XRD examines, it is demonstrative that the drug was not in crystalline form in nanoformulation when compared with pure drug. Invitro release studies disclosed that maximum cumulative drug release was attained by F3 (99.72%) in controlled manner. The optimized formulation of enzalutamide followed zero-order release kinetics with a strong correlation coefficient (R2 = 0.9994).
Conclusion: The nanoformulation prepared under optimized conditions is in concurrence with the expected results. The SLN formulation can be used as a potential carrier for the effective delivery of enzalutamide.
Keywords: Enzalutamide, Box–Behnken design, Prostate cancer, Solid lipid nanoparticle, Trimyristin, Zero-order kinetics.
INTRODUCTION
The emerging field of nanotechnology seeks to exploit distinct technological advantages of nanoscience. The booming nanotechnologies are supported by massive state investments in many countries [1]. Solid lipid nanoparticles (SLNs) are an alternative carrier system used to stack the drug for targeting, to improve the bioavailability by the enhancement of drug solubility and protection against presystemic metabolism. The circumvention of presystemic metabolism is attributed to the nanometric size range, which makes the drug not to be uptaken by the liver from the delivery system for the process of metabolism [2].
SLNs are classically spherical with a mean diameter ranging from 1 to 1000 nm. It is a substitutive carrier system to traditional colloidal carriers such as emulsions, liposomes, and polymeric micro- and nano-particle [3]. SLN can be defined as colloidal drug delivery system consisting of solid lipid and stabilized with surfactant with particle size ranging from 10 nm to 1000 nm [4]. For the preparation of SLN, several factors are to be considered which include effect of lipids and surfactants [5] processing parameters such as homogenization and sonication, formulation parameters such as drug-to-lipid ratio, lipid type and concentration, surfactant type, and concentration [6]. Recently, much emphasis is being laid on the development of multiparticulate dosage forms in comparison to single unit systems due to their potential benefits such as increased bioavailability, reduced risk of systemic toxicity, reduced risk of local irritation, and predictable gastric emptying [7]. Enzalutamide is an orally active inhibitor of the signaling pathways mediated by the androgen receptor (AR) that was explicitly brought about to overcome castration-resistant prostate cancer (CRPC)
harboring AR amplification or overexpression. Enzalutamide has demonstrated noteworthy activity in men with metastatic CRPC [8].
In the current work, hot homogenization followed by the ultrasonication method was employed to prepare the enzalutamide-loaded SLNs and the optimization of enzalutamide-loaded SLN was done by Box– Behnken design.
MATERIALS AND METHODS Materials
Tristearin (Dynasan-118), tripalmitin (Dynasan-116), and trimyristin (Dynasan-114) were procured from Sigma-Aldrich Chemicals, Hyderabad, India. Enzalutamide was a kind gift sample from Dr. Reddy’s Labs, India. Poloxamer-188 and egg lecithin were gift samples from Aurobindo Labs, India. Solvents and all other chemicals were of analytical grade and were used without further purification.
Drug authentication
Fourier-transform infrared spectroscopy (FTIR)
Fourier-transform infrared spectroscopy (FTIR) of enzalutamide was done using Tensor 27 FTIR spectrophotometer (Bruker Optics, Germany). The samples were scanned over wavenumber region of 4000-400 cm−1
at resolution of 4 cm−1. Samples were prepared using KBr (spectroscopic
grade) disks with hydraulic pellet press at pressure of 7–10 tons.
Characterization by differential scanning calorimetry (DSC) DSC is one of the fundamental techniques employed to determine the purity of drug and investigate drug-excipient compatibility. Accurately © 2019 The Authors. Published by Innovare Academic Sciences Pvt Ltd. This is an open access article under the CC BY license (http://creativecommons. org/licenses/by/4. 0/) DOI: http://dx.doi.org/10.22159/ajpcr.2019.v12i6.31617
weighed amount (5 mg) of drug sample to be analyzed was taken in the pierced DSC aluminum pan and scanned in the temperature range of 50°C–230°C. The heating rate was 20°C/min. The thermogram of drug was obtained.
Preliminary experiments
The preliminary experiments (one factor at a time approach) were performed to identify the best choice of lipids and surfactants. From the results obtained, formulations incorporated with Dynasan-116 displayed lower particle sizes, but the polydispersity index (PDI) was high and zeta potential (ZP) was low. Formulations constituted by Dynasan-118 exposed lower PDI, but higher particle sizes and lower ZP. Formulations containing Dynasan-114 demonstrated relatively better size, PDI and ZP in relation to other formulations. Based on the results, trimyristin (Dynasan-114) was selected as the lipid of choice for further investigations [9].
Drug-excipients compatibility study
The Drug-excipients compatibility studies were performed to check and interaction between drug and selected excipients.
Design of experiments
According to Box–Behnken design, a total number of 17 experiments, including 12 factorial points at the midpoints of the edges of the process space and five replicates at the center point for the estimation of pure error sum of squares, were performed to choose the best model among the linear, two-factor interaction, and quadratic model due to the analysis of variance (ANOVA) F-value. The obtained p<0.05 is considered statistically significant.
From the preliminary studies, it was found that the drug-to-lipid ratio (A), concentration of phosphatidylcholine (B), and concentration of poloxamer 188 (C) had a significant effect on the particle size (Y1), entrapment efficiency (Y2), and drug loading (Y3) of SLNs. Therefore, by fixing the homogenization time (30 min), stirring time (2 h), and sonication time (5 min), the selected variables A, B, and C were studied at three different levels as low (−1), medium (0), and high (+1) (Table 1).
The experiments were conducted as for the design and obtained responses (Table 2). On the basis of preliminary studies, the factors such as drug-to-lipid ratio (1:10–1:20), concentration of phosphatidylcholine (50–100 mg), and concentration of poloxamer 188 (100–200 mg) were identified as the formulation variables. The response surfaces of the variables within the experimental field were assessed using Stat-Ease Design Expert® software V8.0.1. Subsequently, three additional validation experiments were steered to verify the validity of the statistical experimental strategies.
Regression analysis
The targeted response parameters were analyzed statistically utilizing Stat-Ease Design Expert® programming V8.0.1 by one-way ANOVA at 0.05 levels. The individual parameters were assessed utilizing the F test and quadratic models of the frame Y = β + β1 × 1+ β2 × 2+ β3 × 1X2+ β4 × 12+ β5 × 22 were produced for every response parameter utilizing multiple linear regression analysis, where Y is the degree of the measured response, β is the intercept, and β1 to β2 are the regression coefficients. X1 and X2 represent the primary impacts, X1 × 2 is the interaction between the fundamental impacts, and X12 and X22 are
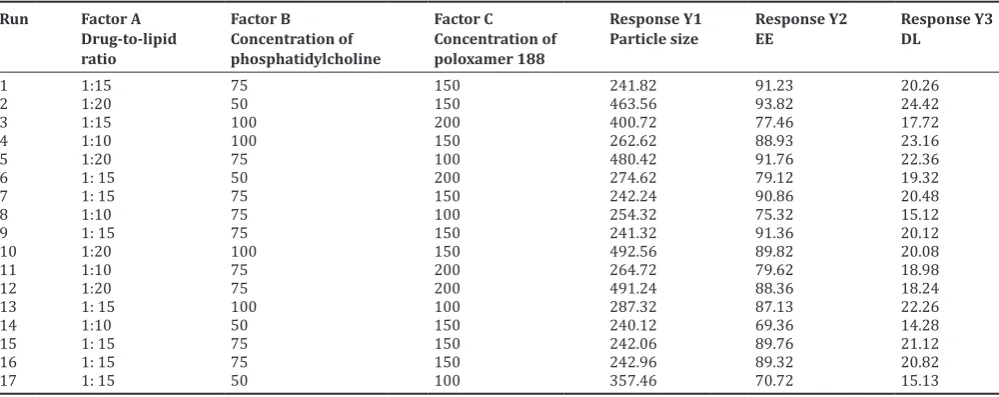
Table 2: Box–Behnken experimental design and observed responses
Run Factor A
Particle size Response Y2EE Response Y3DL
1 1:15 75 150 241.82 91.23 20.26
2 1:20 50 150 463.56 93.82 24.42
3 1:15 100 200 400.72 77.46 17.72
4 1:10 100 150 262.62 88.93 23.16
5 1:20 75 100 480.42 91.76 22.36
6 1: 15 50 200 274.62 79.12 19.32
7 1: 15 75 150 242.24 90.86 20.48
8 1:10 75 100 254.32 75.32 15.12
9 1: 15 75 150 241.32 91.36 20.12
10 1:20 100 150 492.56 89.82 20.08
11 1:10 75 200 264.72 79.62 18.98
12 1:20 75 200 491.24 88.36 18.24
13 1: 15 100 100 287.32 87.13 22.26
14 1:10 50 150 240.12 69.36 14.28
15 1: 15 75 150 242.06 89.76 21.12
16 1: 15 75 150 242.96 89.32 20.82
17 1: 15 50 100 357.46 70.72 15.13
EE: Entrapment efficiency, DL: Drug loading
Table 1: List of dependent and independent variables in in Box–Behnken design
Independent variables Levels
Variable Name Units Low Middle High
A Drug-to-lipid ratio - 1:10 1:15 1:20
B Concentration of phosphatidylcholine mg 50 75 100
C Concentration of poloxamer 188 mg 100 150 200
Dependent variable Goal
Variable Name Units
Y1 Particle size nm Minimize
Y2 EE Percentage Maximize
Y3 DL Percentage Maximize
the quadratic terms of the independent variables that were used to simulate the curvature of the designed sample space. The value of coefficients reflected the effect of independent variables and their interaction on the dependent variables. A positive coefficient indicates a synergistic effect; meanwhile, a negative one reflects an antagonistic effect. The significance of individual coefficients was determined by ANOVA test and was considered significant if p<0.05. A backward elimination procedure was implemented to fit the data into different predictor equations. The quadratic models engendered by regression analysis were used to construct the three-dimensional graphs in which response parameter Y was characterized by a curvature surface as a function of X [10-12]. The effect of the independent variables on each response parameters was visualized from the perturbation plots.
The optimized formulation was obtained which has the minimum particle size with maximum entrapment efficiency and drug loading. By utilizing the software, the solution for optimized formulation with a desirability value of 0.885 was found. The optimized formulation was prepared and evaluated for particle size, entrapment efficiency, and percentage drug loading. Observe response value of the optimized formulation was compared with predicted value. The optimized batch(s) were further investigated by X-ray diffractometry (XRD) and SEM.
Preparation of solid lipid nanoparticles (SLNs)
Hot homogenization followed by the ultrasonication method was employed to prepare enzalutamide-loaded SLNs. Enzalutamide (dose 40 mg), lipid, and phosphatidylcholine were dissolved in 5 ml of 1:1 mixture of chloroform and methanol. Organic solvents were completely evaporated using a rotary evaporator (Heidolph, Schwabach, Germany). Enzalutamide entrenched lipid layer was liquefied by heating to 5°C above melting point of the lipid. Aqueous phase was prepared by dissolving poloxamer 188 in double distilled water and heated to same temperature (based on lipid melting point) of oil phase. Hot aqueous phase was added to the oil phase and homogenization was carried out (at 12,000 rpm) using homogenizer (Diax900, Heidolph, Germany) for 4 min. The coarse hot oil in water emulsion so obtained was ultrasonicated using a 12 T probe Sonicator (Vibra-Cell, Sonics, CT, USA) for 20 min. Enzalutamide-loaded solid lipid nanoparticles (SLNs) were obtained by allowing hot nanoemulsion to cool to room temperature.
Characterization of solid lipid nanoparticles (SLNs)
Measurement of particle size, polydispersity index (PDI), and zeta potential of solid lipid nanoparticles (SLNs)
The size, PDI, and ZP of the SLNs were measured using a zetasizer (Nano ZS90, Malvern, Worcestershire, UK). From the prepared SLN dispersion, 100 ml was diluted to 5 ml with double distilled water to get optimum kilo counts per second (Kcps) of 50–200 for measurements.
Determination of entrapment efficiency and drug loading A fixed quantity of SLNs dispersion (10 ml) was taken in a centrifuge tube and centrifuged at 18,000 rpm for 20 min at room temperature (Remi Instruments Pvt. Ltd, India). The lipid portion was isolated and the absorbance of the drug in the supernatant was determined spectrophotometrically at λmax 270 nm (Shimadzu 1800, Japan).
Characterization of crystallinity by powder X-ray diffractometry (PXRD)
Powder X-ray diffractometer (Multiflex, M/s. Rigaku, Tokyo, Japan) was used for diffraction studies. Powder XRD studies were performed on the samples by exposing them to nickel filtered CuKa radiation (40 kV, 30 mA) and scanned from 2° to 70°, 2 θ at a step size of 0.045° and step time of 0.5 s. Samples used for PXRD analysis were pure enzalutamide, physical mixture of drug with lipid (1:1 ratio), and lyophilized enzalutamide-loaded SLNs.
Morphology by scanning electron microscopy (SEM)
The morphology of nanoparticles was studied by scanning electron microscope (SEM, Hitachi, Tokyo, Japan). Freeze-dried SLNs of
enzalutamide were suitably diluted with double distilled water (1 in 100) and a drop of nanoparticle formulation was placed on sample holder and air dried. Then, the sample was observed at accelerating voltage of 15,000 volts at various magnifications. Imaging was carried out in high vacuum.
In vitro drug release studies
In vitro release studies were performed using dialysis bag method. Dialysis membrane (molecular weight cutoff between 12,000 and 14,000) was soaked overnight in double distilled water before the release studies. Hydrochloric acid (0.1 N) and phosphate buffer pH 6.8 were used as release media. The experimental unit consists of a donor and receptor compartment. Donor compartment consists of a boiling tube which was cut open at one end and tied with dialysis membrane at the other end into which SLN dispersion of 3 ml was taken for release study. Receptor compartment consists of a 250 ml beaker which was filled with 100 ml release medium and the temperature of it was maintained at 37°C ± 0.5°C. At 0.5, 1, 2, 3, 4, 6, 8, 10, 12, and 24 h time points, 3 ml samples each were withdrawn from receiver compartment and replenished with the same volume of release medium. The collected samples were suitably diluted and analyzed by UV-visible spectrophotometer at 236 nm.
Drug release kinetics
To elucidate the mode and mechanism of drug release, the data from the invitro release study were fitted into various kinetic models such as zero-order, first-order, Higuchi’s, and Korsmeyer–Peppas model.
Stability studies
Stability of enzalutamide nanoparticles suspension in screw-capped glass vials was evaluated over a time period of 90 days. Six samples were divided into two groups and stored at 25°C and 4°C. Drug leakage from nanoparticles and mean particle size of the samples were determined at the end of 1, 7, 15, 30, 45, 60, and 90 days.
Data analysis
Data are expressed as the means ± standard deviation (SD) of the mean and statistical analysis was carried out employing the one-way analysis of variance (ANOVA). p<0.05 was considered statistically significant.
RESULTS AND DISCUSSION Authentication of drug
Fourier-transform infrared spectroscopy
The FTIR spectrum of enzalutamide sample recorded. The characteristic peaks of enzalutamide are seen at 3433, 3095, 2951, 2233, 1763, 1607, 1499, 1270, 1136, 1052, 998, and 786 cm−1. The presence of prominent
peaks confirms the purity of drug as per established standards (Fig. 1).
Preliminary experiments
Preliminary experiments conducted using three different lipids Trimyristin (Dynasan-114), tripalmitin (Dynasan-116), and tristearin
(Dynasan-118). Based on the results from the initial studies, trimyristin (Dynasan-114) was selected as the lipid for the further studies.
Drug-excipients compatibility study Fourier-transform infrared spectroscopy
To test for possible intermolecular interaction between enzalutamide and the selected lipid trimyristin (Dynasan-114), FTIR was carried out. The FTIR spectra analysis of enzalutamide alone showed that the principal peaks were observed at wavenumbers 3433, 3095, 2951, 2233, 1763, 1607, 1499, 1270, 1136, 1052, 998, and 786 cm−1
confirming the purity of drug as per established standards (Fig. 1). In the IR spectra of the physical mixture of enzalutamide with trimyristin (Dynasan-114), the major peaks of enzalutamide were observed at same wavenumbers (Fig. 2). However, some additional peaks were observed with physical mixture, which could be due to the presence of functional groups of lipid.
Differential scanning calorimetry
The thermoanalytical graph obtained by DSC, a sharp symmetric endothermic peak was observed at 203°C for pure enzalutamide which corresponds to its melting point (Fig. 3). The DSC curve of physical mixture exhibits two endothermic peaks at 63.62°C and 203°C corresponding to characteristic peaks of lipid and drug, respectively (Fig. 4). The characteristic peak of drug is not altered with the physical mixture. This indicates the compatibility of the drug with the selected lipid.
Analysis of data
Seventeen experiments were essential for the response surface methodology based on the Box–Behnken design. Founded on the experimental design, the factor combinations generated different responses (Table 2). These results evidently postulate that the dependent variables are strongly dependent on the selected independent variables as they show a wide variation among all the 17 batches.
Data were analyzed using Stat-Ease Design Expert® software V8.0.1 to obtain analysis of variance (ANOVA), regression coefficients, and regression equation. Mathematical relationships were generated using multiple linear regression analysis for the mentioned variables (Table 3).
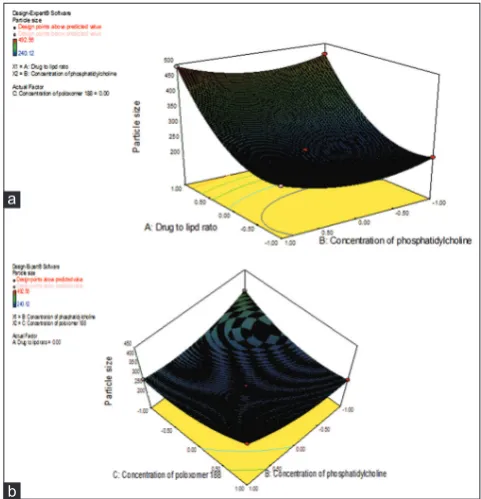
The particle size of the nanoparticles was noticed to be in the range of 240.12–492.56 nm (Table 2). The mathematical model generated for particle size (Y1) was found to be significant with F-value of 10953.34 implies that the model is significant (Table 3). Results of the equation specify that the impact of A is more substantial than B and C. The influence of the main and interactive effects of independent variables on the particle size was additionally explicated using the perturbation, 3D response surface plots. The perturbation plot (Fig. 5) showing the main effects of A, B, and C on the particle size (Y1). This figure clearly shows that A has the main and the major effect on Y1 followed by B and C which have moderate effect on Y1. The relationship between the dependent and independent variables was further elucidated using 3D response surface plots and corresponding contour plots (Fig. 6a and b). At low levels of A, Y1 increased from 240.12–264.72 nm. Similarly, at high levels of A, Y1 increased from 463.56 to 492.56 nm. At low levels of B, Y1 increased from 240.12 to 463.56 nm. Similarly, at high levels of B, Y1 increased from 262.62 to 492.46 nm. At low levels of C, Y1 increased from 254.32 to 480.42 nm. Similarly, at high levels of C, Y1 increased from 264.72 to 491.24 nm. Entrapment efficiency of nanoparticles was found to be in the range of 69.36–93.82% (Table 2).
The effect of A (drug-lipid ratio) is more significant than B, whereas the variable C (concentration of poloxamer 188) was found to have negative effect on the entrapment efficiency, which means this factor is inversely proportional to the response. The influence of the main and interactive effects of independent variables on the entrapment efficiency was further elucidated using the perturbation and 3D response surface
Fig. 2: Fourier-transform infrared spectroscopy spectrum of enzalutamide pure drug + Dynasan-114
Fig. 3: Differential scanning calorimetry thermogram of enzalutamide pure drug
Fig. 4: Differential scanning calorimetry thermogram of enzalutamide pure drug + Dynasan-114
plots (Fig. 7). It is found that all the variables are having negative interactive effects for the response Y2. The 3D response surface plots of the response Y2 portray the interactive effects of independent variables on response Y2, one variable was kept constant while the other two variables varied in a certain range. The shapes of response surfaces plots reveal the nature and extent of the interaction between different factors. The interaction between A and B on entrapment efficiency at a fixed level of C is shown in Fig. 8a. The interaction between B and C on entrapment efficiency at a fixed level of A is shown in Fig. 8b. The interaction between A and C on entrapment efficiency at a fixed level of B is shown in Fig. 8c. At low levels of A, Y2 increased from 69.36% to 88.93%. Similarly, at high levels of A, Y2 increased from 88.36% to 93.82%. At low levels of B, Y2 increased from 69.36% to 93.82%. Similarly, at high levels of B, Y2 increased from 77.46% to 89.82%. At low levels of C, Y2 reduced from 91.76% to 70.72%. Similarly, at high levels of C, Y2 reduced from 88.36% to 77.46%.
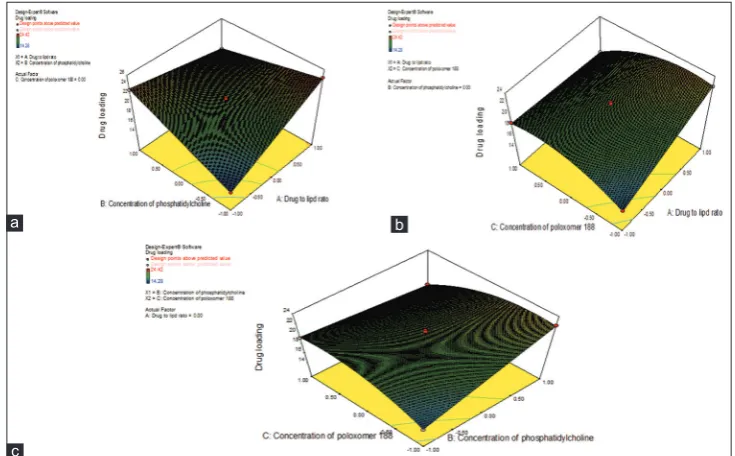
Percent drug loading of nanoparticles was found to be in the range of 14.28%–24.42% (Table 2). Results indicate that A and B have positive effect on drug loading. The effect of A (drug-lipid ratio) is more significant than B, whereas the variable C (concentration of poloxamer 188) was found to have negative effect on the drug loading, which means this factor is inversely proportional to the response. The influence of the main and interactive effects of independent variables on the drug loading was further elucidated using the perturbation and 3D response surface plots. The individual main effects of A, B, and C on drug loading show that all the variables are having negative interactive effects for the response Y3 (Fig. 9). The shapes of response surfaces plots reveal the nature and extent of the interaction between different factors. The interaction between A and B on drug loading at a fixed level of C is shown in Fig. 10a. The interaction between A and C on drug loading at a fixed level of B is shown in Fig. 10b. The interaction between B and C on drug loading at a fixed level of A is shown in Fig. 10c. At low levels of A, Y3 increased from 14.28% to 23.16%. Similarly, at high levels of A, Y3 increased from 18.24% to 24.42%. At low levels of B, Y3 increased from 14.28% to 24.42%. Similarly, at high levels of B, Y3 increased from 17.72% to 23.26%. At low levels of C, Y3 reduced from 22.36% to 15.12%. Similarly, at high levels of C, Y3 reduced from 19.32% to 17.72%.
Optimization and confirmation experiments
A numerical optimization technique using the desirability approach was employed to prepare enzalutamide nanoparticles with the desired responses. Constraints such as minimizing the particle size in addition
to maximizing the entrapment efficiency and drug loading were set as goals to locate the optimum settings of independent variables. The optimized levels and predicted values of Y1, Y2, and Y3 are tabulated (Table 4). To verify these values, three batches of nanoparticles were prepared according to the predicted levels of A, B, and C. The predicted
Table 3: Regression equations for the responses – particle size, entrapment efficiency, and drug loading
Response Regression equation
Y1 242.08+113.25 A+13.43 B+6.47 C+1.63 AB+49.06 BC+82.64 A2+40 B2+47.95 C2 Y2 90.53+6.32 A+3.79 B−0.046 C−5.89
AB – 1.93 AC−4.52 BC−5.09 B2−6.80 C2 Y3 20.53+1.70 A+1.26 B−0.076 C−3.31
AB−2.00 AC−2.18 BC−1.89 C2 Fig. 7: Perturbation plot showing the effect of A, B, and C on percentage entrapment efficiency
Fig. 6: (a) Response surface plot showing the influence of drug-to-lipid ratio and concentration of phosphatidylcholine on particle size at constant level of C. (b) Response surface plot showing the influence of concentration of phosphatidylcholine and concentration of poloxamer 188 on particle size at constant
level of A
b a
Table 4: Optimized values obtained by the constraints applies on Y1, Y2, and Y3
Independent variable Nominal
values Predicted valuesParticle size (Y1) EE (Y2) DL (Y3) Observed valuesBatch Particle size (Y1) EE (Y2) DL (Y3)
Drug-lipid ratio (A) 1:12.05 243.89 89.198 23.09 F1 248.8 88.24 23.24
F2 258.3 89.46 22.62
Concentration of
phosphatidylcholine (B) 100 F3 253 89.72 23.84
Concentration of poloxamer 188 (C) 115
and observed values tabulated (Table 4). Obtained Y1, Y2, and Y3 values were in a close agreement with the predicted values. This demonstrated the reliability of the optimization procedure in predicting the operating parameters for the preparation of enzalutamide nanoparticles. All the three batches of obtained enzalutamide nanoparticles were subjected to further characterization.
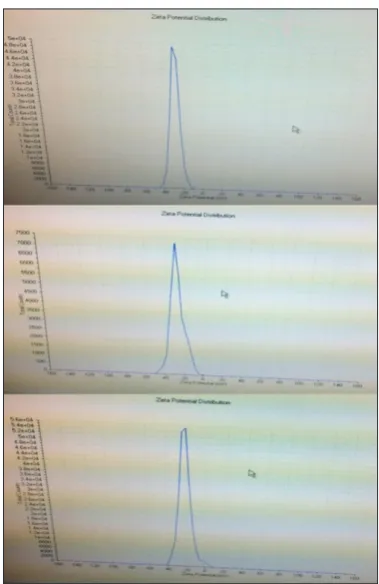
All the prepared formulations were analyzed to determine their particle size distribution, ZP. A particle size, size distribution, and ZP curve of optimized formulations obtained (Figs. 11 and 12). The mean size of all the formulations was ranging from 248.8 ± 6.3 nm to 258.3 ± 9.8 nm (Table 5). The PDI was ranging from 0.198 to 0.251, indicating the narrow size distribution. The SLN formulations exhibited negative surface charge with the inclusion of enzalutamide which clearly suggested the orientation of enzalutamide in the lipid matrix. The surface charge is a key factor for the stability of colloidal dispersion. In our case, the ZP values of SLN formulations were found to be in between 28.7 ± 5.48 mV and 29.3 ± 4.89 mV. ZP is an important factor that affects
the stability of colloidal systems. Total entrapment efficiency of the nanoparticles formulations was determined and found to be ranging from 88.24 ± 0.37% to 89.72 ± 0.18%. The percent drug loading of the formulations was found to be in the range from 23.24 ± 0.12% to 23.84 ± 0.32%.
Powder X-ray diffractometry
Powder XRD patterns of enzalutamide showed sharp peaks at 2 θ scattered angles of 0, 8.5, 12.2, 13.3, 14.1, 17.3, 18.8, 19, 19.6, 20, 21.6, 22.4, 23.2, 24.2, 24.6, 26, 26.8, and 27.3°, indicating the crystalline nature of drug (Fig. 13). These characteristic peaks of enzalutamide existed in physical mixtures (Fig. 14), and drug peaks were absent in the lyophilized sample (Fig. 15). This indicated that the drug was not in crystalline form after lyophilization of SLN. Intensity of pure lipid peaks was also decreased in the lyophilized samples.
Surface morphology
Scanning electron microscopy was used to evaluate the morphology of the optimized formulation F3. The data showed a spherical shape for enzalutamide nanoparticles with uniform and relatively narrow particle distribution (Fig. 16). Spherical particles could be uptaken easier than disfigured ones. Therefore, it is speculated that the mean particle size that was obtained using the laser diffraction method belongs to the agglomerated nanoparticles.
Drug release study
Cumulative release (%) of control pure drug enzalutamide within 24 h was obtained to be 29.56 which indicate a slow release pattern very less drug release for the control (Fig. 17). The slow release of enzalutamide can be attributed to the limited solubility. The complete and controlled release of the drug from the optimized SLN formulations can be due to the reduced particle size and enhanced effective surface area (Table 6).
Drug release kinetics
Release data for optimized formulation (F3) were fitted into various kinetic equations to find out the order and mechanism of drug release [Figs. 18-21]. Kinetic analysis of drug release profiles showed that the systems predominantly released enzalutamide in a zero-order Fig. 9: Perturbation plot showing the effect of A, B, and C on
percentage drug loading
Fig. 8: (a) Response surface plot showing the influence of drug-lipid ratio and concentration of phosphatidylcholine on entrapment efficiency at constant level of C. (b) Response surface plot showing the influence concentration of phosphatidylcholine and concentration
of poloxamer 188 on entrapment efficiency at constant level of A. (c) Response surface plot showing the influence drug-lipid ratio and concentration of poloxamer 188 on entrapment efficiency at constant level of B
c
manner with a strong correlation coefficient (R2 = 0.9994). This was corroborated by “n” values of 0.9494 (n > 0.89) which implies Super Case II release kinetics (a strong indication of zero order). Zero-order release is the ideal in controlled drug release and has been reported not to be common with matrix systems, this being attributed to time-dependent changes in drug depleted matrix surface area and diffusional path length. Zero-order release has a lot of advantages including
ability to deliver drug at a constant rate, thus providing a predictable bioavailability status.
Stability study
The purpose of stability testing is to provide the evidence on how the quality of drug substance or drug product varies with time under the influence of variety of environmental factors such as temperature, humidity, and light. No significant difference (p<0.05) was found in entrapment efficiency and particle size of optimized formulation F3 stored at refrigerated conditions and at room temperature (Table 7).
CONCLUSION
Enzalutamide is poorly water-soluble drug with poor oral bioavailability due to extensive first-pass metabolism. SLNs of enzalutamide were produced by hot homogenization followed by an ultrasonication method with the use of a 3-factor, 3-level Box–Behnken design. Trimyristin (Dynasan-114), tripalmitin (Dynasan-116), and tristearin (Dynasan-118) were used as lipids and based on the results from the initial studies, trimyristin (Dynasan-114) was selected as the lipid for the further studies along with phosphatidylcholine as surfactant and poloxamer 188 as stabilizer. The optimized formulation (F3) was obtained which has the minimum particle size (253 nm) with maximum entrapment efficiency (89.72%) and drug loading (23.84%). The optimized batch(s) was further investigated by XRD, SEM, and stability. In vitro release studies showed that maximum cumulative drug release was obtained for F3 (99.72%) in controlled manner. The optimized formulation enzalutamide followed zero-order release kinetics with a strong correlation coefficient (R2 = 0.9994). The obtained results Table 5: The mean particle size, polydispersity index, zeta potential, entrapment efficiency, and percentage drug loading of optimized
formulations
Batch MPS±SD (nm) PDI ZP±SD (mV) Percentage EE±SD Percentage DL±SD
1 248.8±6.3 0.206 -28.7±5.48 88.24±0.37 23.24±0.12
2 258.3±9.8 0.251 -28.9±7.79 89.46±0.17 22.62±0.42
3 253±4.2 0.198 -29.3±4.89 89.72±0.18 23.84±0.32
PDI: Polydispersity index, SD: Standard deviation, ZP: Zeta potential, EE: Entrapment efficiency, MPS: Mean particle size, DL: Drug loading
Table 6: Dissolution profile of enzalutamide solid lipid nanoparticles (optimized batches)
Fig. 10: (a) Response surface plot showing the influence of drug-lipid ratio and concentration of phosphatidylcholine on drug loading at constant level of C. (b) Response surface plot showing the influence drug-lipid ratio and concentration of poloxamer188 on drug loading at constant level of B. (c) Response surface plot showing the influence concentration of phosphatidylcholine and concentration of poloxamer188 on drug loading at constant level of A
c
are indicative of enzalutamide SLNs as potential lipid carriers for the effective delivery of enzalutamide.
ACKNOWLEDGMENTS
The author Mr. K. T. Sunil Kumar gratefully acknowledges the support rendered by Shri K. V. Vishnu Raju, Chairman, Shri Vishnu Educational Society and Dr. D. B. Raju, Director, Shri Vishnu College of Pharmacy, for providing facilities to carry out the research work.
Table 7: Particle size and entrapment efficiency of enzalutamide optimized formulation F3 after 90 days of storage at refrigerated and room temperature
Temperature (°C) Particle size (nm) EE (%) Release data (percentage CDR)
0 month 3 months 0 month 3 months 0 month 3 months
2 h 4 h 2 h 4 h
4±1 248.8±6.3 249.12±5.13 88.24±0.37 67.892±1.13 9.13±0.52 17.18±0.82 8.92±2.12 17.12±1.15
25±2 248.8±6.3 249.76±4.27 88.24±0.37 68.142±0.68 9.18±0.46 17.23±0.32 8.76±0.16 16.89±2.26
n=3 (P<0.05). CDR: Cumulative drug release, EE: Entrapment efficiency
Fig. 11: Particle size distribution of enzalutamide solid lipid nanoparticles
Fig. 12: Zeta potential of enzalutamide solid lipid nanoparticles
Fig. 13: X-ray diffraction pattern of pure drug enzalutamide
Fig. 14: X-ray diffraction pattern of physical mixture
Fig. 15: X-ray diffraction pattern of enzalutamide nanoformulation F3
Fig. 17: In vitro release of enzalutamide from nanoformulations with pure drug
Fig. 18: Plot of zero-order release kinetics of the optimized batch F3
Fig. 19: Plot of first-order release kinetics of the optimized batch F3
Fig. 20: Plot of Higuchi release kinetics of the optimized batch F3
Fig. 21: Plot of Korsmeyer–Peppas release kinetics of the optimized batch F3
AUTHORS’ CONTRIBUTIONS
All authors have contributed equally for this research article.
COMPETING INTERESTS No conflicts of interest by authors.
REFERENCES
1. Begum MY, Reddy GP. Formulation and evaluation of dasatinib loaded solid lipid nanoparticles. Int J Pharm Pharm Sci 2018;10:14-20. 2. Priyanka K, Sathali AA. Preparation and evaluation of montelukast
sodium loaded solid lipid nanoparticles. J Young Pharm 2012;4:129-37. 3. Ekambaram P, Abdul HS. Formulation and evaluation of solid lipid
nanoparticles of ramipril. J Young Pharm 2011;3:216-20.
nanoparticles. Adv Drug Deliv Rev 2007;59:411-8.
6. Harde H, Das M, Jain S. Solid lipid nanoparticles: An oral bioavailability enhancer vehicle. Expert Opin Drug Deliv 2011;8:1407-24.
7. Abather AS, Rassol AA. Formulation and evaluation of silibinin loaded solid lipid nanoparticles for peroral use targeting lower part of gastrointestinal tract. Int J Pharm Pharm Sci 2014;6:55-67.
8. Golshayan AR, Antonarakis ES. Enzalutamide: An evidence-based review of its use in the treatment of prostate cancer. Core Evid 2013;8:27-35.
9. Yu LX. Pharmaceutical quality by design: Product and process
development, understanding, and control. Pharm Res 2008;25:781-91. 10. Montgomery DC. Design and Analysis of Experiments. New York:
John Wiley and Sons Inc.; 2007.
11. Myers RH, Montgomery DC, Anderson-Cook CM. Response Surface Methodology: Process and Product Optimization Using Designed Experiments. United States: Wiley; 2009.