Reasoning, Models, and Images:
Behavioral Measures and Cortical Activity
Markus Knauff
1,3, Thomas Fangmeier
1, Christian C. Ruff
1,
and P. N. Johnson-Laird
2Abstract
& The goal of this study was to investigate the neurocognitive processes of mental imagery in deductive reasoning. Behav-ioral studies yielded four sorts of verbal relations: (1) visuospatial relations that are easy to envisage both visually and spatially; (2) visual relations that are easy to envisage visually but hard to envisage spatially; (3) spatial relations that are hard to envisage visually but easy to envisage spatially; and (4) control relations that are hard to envisage both visually and spatially. In three experiments, visual relations slowed the process of reasoning in comparison with control relations, whereas visuospatial and spatial relations yielded inferences comparable to those of control relations. An experiment using functional magnetic resonance imaging showed that in the
absence of any correlated visual input (problems were presented acoustically via headphones), all types of reasoning problems evoked activity in the left middle temporal gyrus, in the right superior parietal cortex, and bilaterally in the precuneus. In the prefrontal cortex, increased activity was found in the middle and inferior frontal gyri. However, only the problems based on visual relations also activated areas of the visual association cortex corresponding to V2. The results indicate that cortical activity during reasoning depends on the nature of verbal relations. All relations elicit mental models that underlie reasoning, but visual relations in addition elicit visual images. This account resolves inconsistencies in the previous literature. &
. . .it is clear that imagery plays a key role in reasoning.
(Kosslyn, 1994, p. 404)
INTRODUCTION
Mental imagery has been studied extensively from the standpoint of memory (Block, 1981; Kosslyn, 1980, 1994), but its role in human reasoning remains unclear. If you ask people how they reason, many of them say that they rely on visual images. For instance, with a problem such as
Ann is taller than Bert. Bert is taller than Cath.
Does it follow that Ann is taller than Cath?
they say that they formed a mental picture in their ‘‘mind’s eye’’ and then looked at this picture to see that Ann is taller than Cath. Reasoning does seem inextri-cably linked with seeing in the ‘‘mind’s eye.’’ However, does this experience of mental imagery reflect the real nature of underlying mental representations? Some theorists such as Kosslyn say ‘‘yes’’ (see the epigraph to this article), whereas other theorists such as Pylyshyn say ‘‘no’’ (see Pylyshyn, 1981, in press). The aim of this
article is to make progress towards resolving the con-troversy—at least as it applies to reasoning—and at the same time to examine the neuronal processes that underlie reasoning. The article begins with a description of inferences based on relations and a summary of the apparently inconsistent effects of the imageability of relations. Next, it describes some behavioral studies with such inferences in which we manipulated the nature of the relations. The article reports an functional magnetic resonance imaging (fMRI) study of the same problems that elucidates the relation among images, models, and cortical activity. Finally, it shows how the findings re-solve the inconsistencies in the literature, and it draws general conclusions about the role of mental represen-tations in deductive reasoning.
Our research concerns an essential sort of reasoning: deductive reasoning (Rips, 1994). A valid deduction, by definition, yields a conclusion that must be true granted that its premises are true. In contrast, inductive reason-ing is not valid, and so an induction from true premises may or may not yield a true conclusion. Consider, for example, the preceding problem. To a logician, the inference yields a transitive conclusion, which depends for its validity on a missing premise: For anyx,y, andz, ifxis taller thanyandyis taller thanz, thenxis taller than z. Psychologists have studied such inferences, which they refer to as ‘‘linear syllogisms’’ or ‘‘three-term series’’ problems, and they have proposed various
1
accounts of how individuals solve them (see, e.g., Evans, Newstead, & Byrne, 1993).
A pioneering study of three-term series inferences was carried out by De Soto, London, and Handel (1965). They argued that reasoners represent the entities in the premise in a visual image and then ‘‘read off’’ the answer by inspecting this image. On this account, problems of the form
A is shorter than B. B is shorter than C.
are harder than those in which the relation is ‘‘taller than,’’ because reasoners have to build up a representa-tion in an order that is unnatural, working from the shortest individual up to the tallest individual. Hutten-locher (1968) similarly argued that reasoners imagine a spatial array of objects, and that it is easier to move an entity into the array if it is referred to by the subject of the sentence. In contrast, Clark (1969) proposed a linguistic account of the difficulty of relational inferences. Linguis-tically speaking, a relation such as ‘‘taller than’’ is lexically unmarked: It tells you nothing, for example, about the absolute height of the two entities. But, a relation such as ‘‘shorter than’’ is lexically marked: It tells you that both entities are short by the standards of the class to which they belong. Marked terms, Clark argued, take longer to process, and so they impede the process of reasoning. The controversy between these two accounts was never properly resolved, perhaps because both of them could be right (see Johnson-Laird, 1972). Marked terms could take longer to understand than unmarked terms, but, once understood, they could be used to construct spatial representations of the problems.
If reasoning depends on constructing a visual image, then it should be easier to reason with materials that can be readily visualized. However, if reasoning depends on some other medium of representation, such as sentences in a mental language, then imageability might have no effect on the process. So, does imageability improve reasoning? The literature fails to yield a clear-cut answer. On the one hand, Shaver, Pierson, and Lang (1975) reported that relational reasoning depends on the ease of visualizing the materials, instructions to form images, and the participants’ ability to form images. In addition, Clement and Falmagne (1986) found that materials rated as easy to imagine led to fewer errors in reasoning. On the other hand, several studies have failed to detect any effect of imageability on reasoning. Stern-berg (1980) found no difference in accuracy between problems that were easy to visualize and problems that were hard to visualize, and no reliable correlation between reasoning and imaging abilities. Richardson (1987) reported that reasoning with visually concrete problems was no better than reasoning with abstract problems. Similar results have been reported by Johnson-Laird, Byrne, and Tabossi (1989) and Newstead, Pollard, and Griggs (1986).
The inconsistency might arise, as Knauff and Johnson-Laird (2002) have argued, because researchers have overlooked the distinction between visual images and spatial representations. This distinction has been drawn by researchers in cognitive neuroscience ( Mellet et al., 2000; Kosslyn, 1994; Rueckl, Cave, & Kosslyn, 1989; Ungerleider & Mishkin, 1982), psycholinguists and linguists (e.g., Landau & Jackendoff, 1993), and cogni-tive psychologists (e.g., Johnson-Laird, 1998). It is supported by investigations of brain-damaged patients (e.g., Newcombe, Ratcliff, & Damasio, 1987), by func-tional brain imaging (e.g., Smith et al., 1995), and by behavioral experiments on working memory (see Logie, 1995). Visual images are structurally similar to real visual perceptions, and they can represent objects, their colors and shapes, and the metrical distances between them. They have a limited resolution, but they can be scanned and mentally manipulated in other ways (see, e.g., Finke, 1989; Kosslyn, 1980). They can be so similar to real perceptions that they can be confused for them ( Johnson & Raye, 1981). In con-trast, spatial representations are models of the spatial relations among entities, that is, they represent what things are where. They might also be used to represent abstract relations in a spatial way, e.g., class inclusion can be represented by the spatial inclusion of one area within another. In inferential tasks, spatial models are likely to exclude visual detail, to represent only the information relevant to inference ( Johnson-Laird, 1998), and to take the form of multidimensional arrays that maintain ordinal and topological properties (Knauff, 1999; Knauff, Rauh, Schlieder, & Strube, 1998). In sum, visual images represent information in a modality-specific format, whereas spatial models are abstract and not restricted to a specific modality. We can therefore distinguish between two hypotheses about reasoning. According to the imagery hypothesis, reasoning depends on visual images, and so brain regions that mediate them should be active during reasoning. According to the spatial hypothesis, reasoning depends on spatial models, and so brain regions that mediate them should be active during reasoning, but specific materials that evoke imagery should in addition activate regions mediating images.
The distinction between visual images and spatial representations was corroborated in norming studies that we carried out to determine whether the ease of visualizing a relation might be independent of the ease of forming a spatial representation of it (Knauff & Johnson-Laird, 2000). The data from these studies yielded four sorts of relations:
1. visuospatial relations that are easy to envisage visually and spatially, such as ‘‘above’’ and ‘‘below’’
3. spatial relations that are difficult to envisage visually but easy to envisage spatially, such as ‘‘further north’’ and ‘‘further south’’
4. control relations that are hard to envisage both visually and spatially, such as ‘‘better’’ and ‘‘worse’’
These four sorts of relations were used to construct four corresponding classes of inferential problems that were used in the following experiments (the details are described in Methods). All inferences in the experiments used the same nouns (‘‘dog,’’ ‘‘cat,’’ and ‘‘ape’’) to minimize differences as a result of anything other than the relations. Here is an example of an inference with a valid conclusion:
The dog is cleaner than the cat. The ape is dirtier than the cat. Does it follow:
The dog is cleaner than the ape?
The participants had to decide whether the conclusion followed from the premises. The inferences were matched in all respects except for the nature of the relation. In the behavioral experiments, the problems were presented visually on a computer screen. In the fMRI experiment (and its prior training study), they were presented acoustically via pneumatic headphones to avoid any visual input. Although the inferences based on control relations were treated as a baseline for assessing differences in the neural processing of the four types of problems, brain images recorded during rest intervals were also used to assess the activation evoked by the entire set of reasoning problems. On the neuroanatomical level, the spatial hypothesis predicts that parietal cortical areas underlying spatial working memory, perception, and movement control, should be evoked by reasoning, whereas the imagery hypothesis postulates that areas of the occipital cortex should be evoked by reasoning (e.g., Knauff, Mulack, Kassubek, Salih, & Greenlee, 2002). Hence, the analysis of the imaging data was carried out in two steps. The first step
identified the cortical areas active for reasoning in gen-eral (visual, visuospatial, spatial, and control inferences vs. the rest interval). The second step examined differ-ences among the four sorts of relation.
RESULTS
Behavioral
Behavioral Experiments
Table 1 presents the mean latencies for the correct responses and the percentages of correct responses for the four sorts of relational inferences in the three experi-ments. There was no reliable difference in accuracy depending on the four kinds of relations in any of the experiments (about 80% correct overall). The first two experiments used only visuospatial, visual, and control inferences. The visuospatial inferences tended to be faster than the control inferences, but the difference was not significant. However, the visual inferences were reliably slower than the control inferences (Experiment 1: Wilcoxon test, z = 3.07, p < .0025; Experiment 2: Wilcoxon test,z= 2.46,p< .025). The third experiment used all four sorts of inferences, and there was a reliable trend of increasing response latencies of the following order: spatial inferences < visuospatial inferences < control inferences < visual inferences (Page’sL= 648,
z= 3.40, p< .01). Again, however, the principal effect was that visual relations slowed reasoning relative to the other three sorts of relation (Wilcoxon test,z= 2.49,
p< .01), which did not differ reliably from each other.
Training Experiment
The participants in the brain scanning study carried out a prior training experiment in which the computer presented the problems acoustically using the same timings as in the scanning study. The results, which are also shown in Table 1, corroborated the previous findings. The inferences were easy (89% correct overall),
Table 1. Mean Response Latencies (in sec) and the Percentages of Correct Responses (in parentheses) to the Four Sorts of
Inference in Three Behavioral Experiments (from Knauff & Johnson-Laird, 2002), the Training Experiment, and the Scanning Experiment
Visual Inferences Control Inferences Visuospatial Inferences Spatial Inferences
Experiment 1 2.65* (86) 2.38 (92) 2.20 (90) –
Experiment 2 3.37* (77) 2.64 (67) 2.46 (68) –
Experiment 3 4.48* (73) 3.81 (78) 3.74 (72) 3.52 (72)
Training experiment 2.6 (93) 2.3 (91) 2.3 (88) 2.2 (83)
Scanning experiment 2.1 (71) 2.0 (95) 2.0 (77) 2.0 (94)
Experiments 1 and 2 used only three sorts of inferences.
Table 2. Activation Clusters in Contrasts between the Images Acquired during the Four Sorts of Inferences and Those Acquired during the Rest Intervals
Talairach Coordinatesa
Location z Scorea Size (Voxels) x y z
Visuospatial versus Rest Interval
Parietal
Left superior parietal gyrus (BA 7) 4.80 59*** 21 61 56
Right superior parietal gyrus (BA 7) 5.36 24*** 27 56 55
Temporal
Left middle temporal gyrus (BA 21) 6.96 64*** 62 32 2
Frontal
Left middle frontal gyrus (BA 11) 4.81 35*** 45 34 14
Visual versus rest interval
Parietal
Right superior parietal gyrus (BA 7) 4.95 14b 27 56 55
Temporal
Left middle temporal gyrus (BA 21) 5.65 80*** 59 12 7
Right middle temporal gyrus (BA 21) 4.25 17* 59 6 5
Frontal
Left middle frontal gyrus (BA 11) 5.03 29** 42 34 14
Left middle frontal gyrus (BA 9) 4.95 22** 50 25 26
Right middle frontal gyrus (BA 6) 4.17 15* 30 3 50
Spatial versus rest interval
Parietal
Left precuneus (BA 7) 4.23 17* 21 58 55
Right precuneus (BA 7) 5.29 23** 24 56 53
Temporal
Left middle temporal gyrus (BA 21) 4.79 18*** 59 29 1
Frontal
Left inferior frontal gyrus (BA 47) 4.70 18* 48 40 15
Control versus rest interval
Parietal
Left precuneus (BA 7) 5.51 58*** 18 65 47
Right superior parietal gyrus (BA 7) 4.29 34** 27 52 63
Temporal
Left middle temporal gyrus (BA 21) 4.58 67*** 59 9 5
aLocation,zscore, and Talairach coordinates refer to the peak voxel of the cluster. The correspondence of this voxel to BA is established only when
applicable. This localization can be made only at the level of the whole cluster. b
This cluster was added to the table, although it is one voxel below the threshold for significance at the cluster level (p= .056). Note that precisely
this area is active in the conjunction analysis presented in Table 3.
*p< .05, corrected for multiple comparisons across the whole brain.
**p< .01, corrected for multiple comparisons across the whole brain.
and there was no significant difference in accuracy across the four sorts of problems. There was also no significant difference between accepting valid conclu-sions (87% correct) and rejecting invalid concluconclu-sions (90% correct), and so we pooled the results from the two conditions. The visual inferences were slower than the control inferences, whereas the visuospatial and spatial inferences did not differ from the control prob-lems. However, owing to the small number of partici-pants, none of the differences were significant (Friedman nonparametric analysis of variance, F = .23,
p= .97; this test assesses differences in a within-subjects design, see Siegel & Castellan, 1988).
Imaging Experiment
Table 1 presents the percentages of correct responses and their mean latencies in the imaging experiment. The participants’ accuracy was in the same range (84% correct overall) as in the previous behavioral experiments. However, the response latencies showed the same pattern as before: Correct responses had a tendency to be slower for the visual problems than for the other sorts of problems, though the difference was not statistically significant (Friedman analysis of variance,
F= 4.64, p= .20).
Brain Imaging
Table 2 summarizes the results of the comparisons of brain activation during the four sorts of inference and during the rest intervals. In comparison with the rest intervals, each of the four sorts of inference activated the left middle temporal gyrus corresponding to Brodmann’s area (BA) 21 and portions of the right parietal cortex (superior gyrus or precuneus; BA 7). The visuospatial, spatial, and control inferences also activated similar areas: left superior parietal gyrus or precuneus (BA 7). The visuospatial and visual inferences additionally acti-vated areas of the middle frontal gyrus (BA 11), while the spatial inferences also activated the left inferior frontal gyrus (BA 47). Apart from BA 11, however, the visual inferences distinctly activated quite different regions: left and right middle frontal gyrus (BA 9 and 6).
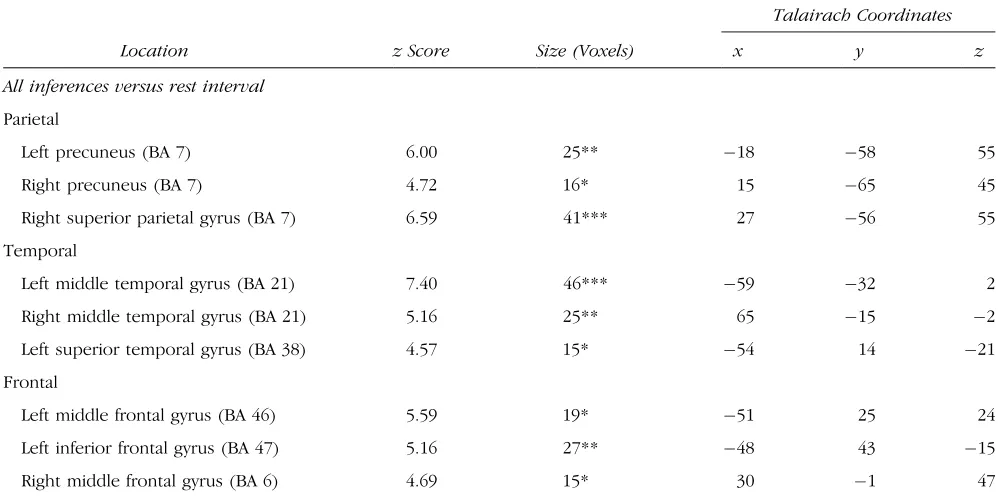
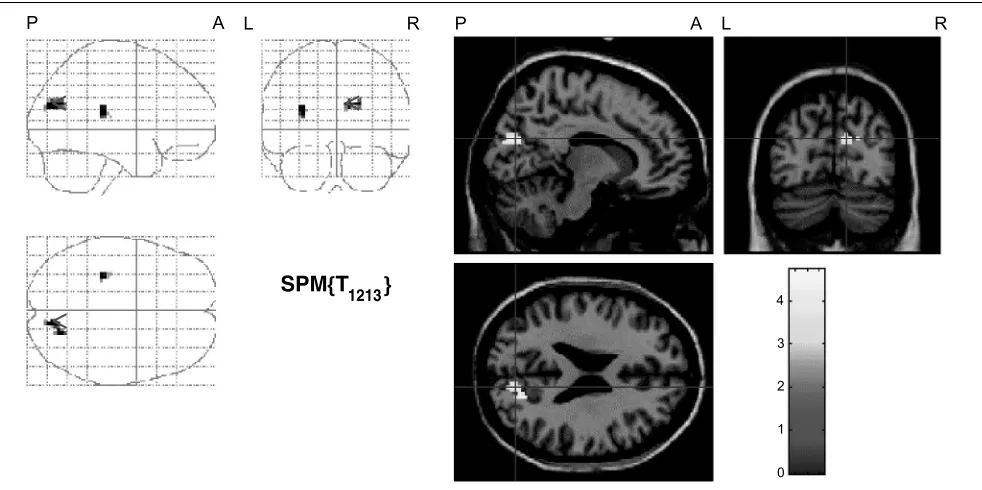
In the light of these patterns of activation, we calcu-lated an additional contrast that directly examined the overlap in the activation patterns from the four sorts of inferences. This contrast displays the areas active during all four sorts of inferences, but it does not display any areas that yield a significant activation for only one of the four types of inference (see Methods for a description of the procedure). Table 3 and Figure 1 present the active areas in this contrast. As the single contrasts already suggested, all four sorts of inference led to activity in the
Table 3. Activation Clusters in a Contrast between the Images Acquired during All Four Sorts of Inference and Those Acquired
during the Rest Intervals
Talairach Coordinates
Location z Score Size (Voxels) x y z
All inferences versus rest interval
Parietal
Left precuneus (BA 7) 6.00 25** 18 58 55
Right precuneus (BA 7) 4.72 16* 15 65 45
Right superior parietal gyrus (BA 7) 6.59 41*** 27 56 55
Temporal
Left middle temporal gyrus (BA 21) 7.40 46*** 59 32 2
Right middle temporal gyrus (BA 21) 5.16 25** 65 15 2
Left superior temporal gyrus (BA 38) 4.57 15* 54 14 21
Frontal
Left middle frontal gyrus (BA 46) 5.59 19* 51 25 24
Left inferior frontal gyrus (BA 47) 5.16 27** 48 43 15
Right middle frontal gyrus (BA 6) 4.69 15* 30 1 47
The clusters were masked inclusively by the comparisons: visuospatial-versus-rest, visual-versus-rest, spatial-versus-rest, and control-versus-rest intervals.
*p< .05, corrected for multiple comparisons across the whole brain.
**p< .01, corrected for multiple comparisons across the whole brain.
bilateral precuneus (BA 7), right superior parietal gyrus (BA 7), bilateral middle temporal gyrus (BA 21), left superior temporal gyrus (BA 38), left inferior and middle frontal gyri (BA 47, 46) corresponding to dorsolateral prefrontal cortex (DLPFC), and middle frontal gyrus (BA 6) corresponding to premotor cortex. Owing to the increased statistical power of this contrast, these clusters were larger and had higherzvalues than those in the single contrasts.
The main aim of the brain imaging study was to determine whether the four sorts of reasoning prob-lems activated different regions of the brain. The con-trol inferences were identical to the other inferences in all respects except that the relations in them are neither easy to visualize nor easy to envisage spatially. Hence, we used them as a baseline in separate contrasts with each of the three other types of inference: visuospatial, spatial, and visual. Table 4 summarizes the results. There were no reliable differences in activation between the control inferences and the visuospatial and spatial inferences. However, in comparison to the control inferences, the visual inferences led to additional acti-vation in an area that covers parts of the visual associ-ation cortex corresponding to V2 (BA 18) and the precuneus (BA 31). To determine the location of the activation more precisely, we counted the exact number of voxels falling into each of these areas: 11 of the 33 active voxels were in BA 18, 17 were in BA 31, and the remainder were in BA 17. Surprisingly, this contrast also revealed increased activation in the insula (BA 13).
DISCUSSION
We used behavioral and imaging experiments to exam-ine the cognitive and neural processes underlying rea-soning based on various sorts of relations. In what
Table 4. Activation Clusters in Contrasts between the Control
Inferences and the Three Other Sorts of Inference
Talairach Coordinates
Location
z Score
Size
( Voxels) x y z
Visual versus control inferences
Occipito-parietal
Right precuneus (BA 18/31)
4.45 33** 12 72 26
Sublobar
Left insula (BA 13)
4.68 17* 30 31 21
Spatial versus control inferences
No additional activity measured
Visuospatial versus control inferences
No additional activity measured
*p< .05, corrected for multiple comparisons across the whole brain.
**p< .01, corrected for multiple comparisons across the whole brain.
Figure 1. Reasoning with all four sorts of relation activated bilateral parietal cortex. The figure shows the SPM(Z)s of the activation common to
contrasts between the four relations and the rest interval. In the left-hand pictures, thezvalues were transferred to an arbitrary gray scale, and
projected onto sagittal, coronal, and transverse sections of a standard brain template. In the right-hand pictures, thezvalues were plotted according
to the color scale given right of each transverse section (L = left hemisphere; R = right hemisphere; A = anterior end; P = posterior end). Crosshairs are positioned in the local peak voxel for the respective contrast and brain area (see Table 3 for other activations). All clusters are
follows, we sketch how the behavioral findings resolve the inconsistency in the previous literature about whether imageability enhances reasoning. We then use the brain imaging data to elucidate the nature of mental representations. Finally, we draw some conclu-sions about mental imagery, deductive reasoning, and working memory.
The experiments yielded a striking result contrary to the orthodox hypothesis that visual images facilitate reasoning. In fact, they impeded reasoning. They slowed it down in comparison with the other sorts of relations: visuospatial, spatial, and control relations, which tend not to differ reliably in the time that they require for reasoning. The most plausible explanation for this pattern of results is that reasoning is normally based on spatial or abstract mental models. Visual relations, however, spontaneously elicit imagery that is not pertinent to reasoning, and it accordingly takes longer to recover a representation appropriate for reasoning. It is conceivable that all reasoning is based on spatial models, which are pressed into service even for nonspatial relations. It follows from this hypothesis that spatial relations should be dealt with fastest of all. Experiment 3 and the training experiment both showed a trend in this direction (see Table 1), but it is hardly robust.
Previous studies of imagery and reasoning have led to inconsistent results. But, as we argued in the Introduc-tion, these studies have overlooked the distinction between visual and spatial representations. Indeed, the
studies that produced a facilitating effect of ‘‘imagery’’ tended to use materials that were easy to represent spatially, whereas the studies that found no such effect tended to use materials that evoked visual imagery (for details, see Knauff & Johnson-Laird, 2002).
Our brain imaging data provide more evidence for a distinction between visual and spatial representations in reasoning. Our first discovery was that reasoning in general evoked activity in the superior parietal cortex and the precuneus. The parietal cortex is supposed to play a major role in spatial processing and in the integra-tion of sensory informaintegra-tion from all modalities into egocentric spatial representations (Xing & Andersen, 2000; Bushara et al., 1999; Andersen, 1997; Andersen, Snyder, Bradley, & Xing, 1997; Colby & Duhamel, 1996; Kolb & Wishaw, 1996). Activation in this area is also interpreted as indicating the use of spatial working memory (Oliveri et al., 2001; Postle, Berger, & D’Esposito, 1999; Smith & Jonides, 1998; Baker, Frith, Frackowiak, & Dolan, 1996). A recent model of the functional network underlying spatial cognition, primarily in navigation, treats parieto-occipital regions as implicated in comput-ing head-centered representations to produce spatial representations of the environment that are held in the precuneus (Burgess, Maguire, Spiers, & O’Keefe, 2001; Maguire, 2001). Previous brain imaging studies of reason-ing have similarly implied that parietal cortex plays a key role in reasoning based on mental models, because of their abstract spatial nature (see Knauff et al., 2002; Goel & Dolan, 2001; but cf. Goel, Gold, Kapur, & Houle, 1998).
Figure 2. Reasoning about visual relations, that is, those that are easy to visualize but hard to envisage spatially, additionally activated areas in the
secondary visual cortex corresponding to V2. The figure shows the SPM(Z)s of the activation from the contrast between visual problems and control
problems. In the left-hand pictures, allzvalues were transferred to an arbitrary gray scale, and projected onto sagittal, coronal, and transverse sections
of a standard brain template. In the right-hand pictures,zvalues are plotted according to the color scale given right of each transverse section (L =
left hemisphere; R = right hemisphere; A = anterior end; P = posterior end). Crosshairs are positioned in the local peak voxel for the respective
Our second discovery was that only reasoning based on visual relations evoked additional activity in visual association cortex, V2 (see also the results from a previous fMRI study of visual imagery conducted by our group: Knauff, Kassubek, Mulack, Greenlee, 2000). This region of occipital cortex seems likely to play a key role in visual imagery. It is consistently activated when participants have to visualize objects based on verbal descriptions or previous experience (e.g., Kosslyn et al., 1999; D’Esposito et al., 1997; Kosslyn, Thompson, & Alpert, 1997; Kosslyn, Thompson, Kim, & Alpert, 1995; Mellet, Tzourio, Denis, & Mazoyer, 1995; Mellet et al., 1996; Roland & Gulya´s, 1995). Lesions in this region have a devastating effect on the ability to form visual mental images (e.g., Ishai, Ungerleider, Martin, & Haxby, 2000; Farah, 1995).
The contrast between problems based on visual rela-tions and the rest intervals failed to show activation of secondary visual cortex. This failure appears to weaken our interpretation of the results. However, the lack of such activation may merely reflect the inappropriate use of rest intervals as a subtractive baseline in brain imaging studies. Several recent studies have underlined this point, because they have shown that rest intervals yield considerable neuronal activity in regions underlying working memory (Gusnard, Raichle, & Raichle, 2001; Mazoyer et al., 2001; Newman, Twieg, & Carpenter, 2001). This activity may be a default mode of brain functioning or a peaking of task-irrelevant thoughts in the breaks between experimental problems. Hence, the lack of activity in visual cortex in this contrast may merely indicate that the participants engaged in thoughts recruiting visual imagery during the rest inter-vals. It is accordingly crucial to use at least one other baseline that matches the experimental problems in everything except the cognitive process of interest. Another reason for the lack of activation in the contrast with rest intervals might be the fixation cross that was displayed throughout the entire experiment to minimize eye movements (see Methods). Possibly, this visual input was more strongly attended to during the rest interval, thus covering other neural activities in the contrast of visual problems and the rest interval.
One interpretation of our results is that they reflect the well-known distinction between the ‘‘what’’ and the ‘‘where’’ pathways in visual processing and working memory. This distinction has been supported by neuro-imaging studies of transformation tasks such as mental rotation (e.g., Barnes et al., 2000; Belger et al., 1998; Alivisatos & Petrides, 1997; Cohen et al., 1996; New-combe et al., 1987; Ungerleider & Mishkin, 1982; Unger-leider, Courtney, & Haxby, 1998). It is also consistent with Kosslyn’s hypothesis that mental imagery relies on two different sorts of processes—one visual and one spatial (e.g., Kosslyn, 1994).
Our own interpretation of the results is that they reflect two different sorts of mental representation. Vision yields
a series of representations: Early processes construct images, that is, 2-D representations of intensities, tex-tures, groupings, and so forth, but later vision yields a 3-D model of what is where (Marr, 1982). The phenomena of visual imagery sometimes depend on the manipulations of 2-D images, but sometimes on the manipulation of 3-D models. The time taken to judge whether two pictures are of the same object increases linearly with the angular difference between the orientations of the object in the two pictures (Shepard & Metzler, 1971). This result holds for rotations in the picture plane, but it also holds for rotations in depth. As Metzler and Shepard (1982, p. 45) wrote: ‘‘These results seem to be consistent with the notion that . . . subjects were performing their mental operations upon internal representations that were more analogous to three-dimensional objects portrayed in the two-dimensional pictures than to the two-dimensional pictures actually presented.’’ In other words, the partici-pants were rotating models, not images. Models that may be spatial in form ( Johnson-Laird, 1998; Kosslyn, 1994, p. 324) appear to underlie all sorts of reasoning, but the contents of an inference may also invoke visual images that are not essential to the process of reasoning and can impede the process. In a reasoning task, individuals develop facility in constructing mental models from all sorts of relations. Such models will be spatial in form for visuospatial and spatial relations, and, as long-standing evidence suggests, control relations are also likely to elicit spatial models (see, e.g., Johnson-Laird, 1998; De Soto et al., 1965). However, in the case of visual relations, such as ‘‘The dog is dirtier than the cat,’’ reasoners cannot suppress a spontaneous visual image of the appearance of the animals: They are both dirty. Its construction calls for additional activity in visual association cortex. It retards the construction of a mental model that represents the relative degrees of dirtiness, and this model is essential for the inferential process. Hence, the construction of the image slows the process of reasoning.
entities related, say, according to how clean they are, than between entities related according to how smart they are. This hypothesis seems improbable because it is again unable to explain the differences in activity in secondary visual cortex.
Our results have implications for other theories of reasoning and of the role of working memory. A major alternative to the model theory is that reasoners rely on formal rules of inference akin to those of formal logic, and that inference is a process of proof in which the rules are applied to mental sentences (e.g., Braine & O’Brien, 1998; Rips, 1994; but cf. Stenning & Ober-lander, 1995). The formal rules govern sentential con-nectives such as ‘‘if’’ and quantifiers such as ‘‘any,’’ and they can account for relational inferences when they are supplemented with axioms governing transitivity such as: For anyx,y, andz, if xis taller thanyandyis taller thanz, then xis taller thanz. The formal rule theories accordingly imply that reasoning is a linguistic and syntactic process, and so it should depend on regions in left hemisphere. The model theory, however, postu-lates that a major component of reasoning is not verbal, and so ‘‘the theory predicts that the right cerebral hemisphere should play a significant role in reasoning’’ ( Johnson-Laird, 1995, p. 1005). Wharton and Grafman (1998) have argued that the effects of brain damage on reasoning corroborate formal rule theories and run counter to the model theory. However, our results, in common with other studies (e.g., Kroger, Cohen, & Johnson-Laird, submitted), cast doubt on this analysis. Linguistic areas underlie the comprehension of the premises. Reasoning itself, as the model theory predicts, also implicates parietal regions thought to mediate spatial representations, including regions in right hemi-sphere. Such activity is inexplicable according to formal rule theories of reasoning.
Reasoning yields activity in DLPFC, pointing to addi-tional executive processes in working memory (Duncan & Owen, 2000; Cohen, Botvinick, & Carter, 2000; Carter, Botvinick, & Cohen, 1999; Smith & Jonides, 1999; Bush et al., 1998). Petrides (1995, p. 85) argues that this region is typically implicated ‘‘when several pieces of information in working memory need to be monitored and manipulated.’’ This view has its supporters (see D’Esposito, 2001; Owen, 2000; Petrides, 2000; D’Esposito et al., 1998) and its critics (Levy & Goldman-Rakic, 2000; Mecklinger, Bosch, Gruenewald, Bentin, & von Cramon, 2000; Courtney, Ungerleider, Keil, & Haxby, 1996). A related possibility is that the region underlies the integration of multiple relations. Waltz et al. (1999) showed that patients with damage to prefrontal cortex were strongly impaired in any sort of reasoning calling for the integration of relations, whereas they per-formed normally in episodic and semantic memory tasks. It seems reasonable to conclude that activation in this region reflects the manipulation or integration of mental representations.
Conclusions
The cortical activity evoked by relational reasoning depends on the nature of the relations. Visual rela-tions, such as ‘‘cleaner’’ or ‘‘dirtier than,’’ evoke visual images, whereas other relations do not. All relations, however, lead to the construction of models that underlie the inferential process. These models are spatial in form for spatial relations, such as ‘‘north’’ or ‘‘south of,’’ and for visuospatial relations, such as ‘‘above’’ or ‘‘below.’’ They may also be spatial for control relations, such as ‘‘better’’ or ‘‘worse than.’’ This view is consistent both with the finding that visual relations slow the process of reasoning and activate regions in secondary visual cortex, and with the finding that all relations activate regions in parietal cortex underlying spatial representations. The phenomena are consistent with the theory of mental models, but present difficulties for theories of reasoning based on formal rules of inference. A further corollary is that visual imagery is not a mere epiphenomenon playing no causal role in reasoning (e.g., Pylyshyn, 1981, in press). It can be a nuisance because it impedes reasoning.
METHODS
Norming Studies
We used the data from both studies to select four subsets of relational terms that fell into the categories defined in the Introduction: visual, visuospatial, spatial, and control relations. The relations used in the subse-quent experiments and their ratings are presented in Table 5. The ratings for these relations differed signifi-cantly (Study 1: Friedman analysis of variance,F= 22.67,
p < .001; Study 2: Friedman analysis of variance, F = 38.33, p< .001).
Behavioral Studies of Inference
In Experiment 1, 22 Princeton undergraduates acted as their own controls and evaluated eight inferences based on each of the three sorts of relations (visuospatial, visual, and control). The resulting 24 inferences were presented in a different random order to each partic-ipant. Half of the inferences were three-term series and half of them were four-term series. The relations in the inferences were those in Table 5. All inferences used the same nouns (‘‘dog,’’ ‘‘cat,’’ ‘‘ape,’’ and, for four-term inferences: ‘‘bird’’). Half the problems had valid con-clusions and half had invalid concon-clusions.
The presentation of the premises was self-paced and followed the separate-stage paradigm introduced by
Potts and Scholz (1975). Each premise and putative conclusion was presented on a separate screen and participants proceeded from one to the next by pressing the spacebar. Premises were presented in black letters and conclusions in red letters. The participants were told to evaluate whether the conclusion followed necessarily from the premises. They made their response by pressing either a ‘‘yes’’ or a ‘‘no’’ key on the keyboard. To familiar-ize the participants with the procedure before the experi-ment, there were four practice trials using other relations from the initial rating study. The program recorded the reading times for each of the premises separately, and the response to the conclusion and its latency.
In Experiment 2, 20 Princeton undergraduates acted as their own controls and carried out a conditional reasoning task that used the three sorts of relations (visual, visuospatial, and control). The participants had to evaluate conditional inferences in the form of modus ponens, for example:
If the ape is smarter than the cat, then the cat is smarter than the dog.
The ape is smarter than the cat. Does it follow:
The ape is smarter than the dog?
In addition, however, the experiment manipulated the difficulty of the inferences by using converse relations. The easiest inferences were of the following form exem-plified in the preceding example:
where aRb denotes a premise asserting that a transitive relation R, such as ‘‘smarter than,’’ holds between entities a and b. The difficulty of the inference was increased by using the converse relation R0, such as ‘‘dumber than,’’ in the following two sorts of inference:
The hardest sort of inference used a converse relation in one of the premises and in the conclusion:
The participants evaluated a valid and an invalid inference of the four sorts (1 – 4) for each of the three
Table 5. Mean Ratings for Ease of Forming Visual Images and
Spatial Layouts for the Relations Selected from Two Norming Studies for Further Experimental Investigation (Knauff & Johnson-Laird, 2002)
Study 1 Study 2
Relational Terms
Visual Ratings
Spatial Ratings
Single Bipolar Rating
Visual relations
Cleaner – dirtier 5.1 1.6 2.1
Fatter – thinner 4.8 2.0 1.6
Control relations
Better – worse 2.1 1.1 0.7
Smarter – dumber 2.8 1.2 0.7
Visuospatial relations
Above – below 5.3 5.4 0.9
Front – back 5.2 5.3 0.8
Spatial relations
North – south 2.7
Ancestor – descendant 0.9
The scales in Study 1 ranged from 1 (‘‘very difficult’’) to 7 (‘‘very easy’’). The scales in Study 2 ranged from +3 (‘‘easy to form a visual image’’)
through 0 to3 (‘‘easy to form a spatial layout’’).
1: If aRb then bRc.
aRb.
Does it follow: aRc?
2: If aRb then cR0b.
aRb.
Does it follow: aRc?
3: If bR0a then bRc.
bR0a.
Does it follow: aRc?
4: If bR0a then bRc.
bR0a.
sorts of relations (visual, visuospatial, and control), yielding a total of 24 inferences. The inferences were presented in a different random order to each partic-ipant. The procedure was identical to that of the first experiment, and there were four practice trials before the experiment proper.
In Experiment 3, 24 students of Freiburg University acted as their own controls and carried out 16 three- and 16 four-term series inferences that were identical in form to those in the first experiment. The inferences were based on four kinds of relations: spatial, visuospatial, visual, and control relations. The spatial relations were ‘‘ancestor of’’ and ‘‘descendant of’’ and ‘‘further north’’ and ‘‘further south’’ (all single words in German). There were two valid and two invalid inferences of each of the four sorts in both the three- and four-term series inferences (a total of 32 inferences). These inferences were presented in a different random order to each participant. The procedure was identical to that of the other experiments.
Imaging Study
Participants
We tested 12 male right-handed German native speakers between 21 and 35 years with normal or corrected-to-normal vision, corrected-to-normal hearing, and with no tendency to suffer from claustrophobia (mean age 23.7 years). These volunteers had no magnetic metal in their bodies, no history of neurological or psychiatric disorder, and no history of significant drug abuse. All of them gave their informed consent to take part in the study. As a result of uncorrectable head movements, one participant was excluded from the analysis.
Materials and Experimental Design
The materials were based on the previous behavioral studies (Knauff & Johnson-Laird, 2000, 2002). The par-ticipants acted as their own controls and evaluated eight inferences based on each of the four types of relation: visuospatial, visual, spatial, and control relations (see Table 5). All the inferences used the same nouns (‘‘dog,’’ ‘‘cat,’’ and ‘‘ape’’) to minimize differences arising from the entities in the problems, for example:
The dog is cleaner than the cat. The ape is dirtier than the cat. Does it follow:
The dog is cleaner than the ape?
The participants were told to evaluate whether the conclusion followed from the premises. In the exam-ple, ‘‘cleaner’’ and ‘‘dirtier’’ are used once in each premise, and ‘‘cleaner’’ occurs in the conclusion. But, in the experiment as a whole, each relation and its converse occurred equally often in each premise and in the conclusion.
The experiment used a blocked design in which each block contained two problems. The two problems in one block used two different relations of the same sort (visual, spatial, visuospatial, and control). Half of the problems were valid, and half were invalid. The alloca-tion of problems to a block was made at random, and it remained constant throughout the experiment for all participants. The 32 problems were presented in four separate runs wherein each contained four blocks. In this way, we controlled for effects of learning and fatigue and for fluctuations in the scanner’s sensitivity over runs. The order of blocks within each run for each participant was random.
In each block, two problems were presented one after the other. Between each sentence, there was a silent break of 5 sec during which scanning was carried out: The hemodynamic response was thus sampled in the absence of task-related auditory input. A rest inter-val of similar length was included between the blocks throughout the experiment. This rest interval differed from the silent breaks only because a small fixation cross was presented to minimize eye movements. The cross remained visible on the screen for the duration of the rest interval and through the presentation of each problem. The participants responded to the problems by pressing a ‘‘yes’’ or a ‘‘no’’ button during the response interval after the presentation of each con-clusion. To prepare the participants for the start of the next problem, the cross on the screen disappeared one second before the end of the response interval and, where relevant, for one second before the end of the rest interval.
Procedures and Scanning Techniques
pulse emitted by the scanner at the start of the collection of each functional image.
Functional images were collected in a gradient-recalled echo-planar imaging (EPI) sequence, allowing the sampling of 24 parallel slices effectively covering the whole brain (TR 10.2 sec, TE 66 msec, fatsat, FA 908, FOV 256256 mm, 22 mm in-plane resolution, 4-mm slice thickness). Two rest scans were collected in the begin-ning of each run in order for T1 effects to stabilize. These images were discarded from further analysis. At the end of the experiment, a functional EPI image was acquired with 40 slices and a sagittal T1-weighted magnetization-prepared rapid-acquisition gradient-echo (MP-RAGE) image of the entire brain (160 slices, TR 40 msec, TE 6 msec, FA 408, FOV 256256 mm, voxel size 11
1 mm). This image was used for coregistration and normalization during image preprocessing.
Data Analysis
All images were preprocessed and analyzed with the Statistical Parametric Mapping 99 software (SPM99). Functional and anatomical images were reoriented so that the anterior commisure corresponded to the origin of the 3-D standard coordinate system used in SPM99. All coordinates used to describe the results of the experiment corresponded to the system originally intro-duced by Talairach and Tournoux (1988). The functional images collected during a run were subsequently realigned and corrected for motion in the scanner with the two-step realignment procedure embedded in SPM99 (Friston, Williams, Howard, Frackowiak, & Turner, 1996). The translation and rotation corrections did not exceed 2.9 mm and 2.58for any run. Each participant’s anatomi-cal image series was subsequently coregistered with the 40-slice EPI image volume collected at the end of the experiment (cf. Ashburner & Friston, 1997). The mean images of the runs and all other functional images were then coregistered with the 40-slice EPI image volume. The parameters for spatial normalization (Friston, Ash-burner, et al., 1995) were determined from the anatomi-cal image volumes collected from each participant, and they were applied to the participant’s functional image volumes. A new set of normalized functional images was created for which the original spatial resolution of the EPI volumes was interpolated from 224 mm to an isotropic voxel size of 3 mm3. The realigned normalized images were finally smoothed with a 6-mm full width half maximum Gaussian kernel.
The hemodynamic response to the experimental cycle was modeled with a fixed-response box-car function, which was convolved with the canonical hemodynamic response function to model the delayed onset, early peak, and late undershoot of the hemodynamic response (Veltman & Hutton, 2001). Low-frequency confounds were excluded from the model with a high-pass filter of twice the length of the experimental run. Variations in
global signal intensity were not removed, because of the danger of producing spurious local changes in the direc-tion opposite to any change in the global signal. For each experimental run, the function contained the appro-priately placed models of the hemodynamic response to the four sorts of problems. The realignment parame-ters for each run were included in the model as cova-riates to correct for the effects of head movement on the hemodynamic response. In the special case of colinearity of realignment parameter sets (intercorrelationp> .80), we included only the set showing lower correlations with the remaining four parameter sets.
The inferential task was complicated, it depended on many different cognitive processes, and the block design relied on an extended time scale. Hence, we expected activation differences for all contrasts to be widely spread rather than clearly focused. We therefore made analyses on all contrasts at the level of clusters (Poline, Holmes, Worsley, & Friston, 1997; Friston, Holmes, Poline, Price, & Frith, 1995). SPMs of all contrasts were kept at a threshold of z = 3.1, corresponding to p < .001, and we identified all clusters that were significant in terms of their size (p< .05 corrected for multiple comparisons across the whole brain, resulting in a cluster size of 15 voxels).
For the more fine-grained second comparison described in Results, the four contrasts (visual, visuo-spatial, visuo-spatial, and control inferences vs. the rest inter-val) were examined with a form of conjunction analysis. For this purpose, a new contrast was specified between the images acquired during all experimental conditions and those acquired during the rest intervals. This con-trast was inclusively masked with the concon-trast images calculated for the four single contrasts, which were initially held at a threshold of p= .05 uncorrected for multiple comparisons. This analysis displayed only those voxels associated with significantly higher signal inten-sity during reasoning with all sorts of relation as com-pared to the rest intervals, and it did not display any voxels significant for reasoning with only one sort of relation. The analysis is not, strictly speaking, a conjunc-tion analysis, for which an intersecconjunc-tion SPM(T) is calcu-lated for the single contrasts to perform statistical inference at the voxel level only (Friston, 1997).
Acknowledgments
The research was supported in part by grants from the Deutsche Forschungsgemeinschaft to MK (DFG; Grant Kn465/ 2-4) and by the National Science Foundation to PJ-L (Grant 0076287) to study strategies in reasoning. The authors are grateful to Emily Janus, Martin Schumacher, Joachim Spreer, Gerhard Strube, Juliane Wilcke, Wolfgang Zinke, for helpful discussions of the research. We also thank two anonymous reviewers for many useful comments on the manuscript.
The data reported in this experiment have been deposited in The fMRI Data Center (http://www.fmridc.org). The accession number is 2-2002-113BQ.
REFERENCES
Alivisatos, B., & Petrides, M. (1997). Functional activation of the human brain during mental rotation.Neuropsychologia, 35,111 – 118.
Andersen, R. A. (1997). Multimodal integration for the representation of space in the posterior parietal cortex.
Philosophical Transactions of the Royal Society of London, Series B: Biological Sciences, 352,1421 – 1428.
Andersen, R. A., Snyder, L. H., Bradley, D. C., & Xing, J. (1997). Multimodal representation of space in the posterior parietal cortex and its use in planning movements.Annual Review of Neuroscience, 20,303 – 330.
Ashburner, J., & Friston, K. J. (1997). The role of registration and spatial normalization in detecting activations in functional imaging.Clinical MRI/Developments in MR, 7,
26 – 28.
Baker, S. C., Frith, C. D., Frackowiak, R. S. J., & Dolan, R. J. (1996). Active representation of shape and spatial location in man.Cerebral Cortex, 6,612 – 619.
Barnes, J., Howard, R. J., Senior, C., Brammer, M., Bullmore, E. T., Simmons, A., Woodruff, P., & David, A. S. (2000). Cortical activity during rotational and linear transformations.
Neuropsychologia, 38,1148 – 1156.
Belger, A., Puce, A., Krystal, J. H., Gore, J. C., Goldman-Rakic, P., & McCarthy, G. (1998). Dissociation of mnemonic and perceptual processes during spatial and nonspatial working memory using fMRI.Human Brain Mapping, 6,14 – 32. Block, N. (1981).Imagery.Cambridge: MIT Press.
Braine, M. D. S., & O’Brien, D. P. (Eds.) (1998).Mental logic.
Mahwah, NJ: Erlbaum.
Burgess, N., Maguire, E. A., Spiers, H. J., & O’Keefe, J. (2001). A temporoparietal and prefrontal network for retrieving the spatial context of lifelike events.Neuroimage, 14,439 – 453. Bush, G., Whalen, P. J., Rosen, B. R., Jenike, M. A., McInerney,
S. C., & Rauch, S. L. (1998). The counting Stroop: An interference task specialized for functional neuroimaging-validation study with functional MRI.Human Brain Mapping, 6,270 – 282.
Bushara, K. O., Weeks, R. A., Ishii, K., Catalan, M.-J., Tian, B., Rauschecker, J. P., & Hallett, M. (1999). Modality-specific frontal and parietal areas for auditory and visual spatial localization in humans.Nature Neuroscience, 2,759 – 766. Carter, C. S., Botvinick, M. M., & Cohen, J. D. (1999). The
contribution of the anterior cingulate cortex to executive processes in cognition.Reviews in Neuroscience, 10,49 – 57. Clark, H. H. (1969). Linguistic processes in deductive
reasoning.Psychological Review, 76,387 – 404.
Clement, C. A., & Falmagne, R. J. (1986). Logical reasoning, world knowledge, and mental imagery: Interconnections in cognitive processes.Memory and Cognition, 14,299 – 307. Cohen, J. D., Botvinick, M., & Carter, C. S. (2000). Anterior
cingulate and prefrontal cortex: Who’s in control?Nature Neuroscience, 3,421 – 423.
Cohen, M. S., Kosslyn, S. M., Breiter, H. C., DiGirolamo, G. J., Thompson, W. L., Anderson, A. K., Bookheimer, S. Y., Rosen, B. R., & Belliveau, J. W. (1996). Changes in cortical activity during mental rotation: A mapping study using functional MRI.Brain, 119,89 – 100.
Colby, C. L., & Duhamel, J.-R. (1996). Spatial representations for action in parietal cortex.Cognitive Brain Research, 5,
105 – 115.
Courtney, S. M., Ungerleider, L. G., Keil, K., & Haxby, J. V.
(1996). Object and spatial visual working memory activate separate neural systems in human cortex.Cerebral Cortex, 6,39 – 49.
D’Esposito, M. (2001). Functional neuroimaging of working memory. In R. Cabeza & A. Kingstone (Eds.),Handbook of functional neuroimaging of cognition( pp. 293 – 327 ). Cambridge: MIT Press.
D’Esposito, M., Aguirre, G. K., Zarahn, E., Ballard, D., Shin, R. K., & Lease, J. (1998). Functional MRI studies of spatial and nonspatial working memory.Cognitive Brain Research, 7,1 – 13.
D’Esposito, M., Detre, J. A., Aguirre, G. K., Stallcup, M., Alsop, D. C., Tippet, L. J., & Farah, M. J. (1997). A functional MRI study of mental image generation.Neuropsychologia, 35,
725 – 730.
De Soto, C. B., London, M., & Handel, M. S. (1965). Social reasoning and spatial paralogic.Journal of Personality and Social Psychology, 2,513 – 521.
Duncan, J., & Owen, A. M. (2000). Common regions of the human frontal lobe recruited by diverse cognitive demands.
Trends in Cognitive Sciences, 23,475 – 483.
Evans, J. St. B. T., Newstead, S. E., & Byrne, R. M. J. (1993).
Human reasoning. The psychology of deduction.Hove, UK: Erlbaum.
Farah, M. J. (1995). The neural bases of mental imagery. In M. S. Gazzaniga (Ed.),The cognitive neurosciences
( pp. 963 – 975). Cambridge: MIT Press.
Finke, R. A. (1989).Principles of mental imagery.Cambridge: MIT Press.
Friston, K. J. (1997). Imaging cognitive anatomy.Trends in Cognitive Sciences, 1,21 – 27.
Friston, K. J., Ashburner, J., Frith, C. D., Poline, J.-B., Heather, J. D., & Frackowiak, R. S. J. (1995). Spatial registration and normalization of images.Human Brain Mapping, 2,
165 – 189.
Friston, K. J., Holmes, A. P., Poline, J.-B., Price, C. J., & Frith, C. D. (1995). Detecting activations in PET and fMRI: Levels of inference and power.Neuroimage, 40,223 – 235.
Friston, K. J., Williams, S., Howard, R., Frackowiak, R. S. J., & Turner, R. (1996). Movement-related effects in fMRI time-series.Magnetic Resonance in Medicine, 35,346 – 355. Gabrieli, J. D. (1998). Cognitive neuroscience of human
memory.Annual Review of Psychology, 49,87 – 115. Goel, V., & Dolan, R. J. (2001). Functional neuroanatomy of
three-term relational reasoning.Neuropsychologia, 39,
901 – 909.
Goel, V., Gold, B., Kapur, S., & Houle, S. (1998). Neuroanato-mical correlates of human reasoning.Journal of Cognitive Neuroscience, 10,293 – 302.
Gusnard, D. A., Raichle, M. E., & Raichle, M. E. (2001). Searching for a baseline: Functional imaging and the resting human brain.Nature Review Neuroscience, 2,685 – 694. Huttenlocher, J. (1968). Constructing spatial images: A strategy
in reasoning.Psychological Review, 75,550 – 560.
Ishai, A., Ungerleider, L. G., Martin, A., & Haxby, J. V. (2000). The representation of objects in the human occipital and temporal cortex.Journal of Cognitive Neuroscience, 12,
35 – 51.
Johnson, M. K., & Raye, C. L. (1981). Reality monitoring.
Psychological Review, 88,67 – 85.
Johnson-Laird, P. N. (1972). The three-term series problem.
Cognition, 1,57 – 82.
Johnson-Laird, P. N. (1995). Models in deductive thinking. In M. S. Gazzaniga (Ed.),The cognitive neurosciences
( pp. 999 – 1008). Cambridge: MIT Press.
Johnson-Laird, P. N., Byrne, R. M. J., & Tabossi, P. (1989). Reasoning by model: The case of multiple quantification.
Psychological Review, 96,658 – 673.
Knauff, M. (1999). The cognitive adequacy of Allen’s interval calculus for qualitative spatial representation and reasoning.
Spatial Cognition and Computation, 1,261 – 290. Knauff, M., & Johnson-Laird, P. N. (2000). Visual and spatial
representations in spatial reasoning. In L. R. Gleitman & A. K. Joshi (Eds.),Proceedings of the Twenty-Second Annual Conference of the Cognitive Science Society( pp. 759 – 765). Mahwah, NJ: Erlbaum.
Knauff, M., & Johnson-Laird, P. N. (2002). Visual imagery can impede reasoning.Memory and Cognition, 30,
363 – 371.
Knauff, M., Kassubek, J., Mulack, T., & Greenlee, M. W. (2000). Cortical activation evoked by visual mental imagery as measured by functional MRI.NeuroReport, 11,3957 – 3962. Knauff, M., Mulack, T., Kassubek, J., Salih, H. R., & Greenlee,
M. W. (2002). Spatial imagery in deductive reasoning: A functional MRI study.Cognitive Brain Research, 13,
203 – 212.
Knauff, M., Rauh, R., Schlieder, C., & Strube, G. (1998). Mental models in spatial reasoning. In C. Freksa, C. Habel, & K. F. Wender (Eds.),Spatial cognition — an interdisciplinary approach to representation and processing of spatial knowledge( pp. 267 – 291). Berlin: Springer-Verlag. Kolb, B., & Wishaw, I. Q. (1996).Fundamentals in human
neuropsychology(4th ed.). New York: Freeman.
Kosslyn, S. M. (1980).Image and mind.Cambridge: Harvard University Press.
Kosslyn, S. M. (1994).Image and brain.Cambridge: MIT Press. Kosslyn, S. M., Pascual-Leone, A., Felician, O., Camposano, S., Keenan, J. P., Thompson, W. L., Ganis, G., Sukel, K. E., & Alpert, N. M. (1999). The role of area 17 in visual imagery: Convergent evidence from PET and rTMS.Science, 284,
167 – 170.
Kosslyn, S. M., Thompson, W. L., & Alpert, N. M. (1997). Neural systems shared by visual imagery and visual perception: A positron emission tomography study.Neuroimage, 6,
320 – 334.
Kosslyn, S. M., Thompson, W. L., Kim, I. J., & Alpert, N. M. (1995). Topographical representations of mental images in primary visual cortex.Nature, 378,496 – 498.
Kroger, J., Cohen, J. D., & Johnson-Laird, P. N. (submitted). A double dissociation between logic and mathematics. Landau, B., & Jackendoff, R. (1993). ‘‘What’’ and ‘‘where’’ in
spatial language and spatial cognition.Behavioral and Brain Sciences, 16,217 – 265.
Levy, R., & Goldman-Rakic, P. S. (2000). Segregation of working memory functions within the dorsolateral prefrontal cortex.
Experimental Brain Research, 133,23 – 32.
Logie, R. H. (1995).Visuo-spatial working memory.Hove, UK: Erlbaum.
Maguire, E. A. (2001). The retrosplenial contribution to human navigation: A review of lesion and neuroimaging findings.
Scandinavian Journal of Psychology, 42,225 – 238. Marr, D. (1982).Vision: A computational investigation
into the human representation and processing of visual information.San Francisco: W. H. Freeman.
Mazoyer, B., Zago, L., Mellet, E., Bricogne, S., Etard, O., Houde, O., Crivello, F., Joliot, M., Petit, L., & Tzourio-Mazoyer, N. (2001). Cortical networks for working memory and executive functions sustain the conscious resting state in man.Brain Research Bulletin, 54,287 – 298.
Mecklinger, A., Bosch, V., Gruenewald, C., Bentin, S., & von Cramon, D. Y. (2000). What have Klingon letters and faces in common? An fMRI study on content-specific working memory systems.Human Brain Mapping, 11,146 – 161.
Mellet, E., Tzourio, N., Crivello, F., Joliot, M., Denis, M., & Mazoyer, B. (1996). Functional anatomy of spatial mental imagery generated from verbal instructions.Journal of Neuroscience, 16,6504 – 6512.
Mellet, E., Tzourio, N., Denis, M., & Mazoyer, B. (1995). A positron emission tomography study of visual and mental exploration.Journal of Cognitive Neuroscience, 7,433 – 445. Mellet, E., Tzourio-Mazoyer, N., Bricogne, S., Mazoyer, B.,
Kosslyn, S. M., & Denis, M. (2000). Functional anatomy of high-resolution visual mental imagery.Journal of Cognitive Neuroscience, 12,98 – 109.
Metzler, J., & Shepard, R. N. (1982). Transformational studies of the internal representations of three-dimensional objects. In R. N. Shepard & L. A. Cooper (Eds.),Mental images and their transformations( pp. 25 – 71). Cambridge: MIT Press. Originally published in R. L. Solso (Ed.),Theories in cognitive psychology: The Loyola Symposium.Hillsdale, NJ: Erlbaum, 1974.
Newcombe, F., Ratcliff, G., & Damasio, H. (1987). Dissociable visual and spatial impairments following right posterior cerebral lesions: Clinical, neuropsychological and anatomical evidence.Neuropsychologia, 25,149 – 161.
Newman, S. D., Twieg, D. B., & Carpenter, P. A. (2001). Baseline conditions and subtractive logic in neuroimaging.
Human Brain Mapping, 14,228 – 235.
Newstead, S. E., Pollard, P., & Griggs, R. A. (1986). Response bias in relational reasoning.Bulletin of the Psychonomic Society, 24,95 – 98.
Oliveri, M., Turriziani, P., Carlesimo, G. A., Koch, G., Tomaiuolo, F., Panella, M., & Caltagirone, C. (2001). Parieto-frontal interactions in visual-object and visual – spatial working memory: Evidence from transcranial magnetic stimulation. Cerebral Cortex, 11, 606 – 618. Owen, A. M. (2000). The role of the lateral frontal cortex in
mnemonic processing: The contribution of functional neuroimaging.Experimental Brain Research, 133,33 – 43. Petrides, M. (1995). Functional organization of the human
frontal cortex for mnemonic processing: Evidence from neuroimaging studies.Annals of the New York Academy of Sciences, 15,85 – 96.
Petrides, M. (2000). The role of the mid-dorsolateral prefrontal cortex in working memory.Experimental Brain Research, 133,44 – 54.
Poline, J.-B., Holmes, A. P., Worsley, K. J., & Friston, K. J. (1997). Statistical inference and the theory of random fields. In Institute of Neurology (Ed.),SPM short course notes
(chap. 7; pp. 1 – 27). London, UK: Wellcome Department of Cognitive Neurology.
Postle, B. R., Berger, J. S., & D’Esposito, M. (1999). Functional neuroanatomical double dissociation of mnemonic and executive control processes contributing to working memory performance.Proceedings of the National Academy of Sciences, U.S.A., 96,12959 – 12964.
Potts, G. R., & Scholz, K. W. (1975). The internal representation of a three-term series problem.Journal of Verbal Learning and Verbal Behavior, 14,439 – 452.
Pylyshyn, Z. (1981). The imagery debate: Analogue media versus tacit knowledge.Psychological Review, 88,16 – 45. Pylyshyn, Z. (in press). Mental imagery: In search of a theory.
Behavioural and Brain Sciences.
Richardson, J. T. E. (1987). The role of mental imagery in models of transitive inference.British Journal of Psychology, 78,189 – 203.
Rips, L. J. (1994).The psychology of proof.Cambridge: MIT Press. Roland, P. E., & Gulya´s, B. (1995). Visual memory, visual
Rueckl, J. G., Cave, K. R., & Kosslyn, S. M. (1989). Why are ‘‘what’’ and ‘‘where’’ processed by separate cortical visual systems? A computational investigation.Journal of Cognitive Neuroscience, 1,171 – 186.
Shaver, P., Pierson, L., & Lang, S. (1975). Converging evidence for the functional significance of imagery in problem solving.
Cognition, 3,359 – 375.
Shepard, R. N., & Metzler, J. (1971). Mental rotation of three-dimensional objects.Science, 171,701 – 703. Siegel, S., & Castellan, N. J., Jr. (1988).Nonparametric
statistics for the behavioral sciences(2nd ed.). New York: McGraw Hill.
Smith, E. E., & Jonides, J. (1998). Neuroimaging analyses of human working memory.Proceedings of the National Academy of Sciences, U.S.A., 95,12061 – 12068. Smith, E. E., & Jonides, J. (1999). Storage and executive
processes in the frontal lobes,Science, 283,1657 – 1661. Smith, E. E., Jonides, J., Koeppe, R. A., Awh, E., Schumacher,
E. H., & Minoshima, S. (1995). Spatial versus object working memory: PET investigations.Journal of Cognitive
Neuroscience, 7,337 – 356.
Squire, L. R., & Zola, S. M. (1996). Structure and function of declarative and nondeclarative memory systems.
Proceedings of the National Academy of Sciences, U.S.A., 93,
13515 – 1322.
Stenning, K., & Oberlander, J. (1995). A cognitive theory of graphical and linguistic reasoning: Logic and implementation.
Cognitive Science, 19,97 – 140.
Sternberg, R. J. (1980). Representation and process in linear
syllogistic reasoning.Journal of Experimental Psychology: General, 109,119 – 159.
Talairach, J., & Tournoux, P. (Eds.) (1988).Co-planar atlas of the human brain: 3-dimensional proportional system.
Stuttgart: Thieme.
Tulving, E., & Craik, F. I. M. ( Eds.) (2000).The Oxford handbook of memory.Oxford, UK: Oxford University Press. Ungerleider, L. G., Courtney, S. M., & Haxby, J. V. (1998).
A neural system for human visual working memory.
Proceedings of the National Academy of Sciences, U.S.A., 95,
883 – 890.
Ungerleider, L. G., & Mishkin, M. (1982). Two cortical visual systems. In D. J. Ingle, M. A. Goodale, & R. J. W. Mansfield ( Eds.),Analysis of visual behaviour( pp. 549 – 587 ). Cambridge: MIT Press.
Veltman, D., & Hutton, C. (2001).SPM99 Manual.London, UK: Wellcome Department of Cognitive Neurology. Available at: www.fil.ion.ucl.ac.uk/spm/course/manual/man.htm. Waltz, J. A., Knowlton, B. J., Holyoak, K. J., Boone, K. B.,
Mishkin, F. S., de Menezes Santos, M., Thomas, C. R., & Miller, B. L. (1999). A system for relational reasoning in human prefrontal cortex.Psychological Science, 10,
119 – 125.
Wharton, C. M., & Grafman, J. (1998). Deductive reasoning and the brain.Trends in Cognitive Science, 2,54 – 59.