Open Access
Proceedings
Application of reverse-phase HPLC to quantify oligopeptide
acetylation eliminates interference from unspecific acetyl CoA
hydrolysis
Rune Evjenth
1, Kristine Hole
1,2,3, Mathias Ziegler
1and Johan R Lillehaug*
1Address: 1Department of Molecular Biology, University of Bergen, N-5020 Bergen, Norway, 2Department of Surgical Sciences, University of Bergen, N-5020 Bergen, Norway and 3Department of Surgery, Haukeland University Hospital, N-5021 Bergen, Norway
Email: Rune Evjenth - [email protected]; Kristine Hole - [email protected]; Mathias Ziegler - [email protected]; Johan R Lillehaug* - [email protected]
* Corresponding author
Abstract
Protein acetylation is a common modification that plays a central role in several cellular processes. The most widely used methods to study these modifications are either based on the detection of radioactively acetylated oligopetide products or an enzyme-coupled reaction measuring conversion of the acetyl donor acetyl CoA to the product CoASH. Due to several disadvantages of these methods, we designed a new method to study oligopeptide acetylation. Based on reverse phase HPLC we detect both reaction products in a highly robust and reproducible way. The method reported here is also fully compatible with subsequent product analysis, e.g. by mass spectroscopy. The catalytic subunit, hNaa30p, of the human NatC protein N-acetyltransferase complex was used for N-terminal oligopeptide acetylation. We show that unacetylated and acetylated oligopeptides can be efficiently separated and quantified by the HPLC-based analysis. The method is highly reproducible and enables reliable quantification of both substrates and products. It is therefore well-suited to determine kinetic parameters of acetyltransferases.
Background
Acetylation of proteins is a common protein modification that occurs either in the N-terminal α amino group (Nα -acetylation) or the ε amino group of lysine residues (Nε -acetylation). The corresponding acetylation reactions are catalysed by Nα-acetyltransferases (NATs) or histone acetyltransferases/lysine acetyltransferases (HATs/KATs), respectively [1,2].
The important biological functions of protein acetylation
acetyltransferases to determine their kinetic properties, substrate specificities and catalytic mechanisms. For most of the enzymatic analyses, two different kinds of acetyl transfer assays are used. One uses radioactively labelled acetyl CoA as substrate [3]. The generation of radioac-tively labelled oligopeptides is monitored by a filter-bind-ing assay and liquid scintillation countfilter-bind-ing [3]. This assay is very sensitive [4], but due to the use of radioactivity, the assay represents potential environmental and health risks and it is therefore relatively demanding to perform due to from NAT 2007 and 2008 Symposia: Protein N-terminal Acetylation and Protein N-terminal Acetyltransferases (NATs)
Bergen, Norway. 24–25 May 2007 and 11–13 September 2008
Published: 4 August 2009
BMC Proceedings 2009, 3(Suppl 6):S5 doi:10.1186/1753-6561-3-S6-S5
<supplement> <title> <p>Proceedings of the 2007 and 2008 Symposia on Protein N-terminal Acetylation</p> </title> <editor>Thomas Arnesen</editor> <note>Proceedings</note> <url>http://www.biomedcentral.com/content/pdf/1753-6561-3-S6-info.pdf</url> </supplement> This article is available from: http://www.biomedcentral.com/1753-6561/3/S6/S5
© 2009 Evjenth et al; licensee BioMed Central Ltd.
spectrophotometric assay that continuously measures the amount of CoASH generated by the acetyltransferase reac-tions [5]. The CoASH is determined by a coupled enzyme system using either α-ketoglutarate dehydrogenase or pyruvate dehydrogenase. The CoASH dependent oxida-tion of α-ketoglutarate or pyruvate is coupled to the reduction of NAD+ to NADH, which is determined spec-trophotometrically at 340 nm. This assay is relatively inex-pensive and can be performed with standard spectrophotometric equipment. A disadvantage of both methods is the difficulty to detect whether an oligopep-tide substrate contains more than one lysine target resi-due.
Using the production of CoA as the basis for measuring acetyltransferase activity is linked to another potentially severe cause of error. In nearly all KAT assays, measuring the Nε-acetylation of lysines, a substantial amount of acetyl CoA will spontaneously react with the ε amino group on lysine side chains, making it necessary to design proper controls to correct for this effect [4].
In addition, using the CoA-NADH coupled enzyme assay, it is not possible to use CoA as inhibitor to study acetyl-transferase catalytic mechanism and, similarly to the filter assay, when more than one lysine target is present in the oligopeptide substrate, detailed acetylation site specificity can not be studied. To determine Km and Vmax values, the initial reaction rate must be determined under condi-tions giving linear initial reaction rates over the range of substrate concentration used, normally the substrate con-version should not exceed 10 – 15% [4]. Furthermore, build-up of high concentrations of products may cause product inhibition. It is therefore of interest to obtain detailed information both on substrate consumption and product production. The radioactivity-based filter assay and the coupled-enzyme assay do not provide informa-tion on product consumpinforma-tion and detailed control exper-iments must be added. In the present article, we present a simple method for studying oligopeptide acetylation, using reverse phase HPLC detecting acetylated oligopep-tides, in addition to CoASH. This method uses semi-auto-mated HPLC-technology providing a fast, sensitive and
highly reproducible assay for protein acetyltransferases. The instrument records the UV spectrum between 200 and 300 nm, thereby enabling to monitor acetyl CoA and CoA (260 nm) and the peptide substrate and acetylated oli-gopeptides (215 nm) simultaneously. In addition, a radi-oactive flow detector may be connected to detect 14C/3 H-acetyl-oligopeptides to increase sensitivity, if required.
After the peptide separation using reverse phase HPLC, the relevant absorbance peaks are integrated and the cor-responding areas are converted to amounts of product formed. The continuous recording of the UV spectra allows for each peak to be evaluated for the maximum absorbance wavelength which can be used to determine the purity of each absorbance signal.
Since the oligopeptide separation is performed in buffers containing acetonitrile and TFA, the HPLC method is also fully compatible with subsequent analytical procedures such as mass spectrometry to determine the site of modi-fication.
Methods
Chemicals
Chemicals used in this study that are important for correct enzymatic determination are acetonitrile – ACN (Merck), trifluoracetic acid – TFA (Roche), acetyl CoA (Sigma), [1-14C] acetyl CoA (56 mCi/mmol – GE Healthcare). All
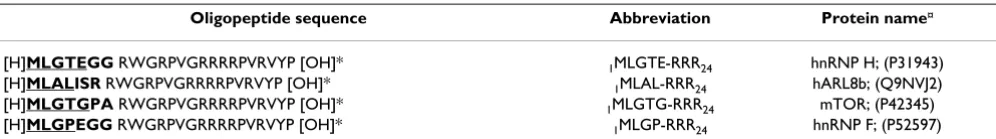
rea-gents were of analytical grade. Custom made oligopep-tides (Table 1) were purchased from BioGenes, Germany.
Cloning, expression and purification of MBP-hNaa30p
The catalytic subunit of the human NatC complex; hNaa30p (earlier known as hMak3), a NAT acetyltrans-ferase, was used to establish the reverse phase HPLC method. hNAA30 was cloned into the prokaryotic expres-sion system pETM-MBP (originally obtained from G. Stier – EMBL, Heidelberg, Germany) and expressed in E. coli. The cloning, expression and purification were performed as described [6].
Table 1: Oligopeptides used as substrates in this study
Oligopeptide sequence Abbreviation Protein name¤
[H]MLGTEGG RWGRPVGRRRRPVRVYP [OH]* 1MLGTE-RRR24 hnRNP H; (P31943)
[H]MLALISR RWGRPVGRRRRPVRVYP [OH]* 1MLAL-RRR24 hARL8b; (Q9NVJ2)
[H]MLGTGPA RWGRPVGRRRRPVRVYP [OH]* 1MLGTG-RRR24 mTOR; (P42345)
[H]MLGPEGG RWGRPVGRRRRPVRVYP [OH]* 1MLGP-RRR24 hnRNP F; (P52597)
Separation of non acetylated and acetylated oligopeptides using reverse phase HPLC
The acetylation activity was analysed by a reverse phase HPLC system, consisting of a LC-20AB solvent delivery module, an SPD-M20A photodiode array detector and a SIL-20AC autosampler (Shimadzu Prominence), and a 250 mm × 3 mm Nucleosil C18 HD column (Macherey-Nagel) reverse phase HPLC column. In addition, a radio-activity flow detector (LB 509 – Berthold) and a peristaltic pump were connected down stream of the HPLC absorb-ance detector (Figure 1). All absorbabsorb-ance signals were quantified by integrating the peak of interest using the software LCSolution Version 1.21 SP1.
Prior to sample injection, the column was equilibrated for 5 minutes (0.35 ml/min flow rate) with buffer A (5% ace-tonitrile (ACN) and 0.1% trifluoracetic acid (TFA)). After sample injection, the column was washed for 8 minutes with 2% elutionbuffer B (90% ACN, 0.1% TFA). The oli-gopeptides were then eluted employing a 40 minutes lin-ear gradient from 2% to 40% buffer B. The column was then rinsed with 95% buffer B for 5 minutes. Finally, a 2 minutes linear gradient to 2% buffer B was performed.
Determination of steady-state kinetic constants with reverse phase HPLC
80 nM of purified MBP-hNaa30p with 200 μM 1 MLGTE-RRR24 oligopeptide and 300 μM acetyl CoA in acetylation buffer (50 mM Tris-HCl (pH 8.5), 10% Glycerol, 1 mM EDTA) were incubated for 60 minutes at 37°C. Samples were collected after 0, 10, 20, 30, and 60 minutes incuba-tion and analyzed by reverse phase HPLC.
To determine the Km oligopeptides, 80 nM of purified MBP-hNaa30p was incubated with varying concentrations of oligopeptides (30 to 350 μM) and 300 μM acetyl CoA in acetylation buffer for 30 minutes at 37°C. When deter-mining the Km acetyl CoA, 300 μM of 1MLAL-RRR24 peptide was used in combination with varying ‘concentrations of
acetyl CoA (4 to 40 µM). The enzyme reactions were stopped by adding TFA to final concentrations of 1% (v/ v). The amounts of acetylated oligopeptides were deter-mined based on the absorbance at 215 nm, while the pro-duction of CoA was determined by using the absorbance at 260 nm. The steady-state enzyme kinetic parameters were calculated by nonlinear regression analysis using the SigmaPlot Technical Graphing Software (SPSS Inc.) The normality tests for all Km determinations were passed with value > 0.8.
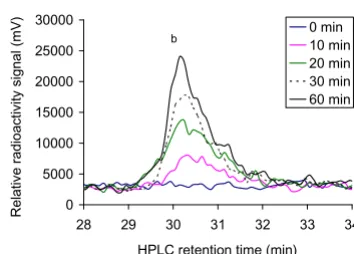
To verify the elution time for the acetylated oligopeptides, we conducted a time dependent acetylation assay by incu-bating purified MBP-hNaa30p (80 nM) with the oli-gopeptide 1MLGTE-RRR24 (200 μM) and [1-14C] acetyl CoA (final concentration 300 μM with specific activity 11.2 mCi/mmol). Samples were collected after 0, 10, 20, 30, and 60 minutes, placed on ice and adjusted to 1% TFA.
Results
The HPLC system
To establish the chromatographic procedure, first, the elu-tion times for unmodified oligopeptides were determined by injecting 3 nmol of pure oligopeptides diluted in the acetylation buffer on the HPLC system. Then we tested whether unacetylated and acetylated oligopeptides could be efficiently separated. We incubated an oligopeptide that is expected be a good hNaa30p substrate [7];
1MLGTE-RRR24 (200 μM) and 300 μM acetyl CoA with 80 nM of purified MBP-hNaa30p in the acetylation buffer. The sample was incubated at 37°C with aliquots collected after 0, 10, 20, 30, and 60 minutes (see Methods). From the elution profile at Abs 215 nm, we observed, as expected, a large amount of unmodified oligopeptide (Figure 2A, peak annotated 'a') and an additional peak with delayed elution time which increased with enzyme reaction time (Figure 2A and 2B, peak annotated 'b'). The changes in absorbance profiles recorded at 260 nm, detecting CoA and acetyl CoA in the same run, showed the same tendencies as the Abs 215 nm signals (Figure 3A and 3B). We observed a large excess of acetyl CoA (Figure 3A, peak annotated 'b') and an additional peak that increases during the course of the reaction (Figure 3A and 3B, peak annotated 'a'). The elution times of acetyl CoA and CoA were determined by injecting 3 nmol of CoA or acetyl CoA and recording the resulting absorbance profiles. This anal-ysis showed that CoA and acetyl CoA eluted after 6 min-utes and 9 minmin-utes and 30 seconds, respectively, peaks 'a' and 'b' in Figure 3A.
Analysing the sensitivity of the method
The sensitivity of the HPLC based analysis was studied by injecting different amounts of oligopeptide and recording the resulting Abs 215 nm signal. The sensitivity for acetyl Schematic presentation of the HPLC system included the
equipment needed to detect the radioactivity Figure 1
CoA was determined by injecting different amounts of acetyl CoA and recording the resulting Abs 260 nm signal. A linear correlation between the absorbance signals and the amount of substrates added was observed (Figure 4A and 4B). We noted that 0.5 nmol was the lower limit for reliable quantification of oligopeptides at 215 nm, which corresponded to 5 μM in a reaction volume of 100 μl.
To enhance the detection sensitivity and to verify that the novel delayed absorption peak represented oligopeptides with one added acetyl group, we connected a radioactive flow detector after the absorbance detector (Figure 1). This allowed us to use radioactively labelled acetyl CoA as acetyl donor. To prevent background accumulation of radioactivity in the solid scintillator detector system, 1 M NaOH was mixed to the column effluent in a 1:10 mixing ratio by connecting a peristaltic pump in-line between the absorbance detector and the radioactivity flow detector (Figure 1). High concentration of NaOH was used so that the dilution of the samples, thus dilution of the radioac-tive signals was as low as possible. Using [1-14C] acetyl
CoA as acetyl donor in the reaction, we observed a similar increase in radioactively labelled acetylated oligopeptides (Figure 5) as observed for the Abs 215 nm absorption sig-nal (Figure 2B, peak 'b'). This verifies that the peptide with delayed elution time is labelled with radioactive acetyl groups and that the quantity of the signal increased with enzyme reaction time.
Quantification of CoA has the potential of generating false kinetic data
Our results indicated that the HPLC system is a solid method to study peptide acetylation. Using the non-radi-oactive HPLC method to detect the amount of acetylated oligopeptides, we determined hNaa30p enzyme kinetic constants for some in vitro oligopeptide substrates. Differ-ent concDiffer-entrations of 1MLGTG-RRR24 peptides (30–350
μM) were used with fixed concentration of acetyl CoA
(300 μM) and 80 nM of purified MBP-hNaa30p. When
using the absorption signal at 215 nm, representing acetylated oligopeptides, we calculated the Km oligopeptide to
be 283 μM with Vmax of 3.3 pmol * min-1 * pmol
hNaa30p-1 (Table 2). In the same run, the production of CoA was recorded at 260 nm and used to calculate the cor-Reverse phase HPLC absorbance profile of the separation of CoA and acetyl CoA
Figure 3
Reverse phase HPLC absorbance profile of the sepa-ration of CoA and acetyl CoA. A; The oligopeptide
1MLGTE-RRR24 (200 μM) was incubated with acetyl CoA
(300 μM) and purified MBP-hNaa30p (80 nM) in acetylation
buffer for 60 minutes at 37°C. Samples were collected at indicated time points and analysed with reverse phase HPLC. The resulting absorbance profile at 260 nm indicates good
separation of CoA ('a') and acetyl CoA ('b'). B; An expanded
version of the absorbance profile for the formation of CoA. A time dependent increase in the absorption signal is observed.
HPLC retention time (min)
Re
HPLC retention time (min)
Rel
Reverse phase HPLC absorbance profile at 215 nm for the separation of acetylated and non-acetylated peptides Figure 2
Reverse phase HPLC absorbance profile at 215 nm for the separation of acetylated and non-acetylated peptides. A; The oligopeptide 1MLGTE-RRR24 (200 μM)
was incubated with acetyl CoA (300 μM) and purified
MBP-hNaa30p (80 nM) in acetylation buffer for 60 minutes at 37°C. Samples were collected at indicated time points and analysed with reverse phase HPLC. The resulting absorbance profile at 215 nm indicate good separation of unacetylated
('a') and acetylated oligopeptides ('b'). B; An expanded
ver-sion of the absorbance profile for the formation of acetylated oligopeptide. A clear time dependent increase in the absorp-tion signal is observed.
A HPLC retention time (min)
Relative sig
HPLC retention time (min)
responding kinetic constants. Here we observed that the Michaelis Menten plot based on CoA production gener-ated a dose dependent curve from which a significantly lower Vmax was obtained (Figure 6) compared to when Vmax was calculated based on the production of acetylated oligopeptides (Figure 7). Km oligopeptide based on
CoA production was determined to be 3.1 μM with a
Vmax of 8.7 pmol * min-1 * pmol hNaa30p-1 (Table 2). It is important to note that approximately eight pmoles CoASH (Figure 6) were produced per pmole acetylated oligopeptide (Figure 7). Since theoretically one mole CoASH should be generated per mole acetylated oli-gopeptide, a discrepancy in CoASH production relative to acetylated oligopeptide was apparent. Km for acetyl CoA
were with non linear regression determined to be approx-imately 14 μM with a Vmax of 2.1 pmol * min-1 * pmol hNaa30p-1 (Figure 8). V/K for selected substrates was cal-culated (Figure 9) and the S.D., indicated by error bars, were determined based on three independent experi-ments. The data demonstrate that substrate selectivity of the enzyme can be readily detected by the HPLC method.
Discussion and conclusion
The radioactivity-based filter assay [3] and the CoA-NADH coupled enzyme assay [5] are the most commonly applied methods to study acetyltransferase kinetics and mechanisms. Both these methods suffer from significant drawbacks such as biohazard and non-enzymatic deacetylation of acetyl CoA. To eliminate these problems and to allow us to analyse the acetylated oligopeptide products by mass spectrometry, we developed a method for studying peptide acetylation based on reverse phase
Table 2: Comparison of Km oligopeptide and Vmax based on the detection of CoA(260 nm) and the detection of acetylated oligopeptides(215
nm).
CoA Ac-1MLGTG-RRR24
Km (μM) Vmax (pmol product * min-1 * pmol hNaa30p-1) Km (μM) Vmax (pmol product * min-1 * pmol hNaa30p-1)
3.1 8.7 283.2 3.3
Standard curves of increasing amount of the substrate 1MLGP-RRR24 and acetyl CoA analysed by reverse phase HPLC
Figure 4
Standard curves of increasing amount of the sub-strate 1MLGP-RRR24 and acetyl CoA analysed by reverse phase HPLC. A; Five different amounts of the oli-gopeptide 1MLGP-RRR24, diluted in acetylation buffer, were analysed by reverse phase HPLC. The resulting absorption signals at 215 nm were quantified. Each amount were
ana-lysed three times and error bars indicate S.D. B; Five
differ-ent amounts of acetyl CoA, diluted in acetylation buffer, were analysed by reverse phase HPLC. The resulting absorp-tion signals at 260 nm were quantified. Each amount were analysed three times and error bars indicate S.D.
A
Relative abs signal (
2
6
0nm
)
2
The radioactive signal from oligopeptides being modified with radioactive acetyl CoA
Figure 5
The radioactive signal from oligopeptides being mod-ified with radioactive acetyl CoA. The oligopeptide
1MLGTE-RRR24 (200 μM) was incubated with [1-14C] acetyl
CoA (final 300 μM with specific activity 11.2 mCi/mmol) and
purified MBP-hNaa30p (80 nM) in acetylation buffer for 60 minutes at 37°C. Samples were collected at indicated time points and analysed with reverse phase HPLC that had been connected to a radioactivity flow detector after the absorb-ance detector. A clear time dependent increase in the radio-activity signal is observed, verifying that the eluted
oligopeptides are labelled with radioactive acetyl groups.
0
HPLC retention time (min)
HPLC. After acetylation, non-acetylated and acetylated oligopeptides are separated and quantified by integrating the respective elution peaks.
Since the first residues of the substrates seem to be most important for enzyme specificity [1], we designed pep-tides that deviated only within the 7 first N-terminal posi-tions. The next 17 amino acids that are indicated by 'RRR' are identical in all peptides and resemble the sequence of Adrenocorticotropic hormone (ACTH) (Amino acid no. 8 to 24), but all Lys residues were replaced with Arg to min-imize aberrant N-ε acetylation. The separation of peptides were carried out with 0.1% TFA in the HPLC buffers, mak-ing the peptide residues highly protonated. The positively charged Arg residues facilitate peptide solubility and sep-aration by reverse phase HPLC. The N-terminal acetyla-tion substitutes a positive charge by a hydrophobic group, causing the acetylated oligopeptides to be separated from the non acetylated form due to stronger interaction with the Nucleosil C18 HD matrix, resulting in increased elu-tion time. Several acetylaelu-tion assays with other Nα -acetyl-transferases acetylating oligopeptides containing more
hydrophobic residues, showed that the acetylated form of these oligopeptides also could be efficiently separated with the reverse phase Nucleosile C18HD column. This indicates that commercially available oligopeptide sub-strates, composed of the endogenous amino acids, can be used as substrates with this detection method.
The unacetylated and acetylated oligopeptide 1 MLGTE-RRR24 was separated by more than 3 minutes. Even when using high amounts of oligopeptides, >30 nmols, leading to a widening of the peaks, an efficient separation of unacetylated and acetylated oligopeptides was achieved. If necessary, the separation of oligopeptides can be further enhanced by optimising the elution profile.
The sensitivity of the detection method was determined by injecting different amount of oligopeptides and acetyl CoA and quantifying the resulting absorption profiles. This showed a clear linear trend for both substrates, span-ning from 0.5 to 5 nmol of acetyl CoA and from 1 to 10 nmol of oligopeptide. The coefficient of determination
Determination of Km and Vmax for the 1MLGTG-RRR24
oli-gopeptide, based on the generation of acetylated 1
MLGTG-RRR24 oligopeptide
Figure 7
Determination of Km and Vmax for the 1 MLGTG-RRR24 oligopeptide, based on the generation of acetylated 1MLGTG-RRR24 oligopeptide. Purified
MBP-hNaa30p (80 nM) was incubated with 300 μM acetyl CoA
and varying concentrations of 1MLGTG-RRR24 (30 – 350 μM)
in acetylation buffer for 30 minutes at 37°C. A; Non linear
regression analysis of the dose dependent curve generated based on the analysis of the acetylated oligopeptide
absorp-tion signal at 215 nm. The coefficient of determinaabsorp-tion (R2) is
given above the plot. B; Hanes-Woolf plot of the dose
dependent acetylation signal.
Determination of Km and Vmax for the 1MLGTG-RRR24
oli-gopeptide, based on the generation of CoA Figure 6
Determination of Km and Vmax for the 1 MLGTG-RRR24 oligopeptide, based on the generation of CoA.
Purified MBP-hNaa30p (80 nM) was incubated with 300 μM
acetyl CoA and varying concentrations of 1MLGTG-RRR24
(30 – 350 μM) in acetylation buffer for 30 minutes at 37°C.
A; Non linear regression analysis of the dose dependent
curve generated based on the analysis of the CoA absorption
signal at 260 nm. The coefficient of determination (R2) is
given above the plot. B; Hanes-Woolf plot of the dose
(R2) was above 0.97 for both substrates. Our experience with this acetylation assay is that even at very high amounts of oligopeptides, up to 30 nmol, the increase in absorbance at 215 nm is linear with coefficient of deter-mination above 0.97 (data not shown).
The reproducibility of the method was analysed by calcu-lating the standard deviation (S.D.) from three independ-ent experimindepend-ents. This was done for the sensitivity determination and the calculation of the kinetic con-stants. The result demonstrated that the reverse phase HPLC method is highly reproducible when analysing acetylation based on the detection of acetylated oligopep-tides with the Abs 215 nm signal.
In conclusion, we have established a robust and highly reproducible method for studying oligopeptide acetyla-tion. With new semi-automated reverse phase HPLC tech-nology, we show that both substrates, acetyl CoA and unacetylated oligopeptides, and enzyme products, CoA and acetylated oligopeptides can be detected and
quanti-fied in the same experiment. This allows for increased control over substrate conversion and product generation forming a solid basis for data intepretation. Importantly, the assay is easy to perform and automation reduces sam-ple handling.
Competing interests
The authors declare that they have no competing interests.
Authors' contributions
RHE and JRL designed the study. MZ and RHE proposed and optimized the method. RHE and KH conducted the experimental work. RHE and JRL participated in the data analysis and writing of the manuscript. All authors have read and approved the final manuscript.
Acknowledgements
We thank L. Vikebø, M. Algroy and N. Glomnes for technical assistance.
This article has been published as part of BMC Proceedings Volume 3 Sup-plement 6, 2009: Proceedings of the 2007 and 2008 Symposia on Protein N-terminal Acetylation. The full contents of the supplement are available online at http://www.biomedcentral.com/1753-6561/3?issue=S6
References
1. Polevoda B, Sherman F: N-terminal acetyltransferases and sequence requirements for N-terminal acetylation of eukaryotic proteins. J Mol Biol 2003, 325(4):595-622.
2. Marmorstein R: Biochemical and structural characterization of recombinant histone acetyltransferase proteins. Methods Enzymol 2004, 376:106-119.
3. Tanner KG, Trievel RC, Kuo MH, Howard RM, Berger SL, Allis CD, Marmorstein R, Denu JM: Catalytic mechanism and function of invariant glutamic acid 173 from the histone acetyltrans-MBP-hNaa30p specificity constants (V/K) for selected
oli-gopeptides based on detection of acetylated olioli-gopeptides(215
nm)
Figure 9
MBP-hNaa30p specificity constants (V/K) for selected oligopeptides based on detection of acetylated oli-gopeptides(215 nm). Purified MBP-hNaa30p (80 nM) was incubated with selected oligopeptides and acetyl CoA (300
μM) in acetylation buffer for 30 minutes at 37°C. The
acetylation kinetics was analysed by reverse phase HPLC. V/
K is the Vmax/Km (oligopeptides). Error bars indicate S.D.
Experi-ments are performed in triplicates.
0
1MLGTG-RRR24 1MLGTE-RRR24 1MLAL-RRR24
V/
Determination of Km and Vmax for acetyl CoA, based on
the generation of acetylated 1MLAL-RRR24 oligopeptide
Figure 8
Determination of Km and Vmax for acetyl CoA, based on the generation of acetylated 1MLAL-RRR24 oligopeptide. Purified MBP-hNaa30p (80 nM) was
incu-bated with 1MLAL-RRR24 oligopeptide at saturated levels and
varying concentrations of acetyl CoA (4 – 40 μM) in
acetyla-tion buffer for 30 minutes at 37°C. A; Non linear regression
analysis of the dose dependent curve generated based on the analysis of the acetylated oligopeptide absorption signal at
215 nm. The coefficient of determination (R2) is given above
the plot. B; Hanes-Woolf plot of the dose dependent
Publish with BioMed Central and every scientist can read your work free of charge
"BioMed Central will be the most significant development for disseminating the results of biomedical researc h in our lifetime."
Sir Paul Nurse, Cancer Research UK
Your research papers will be:
available free of charge to the entire biomedical community
peer reviewed and published immediately upon acceptance
cited in PubMed and archived on PubMed Central
yours — you keep the copyright
Submit your manuscript here:
http://www.biomedcentral.com/info/publishing_adv.asp
BioMedcentral
ferase GCN5 transcriptional coactivator. J Biol Chem 1999, 274(26):18157-18160.
4. Berndsen CE, Denu JM: Assays for mechanistic investigations of protein/histone acetyltransferases. Methods 2005, 36(4):321-331.
5. Kim Y, Tanner KG, Denu JM: A continuous, nonradioactive assay for histone acetyltransferases. Anal Biochem 2000, 280(2):308-314.
6. Arnesen T, Kong X, Evjenth R, Gromyko D, Varhaug JE, Lin Z, Sang N, Caro J, Lillehaug JR: Interaction between HIF-1 alpha (ODD) and hARD1 does not induce acetylation and destabilization of HIF-1 alpha. FEBS Lett 2005, 579(28):6428-6432.