67$5
KLJKOLJKWV
RQ
KHDY\
LRQ
SK\VLFV
6KXVX6KLDRQEHKDOIRIWKH67$5&ROODERUDWLRQ
.H\/DERUDWRU\RI4XDUNVDQG/HSWRQ3K\VLFV02(DQG,QVWLWXWHRI3DUWLFOH3K\VLFV&HQWUDO&KLQD1RU
PDO8QLYHUVLW\:XKDQ&KLQD
1XFOHDU6FLHQFH'LYLVLRQ/DZUHQFH%HUNHOH\1DWLRQDO/DERUDWRU\%HUNHOH\&$86$
Abstract.RHIC-STAR is a mid-rapidity collider experiment for studying high energy nuclear collisions. The main physics goals of STAR experiment are 1) studying the prop-erties of the strongly coupled Quark Gluon Plasma 2) explore the QCD phase diagram structure. In these proceedings, we will review the recent results of heavy ion physics at STAR.
1 Introduction
The experimental observations indicate the strongly coupled Quark Gluon Plasma (QGP) has been built up in the top energy heavy ion collsions at Relativstic Heavy Ion Collider (RHIC) [1, 2]. With large acceptance and excellent particle identifiaction capbiltiy, the STAR experiment at RHIC is one of best mid-rapidty collider experiments to study the properties of new form of matter, QGP, the initial conditions in heavy ion collisions and the stucture of the Quantum Chromodynamics (QCD) phase diagram. STAR experiment has covered the beam energies of √sNN =7.7, 11.5, 14.5, 19.6,
27, 39, 62.4 and 200 GeV. In the top energy heavy ion collisions (Au+Au at √sNN =200 GeV),
we focus on studying the nature of QGP. At the lower collision energy region, the main motivation is to explore the nuclear matter phase structure in the higher net-baryon region. The extracted baryonic chemical potental (μB) range based on a statistical model [3, 4] from the 0−5% central collisions is
20 ≤ μB ≤ 420 MeV which covers a wide region of the QCD phase diagram. In these proceedings,
we are going to highlight a few results from the recent measurements of the STAR experiment.
2 Results on azimuthal anisotropy
The azimuthal anisotropy in the momentum space of final particles relative to the reaction plane is one of the most informative ways to study the properties of matter created in high energy heavy ion collisions. The coefficientsvnfrom a Fourier-series expansion are used to characterize the event
anisotropy quantitatively, which could be represented by the equationvn =cos[n(φi−ΨRP)], where
φimeans the azimuth of theithparticle in an event,ΨRPmeans azimuth of the reaction plane and the
angle brackets mean an average over all particles in all events. v1is referred to as directed flow, and
v2as elliptic flow.
-0.04
-0.02
0
10-40% Centralitya) antiproton
10 102
y=0
/dy| 1 dv
0
0.01
b) proton10
10
20
0.01
c) net proton
Data UrQMD
(GeV)
NN
s
3
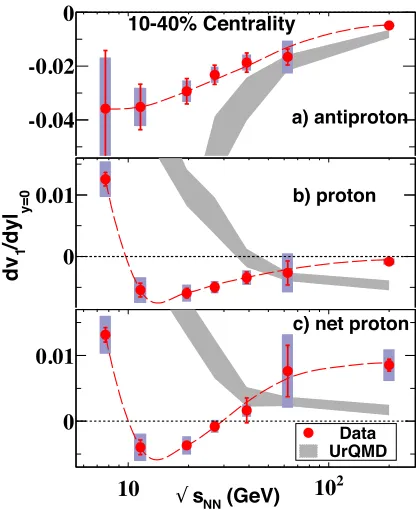
Figure 1.The beam energy dependence of directed flow slope (dv1/dy) near midrapidity for 10−40% Au+Au collisions. Panel (a), (b) and (c) report measurement for anti-protons, protons and net-protons respectively, along with UrQMD calculations. Shaded bars represent the systematic uncertainties. Dashed curves are a smooth fit to guide the eyes. The figure is taken from [6].
2.1 Directed flow
The hydrodynamic and nuclear transport models suggest thev1 as a function of rapidity (y) in the
midrapidity region offers sensitivity to expansion of the participant matter during the early stage of collisions. Further, a 3-fluid hydrodynamic calculation with a first-order phase transition between hadronic matter and a QGP predicts a minimum indv1/dyslope of net-baryon near midrapidity at
√
sNN ∼4 GeV, and this minimum has been termed the "softest point collapse" [5]. It motivates the
energy dependence of directed flow measument. Figure 1 shows the directed flow slope in 10−40% Au
+Au collisions for protons, anti-protons and net-protons. The energy dependence of protondv1/dy
involves an interplay between the directed flow of protons associated with baryon number transported from the initial beam rapidity to the vicinity of midrapidity, and the directed flow of protons from particle-antiparticle pairs produced near midrapidity. Thus, we propose the use of antiproton directed flow as a proxy for the directed flow of produced protons, and propose that the net-proton slope brings us a step closer to isolating the contributions from transported initial-state bayonic matter, as well as closer to the net-bayon hydrodynamic calculation. The detailed definition of net-proton slope could be found in [6]. In panel (c) of Figure 1 , it shows thedv1/dyslope of net-proton crosses zero between 27
and 39 GeV and remains positive up to 200 GeV, where the UrQMD model shows a monotonic trend. The observed beam energy of the minimum indv1/dyslope is higher than the energy of the minimum
in the hydrodynamic prediction. The observation of net-protondv1/dyslope is qualitatively consistent
Figure 2.The difference inv2 between particles and their corresponding antiparticles as a function of baryonic chemical
potential for 0−80% central Au+Au
collisions from experimental data and theoretical calculations.
2
v
0.018 0.022 0.026 0.03
0.034 U+U
Au+Au top 1% ZDC
Mult/<Mult>
0.9 1.0 1.1
Mult/<Mult>
0.9 1.0 1.1
top 0.1% ZDC IP-Glasma
Glauber
STAR Preliminary
Figure 3.Thev2of charged particles as a function of the normalized
multiplicity with|η|<1. The left
panel shows the results for the top 1% ZDC central events, while the right panel shows the results for the top
0.1% ZDC central events. The lines
represent Glauber and IP-Glasma simulation slopes calculated from the eccentricity. The small boxes indicate systematic uncertainties due to the
efficiency corections on thex-axis.
2.2 Elliptic flow
The most striking feature on thev2measurement is the observation of an energy dependent difference inv2between particles and their corresponding antiparticles [7]. This difference naturally breaks the number of consitutent quark scaling (NCQ) inv2which is regarded as an evidence of partonic collec-tivity in the top energy heavy ion collisions at RHIC. It indicates the hadronic degrees of freedom play a more important role at lower collision energies. Figure 2 shows the difference inv2between parti-cles and their corresponding antipartiparti-cles as a function of baryonic chemical potential. Our data are compared to hydrodynamics+transport (UrQMD) hybrid model [8] and Nambu-Jona-Lasino (NJL) model [9] which considers both partonic and hadronic potential. The hydrid model could reproduce the baryon (proton) data, but fails to explain the mesons; whereas the NJL model could qualitatively reproduce the hadron splitting. By tuning theRvparameter which is related to the partonic potential, NJL model fails to reproduce the magnitude for all hadron species simultaneously.
0.4 0.6 0.8 1
[
[
[
[
[
[
[
[
[
[
[
[ [ [
Net-proton
κσ
2
(a) STAR net-proton data
70 - 80% 0 - 5%
(|y|<0.5; 0.4<pT<0.8(GeV/c))
UrQMD (0 - 5%) Poisson
BESII error
-10 0 10
[
[
[
[ [ [
[
[ [ [
[
[ [[
Net-charge
κσ
2
10 20 50
5 100 200
Colliding Energy
√
s
NN(GeV)
(b) STAR net-charge data70 - 80% 0 - 5%
(|η|<0.5; 0.2<pT<2.0(GeV/c)) NBD (0 - 5%) Poisson Au + Au Collisions at RHIC
Figure 4.Net-proton (top panel) [12] and net-charge (bottom panel) [13] higher momentsκσ2as a function of beam energy from Au+Au collisions at RHIC. The red solid circles correspond to 0−5% central collisions and the open squares represent 70−80% peripheral collisions. The vertical error bars are statistical and the caps represent systematic uncertainties. The yellow solid line in the top panel represents 0−5% central Au+Au collision results from UrQMD simulations and the yellow solid line in the bottom panel is the result of negative binomial statistics. The dashed lines in both panels represent the Poisson statistics. The green box in the top panel indicates the estimated statistical errors for net-protons from the RHIC BESII program.
the 1% most central events based on the smallest signal seen in the Zero Degree Calorimeter (ZDCs). Both ZDCs are used in the centrality determination. Both Au+Au and U+U show a strong neg-ative slope, which indicates the effect of the impact parameter is still prominent. The right panel of Fig. 3 shows the same approach for the 0.1% most central events based on the ZDCs. The negative slope for Au+Au collision is smaller in magnitude, indicating the effects from non-central collisions are reduced and the variation in multiplicity is mainly driven by fluctuations. For U+U collisions, however, the slope becomes more negative as the centrality selection is tightened. This demonstrates that the variation of multiplicity in the 0.1% U+U collisions is dominated by the different geometries made possible by the prolate shape of the Uranium nucleus. We also compare the data to expectation from Glauber model and IP-Glasma calculations. It is clear that the IP-Glasma calculation based on gluon saturation describes the data better.
3 Results on higher moments
(GeV)
NN
s
10 102 103
4
10
×
)
OS
- H
SS
(H
0 0.5
10 - 30%
= 1
κ
= 1.5
κ
= 2
κ
BES II error projection
Au+Au
Pb+Pb
function of collision energy in10−30% Au+Au collisions. The default values (dotted curve) are from
Hκ=1, and the solid (dash-dot) curve are obtained withκ=1.5 (κ=2). For comparison, the results for Pb+Pb collisions at√sNN=2.76 TeV are also shown [16]. The vertical asymmetric bands represent the systematic errors and the band around zero indicates the statistical errors from the proposed RHIC BESII program.
point at STAR. Figure 4 shows the kurtosis times variance (κσ2) for net-proton (top panel) [12] and net-charge (bottom panel) [13] distributions at mid-rapidity in Au+Au collisions as a function of colliding energy for 0−5% and 70−80% collision centralities. The net-protonκσ2values for the 0-5% centrality selection at √sNN=19.6 and 27 GeV show a relatively larger deviation from Poisson
and hadron resonance gas expectation values (which would correspond to uncorrelated emission and are close to unity) and theκσ2 values from 70-80% peripheral collisions. The peripheral collisions
are expected to create small systems and do not show significant bulk properties. The calculations of UrQMD which is a pure hadronic model that does not consider a phase transition show a monotonic behavior. Our data at lower energies are with large uncertainties, but a possible non-monotonic vari-ation of theκσ2of the net-proton distribution is not excluded. High statistical dataset for Au+Au
collisions<20 GeV from the future second phase of the beam energy scan (BESII) will help answer the question. In the top panel, the hatched band shows the projection of the statistical errors from BESII.
4 Results on Chiral Magnetic Effect
The RHIC provides a good opportunity to study the parity-odd domains where the local imbalance of chirality results from the interplay of these topological configurations with the QGP. In heavy ion collisions, energetic spectator protons produce a magnetic field. This strong magnetic field coupled with the chirality asymmetry in the parity-odd domains, induces a separation of electric charge along the direction of the magnetic field. STAR has proposed a three particle correlator method to study the Chiral Magnetic Effect (CME) [14]. Figure 5 shows the collision energy dependence of the charge separation after subtraction of the background related to collective flow [15]. The results approach to zero when the beam energy is below 11 GeV. In order to draw a clear conclusion, more statistics are needed for the lower beam energies (<20 GeV). The colored band around zero shows the estimated statistical errors for the results from RHIC BESII program.
5 Results on heavy flavor production
〉
part N
〈
0 100 200 300 400
)
AA
Nuclear Modification Factor (R
0 0.5 1 1.5 2 p+p norm. <5 GeV/c T
: |y|<1, 3<p
0
U+U 193 GeV D
<8 GeV/c, arXiv:1404.6185 (submitted to PRL)
T
: |y|<1, 3<p
0
Au+Au 200 GeV D
>6 GeV/c, PLB655, 104 (2007) T
: |y|<0.5, p
±
π Au+Au 200 GeV
STAR Preliminary
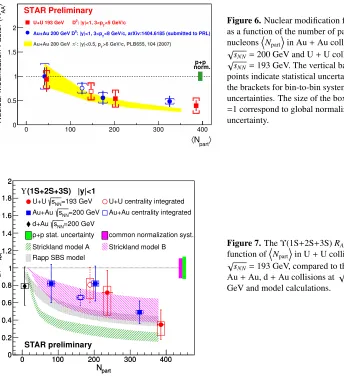
Figure 6.Nuclear modification factor (RAA) as a function of the number of participant nucleonsNpart
in Au+Au collisions at
√
sNN=200 GeV and U+U collisions at
√
sNN=193 GeV. The vertical bars on data points indicate statistical uncertainties, while the brackets for bin-to-bin systematic uncertainties. The size of the box aroundRAA =1 correspond to global normalization uncertainty.
part
N
0 100 200 300 400
AA , R dA R 0 0.2 0.4 0.6 0.8 1 1.2 1.4 1.6 1.8 2 part N
0 100 200 300 400
AA , R dA R 0 0.2 0.4 0.6 0.8 1 1.2 1.4 1.6 1.8 2 =193 GeV NN s
U+U U+U centrality integrated
=200 GeV NN s
Au+Au Au+Au centrality integrated
=200 GeV NN s d+Au
p+p stat. uncertainty common normalization syst.
Strickland model A Strickland model B
Rapp SBS model
STAR preliminary (1S+2S+3S) |y|<1
Υ
Figure 7.TheΥ(1S+2S+3S)RAAas a function ofNpart
in U+U collisions at
√
sNN=193 GeV, compared to the results in Au+Au, d+Au collisions at √sNN=200 GeV and model calculations.
heavy flavor production is a useful tool to study the medium properties of the early stages of the system when QGP is expected to exist.
Figure 6 shows the nuclear modifcation factorRAAofD0as a function of the number of participant
nucleonsNpart
. We observe the suppression ofD0meson production at largep
Tin Au+Au and U+
U collisions follows a global trend as a function ofNpart
. Compared to the light flavor hadrons (π±),
D0mesons suffer similar amount of energy loss. It is consistent with physics picture of a substantial
amount of charm-medium interactions. Figure 7 shows theRAA of Υ(1S+2S+3S) as a function of
Npart
in U+U collisions at √sNN=193 GeV and Au+Au,d+Au collisions at √sNN=200 GeV.
10-6
10-4
10-2
100
102
0 0.5 1 1.5 2 2.5 3
1/N
mb
evt
dN
ee
acc.
/dM
ee
[ (GeV/c
2) -1 ]
dielectron invariant mass, Mee (GeV/c2)
200 GeV: PRL 113 022301 BES: STAR Preliminary
η→ eeγ
c-c → D/Λ→ e+e
-η’ → e+e-γ ω→ e+e-(π)
Cocktail w/o ρ
QGP in-Medium Cocktail + Model
27 GeV × 0.03
39 GeV × 2
62.4 GeV × 25
200 GeV × 200
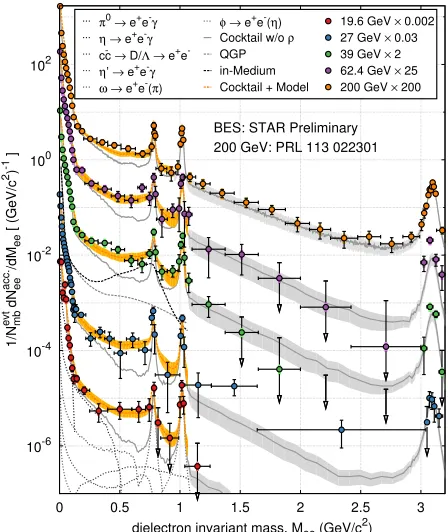
Figure 8.The di-electron invariant mass distributions as a function of beam energy in minimun-bias Au+Au collisions at √sNN= 19.6, 27, 39, 62.4 and 200 GeV, from bottom to top, respectively. The yellow bands in the low mass region represent the results from hadronic cocktails+in-medium model calculations. The gray bands are the systematic uncertainties.
6 Results on di-electron production
Di-electrons are produced throughout the whole evolution in a heavy ion collision and have negligible final state interactions with created nuclear matter. Hence, di-electrons can be considered as unique probes to study the hot and dense matter. Potentially, the di-electron could provide information of chiral dynamics in the low mass regionMll<1 GeV/c2and QGP direct radiation in the intermediate
mass region 1<Mll<3 GeV/c2. Figure 8 shows the efficiency-corrected di-electron invariant mass
distribution from minimum-bias Au+Au collisions at √sNN=19.6, 17, 39, 62.4 and 200 GeV. The
200 GeV results are from [21]. The results of hadronic cocktails+in-medium model calculations are shown by the yellow bands [22]. The comparison of model calculations to the invariant mass dependence of di-electron low mass range yields supports the conclusion that, within experimental uncertainties, in-medium modifications of theρspectral function consistently describe the low mass region enhancement from 19.6 GeV to 200 GeV.
7 Summary and outlook
Both Heavy Flavor Tracker (HFT) and Muon Telescope Detector (MTD) were fully installed for run14 at RHIC in year 2014. The new dataset will allow us to make precise measurement on heavy quark hadron and heavy quarkonium production. With electron cooling plus longer beam bunches for BESII, the luminosity will be improved by a factor of 4−15 compared with BESI. In addition, two related detector upgrades, the Event Plane Detector (EPD) and the inner Time Projection Chamber (iTPC) will improve the capability of STAR experiment. BESII program will offer us the unique opportunity to map the predicted QCD critial point and phase boundary in the phase diagram.
Acknowledgements:This work was supported in part by the National Natural Science Founda-tion of China under grant No.11475070.
References
[1] J. Adams,et al., [STAR Collaboration], Nucl. Phys.A757, 102(2005). [2] K. Adcox,et al., [PHENIX Collaboration], Nucl. Phys.A757, 184(2005). [3] A. Andronic,et al., Nucl. Phys.A834, 237(2010).
[4] A. Andronic, P. Braun-Munzinger and J. Stachel, Nucl. Phys.A772, 167(2006). [5] H. Stocker, Nucl. Phys.A750, 121(2005).
[6] L. Adamczyk,et al., [STAR Collaboration], Phys. Rev. Lett.112, 162301(2014). [7] L. Adamczyk,et al., [STAR Collaboration], Phys. Rev. Lett.110, 142301(2013). [8] J. Steinheimer, V. Koch, and M. Bleicher, Phys. Rev.C86, 044902(2013). [9] J. Xu,et al., Phys. Rev. Lett.112, 012301(2014).
[10] M. A. Stephanov, Phys. Rev. Lett.102, 032301(2009); Phys. Rev. Lett.107, 052301(2011). [11] M. Asakawa, S. Ejiri and M. Kitazawa, Phys. Rev. Lett.103, 262301(2009).
[12] L. Adamczyk,et al., [STAR Collaboration], Phys. Rev. Lett.112, 032302(2014). [13] L. Adamczyk,et al., [STAR Collaboration], Phys. Rev. Lett.113, 092301(2014).
[14] B.I. Abelev,et. al.[STAR Collaboration], Phys. Rev. Lett.103, 251601(2009); Phys. Rev.C81, 054908(2010).
[15] L. Adamczyk,et al., [STAR Collaboration], Phys. Rev. Lett.113, 052302(2014). [16] B.I. Abelev,et. al.[ALICE Collaboration], Phys. Rev. Lett.110, 012301(2013). [17] Z. Lin and M. Gyulassy, Phys. Rev.C51, 2177(1995).
[18] M. Cacciari, P. Nason and R. Vogt, Phys. Rev. Lett.95, 122001(2005). [19] M. Strickland and D. Bazow, Nucl. Phys.A879, 25(2012).
[20] A. Emerick, X. Zhao and R. Rapp, Eur. Phys. J.A48, 72(2012).
[21] L. Adamczyk,et al., [STAR Collaboration], Phys. Rev. Lett.113, 022301(2014).

![Figure 4. Net-proton (top panel) [12] andAusimulations and the yellow solid line in thebottom panel is the result of negativebinomial statistics](https://thumb-us.123doks.com/thumbv2/123dok_us/8173685.1364964/4.482.42.263.96.366/figure-proton-andausimulations-yellow-thebottom-result-negativebinomial-statistics.webp)
![Figure 5. √also shown [16]. The verticalasymmetric bands represent thesystematic errors and the band aroundzero indicates the statistical errorsfrom the proposed RHIC BESII Au collisions](https://thumb-us.123doks.com/thumbv2/123dok_us/8173685.1364964/5.482.41.304.69.235/verticalasymmetric-represent-thesystematic-aroundzero-indicates-statistical-errorsfrom-collisions.webp)