ISSN (Print) : 2320 – 3765 ISSN (Online): 2278 – 8875
I
nternational
J
ournal of
A
dvanced
R
esearch in
E
lectrical,
E
lectronics and
I
nstrumentation
E
ngineering
(A High Impact Factor, Monthly, Peer Reviewed Journal)
Website: www.ijareeie.com
Vol. 7, Issue 4, April 2018
The Performance of PV System to Get
Maximum Energy under Different
Environmental Condition
Jyoti Gupta
1, Viswanath Prasad Kurmi
2,
Ritwik Tripathi
3M.Tech Scholar, Dr. C V Raman Institute of Science and Technology, Chhattisgarh, India1
Asst. Professor, Department of EE, Dr. C V Raman Institute of Science and Technology, Chhattisgarh, India 2 Asst. Professor, Department of EE, Dr. C V Raman Institute of Science and Technology, Chhattisgarh, India 3
ABSTRACT: A Simulink model is design in matlab to study the performance of PV system under different environmental characteristics (temperature and irradiance) and cell parameters (parasitic resistance and ideality factor).The photovoltaic panel in which different input are given with different conditions. The output is used to study the performance of PV system to get maximum energy.
KEYWORDS: Photovoltaic, Matlab/Simulink, Environmental Conditions
I. INTRODUCTION
Renewable energy resources have become a hot topic for the past two decades. Many research institutions have dedicated their time to harness the optimum power from it [1]. In case of PV plant, the optimum efficiency is affected mainly by three factors: the efficiency of the PV panel (in commercial PV panels it is between 8-15 %[2]), the efficiency of the inverter (95-98%[3]) and the efficiency of the maximum power point tracking (MPPT) algorithm (which is over 98%[4]).Improving the efficiency of panels and inverter is not easy as it depends on the technology availability and expenses, however improving the MPPT algorithm is an inexpensive way. This paper allows a researcher to develop a better MPPT algorithm by understanding the PV panel behavior under different conditions (environmental as well as the cell parameters).
II. THE PHYSICS OF PHOTOVOLTAIC CELL
A simple solar cell consist of solid state p-n junction fabricated from a semiconductor material (usually silicon).In dark, the IV characteristic of a solar cell has an exponential characteristic similar to that of a diode[5]. However when the solar energy (photons) hits on the solar cell, energy greater than the band gap energy of the semiconductor, and release electrons from the atoms in the semiconductor material, creating electron-hole pairs [6].The charged carrier are moved apart under the influence of internal electric fields of the p-n junction and hence a current proportional to the incident photon radiation is developed. This phenomenon is called photovoltaic effect, first observed by A.E Becquerel in 1839[7].When the cell is short circuited, this current flows in the external circuit but when open circuited, this current is shunted internally by the intrinsic p-n junction diode. In this paper, a variable load is connected in the external short circuit. The complete model is available in [8].
A. A PV cell model
ISSN (Print) : 2320 – 3765 ISSN (Online): 2278 – 8875
I
nternational
J
ournal of
A
dvanced
R
esearch in
E
lectrical,
E
lectronics and
I
nstrumentation
E
ngineering
(A High Impact Factor, Monthly, Peer Reviewed Journal)
Website: www.ijareeie.com
Vol. 7, Issue 4, April 2018
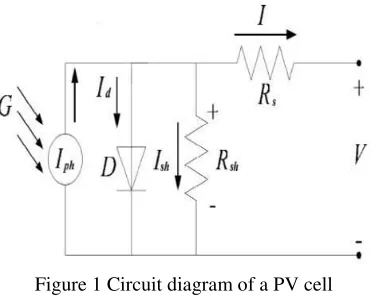
However, if it is allowed to connect to an external source (large voltage) it generates a current Id, called diode (D) current or dark current. The diode determines the IV characteristics of the cell.
Figure 1 Circuit diagram of a PV cell
The circuit diagram of a PV cell is shown above in Fig 1.Accurate simulation is obtained after considering the following parameters:
Temperature dependence of the diode reserved saturation current Is.
Temperature dependence of the photo current Iph.
Series resistance Rs [9] (internal losses due to the current flow) which gives a more accurate shape between the maximum power point and the open circuit voltage.
ISSN (Print) : 2320 – 3765 ISSN (Online): 2278 – 8875
I
nternational
J
ournal of
A
dvanced
R
esearch in
E
lectrical,
E
lectronics and
I
nstrumentation
E
ngineering
(A High Impact Factor, Monthly, Peer Reviewed Journal)
Website: www.ijareeie.com
Vol. 7, Issue 4, April 2018
Used V. Nomenclature from page-6 for the (1)-(8) equations variables.
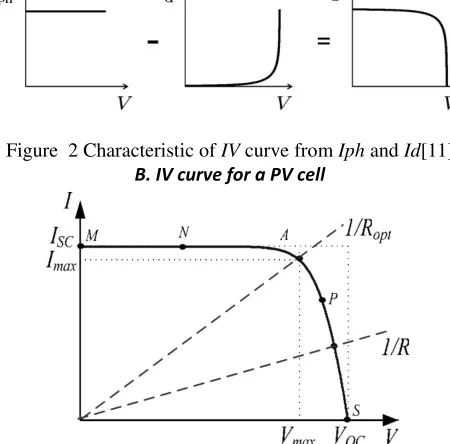
Fig 2 shows the characteristic of IV curve. The net current I is obtained from the photo current Iph and the diode current Id [11].
Figure 2 Characteristic of IV curve from Iph and Id[11] B. IV curve for a PV cell
A general I-V characteristic of the solar cell for a given ambient irradiation ‘G’ and fixed cell temperature ‘T’ is shown in Fig 3.For a certain resistive load, the load characteristic is a straight line with slope . Power delivered to the load depends on the value of the resistance only. In some cases if the R oad is very small; the PV cell operates in the M-N
region of the IV curve (Fig3), the PV cell act as a constant current source, which is almost equivalent to a short circuit current.
However, if the R load is large, the PV cell operates in the P-S region of the IV curve, the PV cell act as a constant voltage source almost equivalent to the open circuit voltage [9].A PV cell is characterized by the following fundamental parameters w.r.t Fig3
1. Short circuit current: = (Greatest value of the current generated by a PV cell, which is produced by the short circuit condition: V=0.
2. Open circuit voltage is a voltage drop across the diode D when the generated current I=0.It presumes the voltage of the PV cell in the night and it is expressed by (2).
3. Maximum power point is the operating point in Fig 3,where the power dissipated in the resistive load is maximum:
4. Maximum efficiency is the ratio of the maximum power and the incident solar energy (photons). where is the ambient irradiation and A is the PV cell area.
5. Fill factor (FF) is the ratio of the maximum power that can be delivered to the load and the theoretical maximum power which is the product of and .FF is a measure of real I-V characteristic which value much be higher than 0.7 for a good PV cell.
However FF decreases as the cell temperature increases. The open circuit voltage increases logarithmically with the ambient irradiation where as the short circuit current is a linear function of the ambient irradiation. The prominent effect with increasing the PV cell’s temperature is the linear decrease of the open circuit voltage, hence making the PV cell less efficient. The short circuit current slightly increases with the cell temperature.
C. Consideration of environmental parameters and cell parameters in PV cell model
ISSN (Print) : 2320 – 3765 ISSN (Online): 2278 – 8875
I
nternational
J
ournal of
A
dvanced
R
esearch in
E
lectrical,
E
lectronics and
I
nstrumentation
E
ngineering
(A High Impact Factor, Monthly, Peer Reviewed Journal)
Website: www.ijareeie.com
Vol. 7, Issue 4, April 2018
is a function of the ambient irradiation G (W/ ) and from equation (2) cell temperature (K) is linear decrease of the . At STC (Standard Test Condition, G= 1 kW/m at spectral distribution of AM =1.5; = 25ºC) = from (7) which is the greatest current, since = 25ºC for all test conditions. From (7) as G increases the increases but from (2) as the increases the decreases. Influence of , which is the change in panel per ºC at temperatures other than 25°C, in (7) is greater when changes from (=25°C).
ii. Cell parameters (parasitic resistance and ideality factor): Resistive effects in solar cells reduce the efficiency of the solar cell by dissipating power in the resistances. The most common parasitic resistances are series resistance and shunt resistance whose key impact is to reduce the fill factor. Both the magnitude and impact of series and shunt resistance depends on the geometry of the solar cell, at the operating point of the solar cell. It is measured in Ω .For an ideal condition (ideal diode characteristic), and [10].Series resistance in a solar cell has three causes: the movement of current through the emitter and base of the solar cell; the contact resistance between the metal contact and the silicon; and the resistance of the top and rear metal contacts. A straight forward method of estimating the series resistance from a solar cell is to find the slope of the IV curve at the point [12]. Significant power losses caused by the presence of a shunt resistance are typically due to manufacturing defects, rather than poor solar cell design. An estimate for the value of the of a solar cell can be determined from the slope of the IV curve near the point [12]. The ideality factor n of a diode is a measure of how closely the diode follows the ideal diode equation. The ideal diode equation assumes that all the recombination occurs via band to band or recombination via traps in the bulk areas from the device (i.e. not in the junction).However recombination does occur in other ways and in other areas of the device. This recombination’s produce ideality factors n that deviate from the ideal [12]
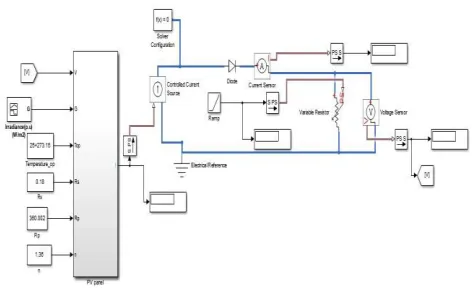
D. A PV cell simulation set up
Considering the environmental and cell parameters, a PV cell simulation set up model based on equations (1)-(8) and Tables. (1, 2) is developed in MATLAB/SIMLINK with a variable load resistance at the output.Fig:4 depicts the PV cell simulation set up in general.
ISSN (Print) : 2320 – 3765 ISSN (Online): 2278 – 8875
I
nternational
J
ournal of
A
dvanced
R
esearch in
E
lectrical,
E
lectronics and
I
nstrumentation
E
ngineering
(A High Impact Factor, Monthly, Peer Reviewed Journal)
Website: www.ijareeie.com
Vol. 7, Issue 4, April 2018
III. METHODOLOGY
Figure 5Block Diagram of PV Panel Model
IV. SIMULINK/MATLAB MODEL OF PHOTOVOLTAIC
Figure 6 Simulink/Matlab model of PV Photovoltaic
MATLAB SIMULINK MODEL CHARACTERISTICS OF A PV MODULE
ISSN (Print) : 2320 – 3765 ISSN (Online): 2278 – 8875
I
nternational
J
ournal of
A
dvanced
R
esearch in
E
lectrical,
E
lectronics and
I
nstrumentation
E
ngineering
(A High Impact Factor, Monthly, Peer Reviewed Journal)
Website: www.ijareeie.com
Vol. 7, Issue 4, April 2018
circuit current (Isc), and Maximum Power Point (Vmp, Imp), given by the manufacturer of the PV module, are used for the
prediction of the PV characteristics of solar PV module. The Typical P-V and I–V characteristics of a PV cell are shown in Figure 1. There is a unique
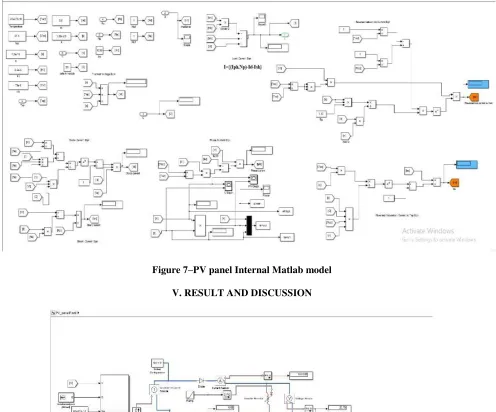
PV Panel Internal Diagram
Figure 7–PV panel Internal Matlab model
V. RESULT AND DISCUSSION
ISSN (Print) : 2320 – 3765 ISSN (Online): 2278 – 8875
I
nternational
J
ournal of
A
dvanced
R
esearch in
E
lectrical,
E
lectronics and
I
nstrumentation
E
ngineering
(A High Impact Factor, Monthly, Peer Reviewed Journal)
Website: www.ijareeie.com
Vol. 7, Issue 4, April 2018
VI. CONCLUSION AND FUTURE SCOPE
Considering the environmental and cell parameters, a PV cell simulation set up model based on PV cell equations is developed in MATLAB/SIMLINK with a variable load resistance at the output.From the simulation results which are depicted in figures (5)-(9), the variables , , , and n which affects the performance of a PV panel is studied thoroughly. In addition to it, these results could be used to develop the MPPT algorithm by understanding how these variables work. The ideal condition for obtaining the maximum power from the PV panel are =25ºC, A.M=1.5, =0.18 ohm, and
n=1.36 which is shown in Fig: 5 with legend G=1000 W/ (blue color). This ideal condition is also specified in the Solarex MSX-60 datasheet [14].Every manufacture intends to produce their PV panel in the ideal condition as mentioned above. Hence this paper is a summary for understanding the behavior of PV panel with change of the said variables and also in estimating the IV curves under such changes
REFERENCES
[1] Nurul Afiqah Zainal1, Ajisman2 And Ahmad Razlan Yusoff3 Faculty Of Manufacturing Engineering, Universiti Malaysia Pahang, 26600 Pekan, Pahang, Malaysia “Modelling of Photovoltaic Module Using Matlab Simulin” 2016
[2]Xuan Hieu Nguyen1* And Minh Phuong Nguyen2 “Mathematical Modeling of PhotovoltaicCell/Module/Arrays With Tags In Matlab/Simulink” Nguyen And Nguyen Environ Syst Res (2015)
[3] Habbati Bellia A,*, Ramdani Youcef B, Moulay Fatima “A Detailed Modeling of Photovoltaic Module Using Matlab A Detailed Modeling Of Photovoltaic Module Using Matlab”2014
[4]R. Ayaz, I. Nakir, and M. Tanriove Department of Electrical Engineering, Yildiz Technical University, Davutpasa Campus, 34220 Istanbul, Turkey “An Improved Matlab-Simulink Model of PV Module considering Ambient Conditions” 2014
[5]Keshavani Kamal, Joshi Jigar, Trivedi Vishrut, Mitesh Bhavsar “Modelling and Simulation of Photovoltaic Array Using Matlab/Simulink”2014 [6]Shivananda PukhremDublin Institute of Technology “A photovoltaic panel model n MATLAB/SIMULINK” 2013
[7]Aarti Kane ; Vishal VermaPower, Energy and Control (ICPEC), International Conference on“Characterization of PV cell-environmental factors consideration” 2013
[8] Krismadinataa*, Nasrudin Abd. Rahima Hew Wooi Pinga, Jeyraj Selvaraja a University of Malaya Power Energy Dedicated Advanced Centre (UMPEDAC) Level 4 Wisma R&D University of Malaya Kuala Lumpur 59990 Malaysia 2012
[9]Sabir RUSTEMLI, Furkan DINCER, M. Nuri ALMALI “Research on effects of environmental factors on photovoltaic panels and modeling with Matlab/Simulink University”, Department of Electrical and Electronics Engineering, Turkey 2012
[10]J.A. Ramos-Hernanz 1 J.J. Campayo 1 J. Larranaga 2 E. Zulueta 3 O. Barambones 3 J. Motrico 1 U. Fernandez Gamiz 4 I. Zamora 1. Department of Electrical