Scholarship@Western
Scholarship@Western
Electronic Thesis and Dissertation Repository
August 2015
Morphology and Morphometry of Double Layered Ejecta Craters
Morphology and Morphometry of Double Layered Ejecta Craters
on Mars
on Mars
Ryan Schwegman
The University of Western Ontario
Supervisor
Dr. Gordon Osinski
The University of Western Ontario Joint Supervisor Dr. Livio Tornabene
The University of Western Ontario Graduate Program in Geology
A thesis submitted in partial fulfillment of the requirements for the degree in Master of Science © Ryan Schwegman 2015
Follow this and additional works at: https://ir.lib.uwo.ca/etd
Part of the Geology Commons
Recommended Citation Recommended Citation
Schwegman, Ryan, "Morphology and Morphometry of Double Layered Ejecta Craters on Mars" (2015). Electronic Thesis and Dissertation Repository. 3074.
https://ir.lib.uwo.ca/etd/3074
This Dissertation/Thesis is brought to you for free and open access by Scholarship@Western. It has been accepted for inclusion in Electronic Thesis and Dissertation Repository by an authorized administrator of
(Thesis format: Integrated Article)
by
Ryan Schwegman
Graduate Program in Geology: Planetary Science
A thesis submitted in partial fulfillment of the requirements for the degree of
Master of Science
The School of Graduate and Postdoctoral Studies The University of Western Ontario
London, Ontario, Canada
ii
Abstract
Double layered ejecta (DLE) craters display two distinct layers of ejecta that appear to have been emplaced as a mobile, ground-hugging flow. While volatile content within the target, atmosphere, or some combination of the two is generally considered a major variable enhancing the mobility of ejecta, the presence of unconsolidated surface materials may also have some effect. This statement is studied further here, aiming to determine whether bulk target lithology and/or attributes of the surface have any effect on morphometric properties between DLEs situated on sedimentary targets to those on volcanic ones. Results suggest that ejecta mobility (the distance ejecta travels from the crater rim) generally increases with increasing latitude and may reflect volatile concentrations on Mars, while lobateness (sinuosity of the perimeter of ejecta) generally decreases with increasing latitude. Furthermore, DLEs on sedimentary targets appear to have a higher EM, on average, than those on volcanic targets.
Keywords
iii
Co-Authorship Statement
iv
Acknowledgments
I cannot thank anyone else before I thank Oz and Livio who have both been incredibly helpful and supportive throughout this whole process and I could not have asked for better supervisors. Also to Eriita who introduced me to Martian layered ejecta and helped me get started on this project.
Thank you to Bianca and Patrick for all their help with ArcGIS, my fellow American Zach, my office buddies Kathy, Becca, Roshni, Laura, Alex, and (British) Jon, and to (Canadian) Ryan. You all have been really awesome friends and I couldn’t imagine what these past two years would have been like without you. Thanks also to Eric, Hun, Kayle, Tanya, Mary, and the rest of the former and current Ozlings who have helped me along the way.
I would also like to thank Mary Bourke as if it weren’t for her introducing me to Oz, I would have never gotten this incredible opportunity to study in Canada. Thank you also to Jeffrey Byrnes and all the other undergraduate instructors at Oklahoma State University that provided me an education in geological sciences. I would most definitely not be where I am without their expertise.
I cannot forget my family for their unending support; Mom, Dad, Melissa, Debbie, Nick, and Bob, none of this would have been possible without you.
Thank you to my examiners Catherine Neish, Richard Grieve, and Ken McIsaac for their helpful and constructive comments.
v
Table of Contents
Abstract ... ii
Co-Authorship Statement... iii
Acknowledgments... iv
Table of Contents ... v
List of Tables ... viii
List of Figures ... ix
List of Appendices ... xvii
Chapter 1 ... 1
1 Introduction ... 1
1.1 Mars ... 2
1.2 Global Structure ... 4
1.3 Geologic History ... 6
1.3.1 Noachian Period ... 7
1.3.2 Hesperian Period ... 8
1.3.3 Amazonian Period ... 8
1.4 Cratering Rates and the Cratering Record on Mars ... 9
1.5 The Impact Cratering Process ... 10
1.5.1 Contact and Compression ... 11
1.5.2 Excavation... 12
1.5.3 Modification ... 13
1.6 Ejecta Morphologies on Mars ... 15
1.6.1 Radial Ejecta ... 15
1.6.2 Layered Ejecta Morphologies ... 17
vi
1.7.2 Mouginis-Mark (1981) and Boyce and Mouginis-Mark (2006) Model ... 24
1.7.3 Komatsu et al. (2007) Model ... 26
1.7.4 Osinski et al. (2011) Model ... 28
1.7.5 Weiss and Head (2013) Glacial Substrate Model ... 30
1.7.6 Wulf and Kenkmann (2015) Model ... 31
1.8 References ... 32
Chapter 2 ... 43
2 A Comparative Morphologic and Morphometric Study of Double Layered Ejecta Craters in Volcanic Terrains on Mars ... 43
2.1 Introduction ... 43
2.2 Methodology ... 46
2.2.1 Study Areas ... 48
2.3 Results ... 52
2.3.1 Ejecta Mobility (EM) ... 52
2.3.2 Lobateness (Γ) ... 57
2.3.3 Other Morphologic and Morphometric Attributes ... 61
2.4 Discussion ... 69
2.4.1 Effect of the Target Properties on Ejecta Mobility ... 69
2.4.2 Effect of the Target Properties on Lobateness ... 72
2.4.3 Radial Grooves... 74
2.4.4 Hesperia Planum – An Outlier? ... 78
2.5 Concluding Remarks ... 78
2.6 References ... 80
Chapter 3 ... 93
vii
3.2 Methodology ... 95
3.3 Results ... 99
3.3.1 Ejecta Mobility (EM) ... 99
3.3.2 Lobateness (Γ) ... 104
3.3.3 Morphology... 107
3.4 Discussion ... 110
3.4.1 Effect of Target/Surface Properties on Ejecta Mobility and Lobateness 110 3.4.2 Ejecta Emplacement Chronology ... 116
3.5 Summary ... 117
3.6 References ... 118
Chapter 4 ... 129
4 Conclusions ... 129
4.1 Future Work ... 131
4.2 References ... 133
Appendices ... 134
viii
List of Tables
Table 1.1: Fact sheet of Earth and Mars. ... 4
Table 2.1: Study regions showing the number of DLEs corresponding to each geologic unit (See Scott and Tanaka, 1986 and Greeley and Guest, 1987 for full unit descriptions). The first letter of each unit represents each geologic period: A = Amazonian; H = Hesperian; N = Noachian. ... 51
Table 2.2: Average ejecta mobility (EM) and lobateness (Γ) for outer and inner layers of DLEs. ... 57
Table 2.3: Dust cover index (DCI) for each region. ... 75
Table 2.4: Average DCI for DLEs with grooves and without. ... 75
Table 3.1: Number of volcanic and non-volcanic DLEs within each region. ... 96
Table 3.2: Study regions showing the number of DLEs corresponding to each geologic with regional interpretation (see Scott and Tanaka, 1986 and Greeley and Guest, 1987 for full unit descriptions). ... 97
Table 3.3: Number of DLEs within each latitude bin. ... 100
Table 3.4: Number of DLEs within each crater diameter bin. ... 100
Table 3.5: Number of DLEs with or without radial grooves. ... 107
Table A.0.1 - Volcanic DLEs ... 134
ix
List of Figures
Figure 1.1: A comparison of Earth and Mars. Image of Earth (Jan. 4, 2012) and Mars (April 1999) taken from the VIIRS instrument onboard Suomi NPP (NASA/NOAA/GSFC/Suomi NPP/VIIRS/Norman Kuring) and Mars Orbiter Camera (MOC) onboard Mars Global
Surveyor (MGS) (NASA/JPL/MSSS) respectively. Size to scale. ... 3
Figure 1.2: The 2001 global dust storm as seen from the Mars Orbiter Camera (MOC). Images centered on the Tharsis volcanic region. These images capture the 2001 global dust storm as southern winter transitions to spring (NASA/JPL/MSSS). ... 4
Figure 1.3: The topography of Mars by the Mars Orbiter Laser Altimeter (MOLA). This map shows the general topography of Mars where blues and purples are lowest in elevation
(Hellas Basin ~-7 km) and browns and whites are highest (Olympus Mons ~25 km). The global dichotomy is also apparent (mostly greens) and marks the boundary from the northern lowlands (blues) to the southern highlands (yellows and oranges). Image credit: NASA/MOLA Science Team. ... 6
Figure 1.4: Geologic timescale of Mars compared to Earth. ... 7
Figure 1.5: The impact cratering process as illustrated by Osinski, 2004. ... 11
Figure 1.6: Examples of the three crater morphology types: (a) 4 km diameter simple crater located 316.10° E, 38.69° N (HiRISE image ID: ESP_020245_2190_RED); (b) 24 km diameter complex crater located 122.97° E, 4.06° N (CTX mosaic:
P17_007752_1832_XN_03N237W; B19_016903_1828_XN_02N237W;
P21_009189_1827_XN_02N236W); (c) 7.6 km diameter transitional crater located 277.77° E, 23.81° S (CTX image ID: G12_022818_1564_XN_23S082W). ... 15
Figure 1.7: Winslow crater (1.1 km diameter) on Mars (59.16° E, 3.74° S) displaying a radial ejecta morphology (CTX image ID: P08_004313_1780_XI_02S301W). ... 16
x
angles and velocities). The largest particles fall closer to the rim while smaller particles travel further. Airborne (primary) ejecta re-impacts the target and incorporates local material
(secondary ejecta) into the developing ejecta blanket which then moves as a ground-hugging flow behind the primary ejecta curtain. The interaction of airborne (primary) ejecta (black circles) with the surface (dashed lines) are depicted in the three lower boxes. ... 17
Figure 1.9: The 3 common types of layered ejecta morphologies: (a) 12 km diameter single layered ejecta (SLE) crater located 80.47° E, 36.02° N (CTX mosaic:
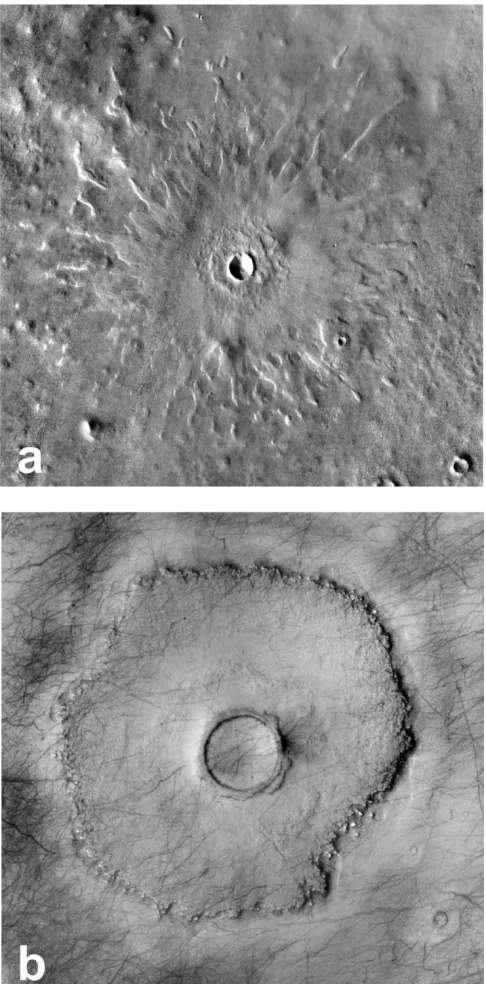
B05_011564_2163_XN_36N279W; P18_008083_2177_XN_37N280W); (b) Steinheim Crater, an 11 km diameter double layered ejecta (DLE) crater located 190.65° E, 54.57° N (CTX mosaic: G21_026302_2344_XN_54N169W; G02_018944_2348_XI_54N168W; P15_006945_2349_XN_54N169W; P17_007736_2349_XI_54N169W); (c) Tooting Crater, a 28 km diameter multiple layered ejecta (MLE) crater located 207.76° E, 23.21° N
(THEMIS day IR 100m global mosaic). ... 21
Figure 1.10: Example of a LARLE (a) and pedestal (b) crater on Mars. (a) 5 km diameter crater located 266.37° E, 68.29° N (THEMIS day IR 100m global mosaic); (b) 3 km diameter crater located 91.78° E, 55.28° N (CTX mosaic: G23_027110_2354_XN_55N268W;
G21_026477_2355_XN_55N267W). ... 22
Figure 1.11: Schematic diagram of the atmospheric model. Ejecta is emplaced ballistically in which finer particles are winnowed out of the advancing curtain from atmospheric drag. A vortex ring is produced by atmospheric turbulence which can then remobilize emplaced ejecta and deposit smaller material over initial ejecta. ... 24
Figure 1.12: Schematic diagram showing the inner layer being emplaced before the outer layer. Outer layer is emplaced as a base surge-like process, flowing over and beyond the inner layer and etching grooves into the inner layer. ... 26
Figure 1.13: Schematic diagram showing the interaction of near-surface and atmospheric volatiles to produce a layered ejecta morphology. ... 27
xi
stage. ... 30
Figure 1.15: Schematic diagram of the glacial substrate model. The outer layer is emplaced ballistically while the inner layer is emplaced via landslide mode off of the uplifted crater rim. Impact into a glacial substrate provides ample volatile concentrations to initiate slide mechanism of the inner layer. ... 31
Figure 1.16: Schematic diagram showing the outer layer being emplaced first as a debris flow mode and the inner layer being emplaced as a translational slide model. ... 32
Figure 2.1: Example of a double layered ejecta crater in the Syrtis Major region (75.46° E, 9.61° N). HRSC (IDs: H0230_0000_ND4 and H3025_0000_ND4) and THEMIS Day IR 100m mosaic. Scale bar 10 km. North is up. ... 45
Figure 2.2: Geologic map of Mars highlighting volcanic geologic units (shades of red) (modified after Skinner et al., 2006). DLEs are plotted in yellow. ... 49
Figure 2.3: Representative DLEs from each study region. Scale bars 10 km. North is up in all images. (a) N Tharsis (276.54° E, 39.73°), THEMIS Day IR 100m global mosaic. (b)
Elysium (145.63° E, 9.63°), HRSC image ID: H2973_0000_ND4. (c) S Tharsis (301.04° E, -10.21°), CTX image ID: G22_026773_1700_XN_10S059W. (d) Hesperia Planum (119.51° E, -23.24°), CTX mosaic: B20_017312_1564_XN_23S240W,
B18_016745_1551_XN_24S240W, B09_013066_1565_XN_23S240W. ... 50
Figure 2.4: Distribution of binned EM data on MOLA shaded relief map of Mars. Data is binned by 0.1 increments. (a) Outer layer EM. (b) Inner layer EM. ... 54
xii
across latitude. EM values in legend are grouped in 0.5 intervals. Number of craters in a specific series is labeled within each respective bar while total number of craters in each latitude bin are labeled in white boxes. (b) Box plot showing the distribution of EM values within each region. Whiskers represent minimum and maximum values. Average (positive) latitudes are listed with each respective region... 56
Figure 2.7: Distribution of binned lobateness data on MOLA shaded relief map of Mars. Data is binned by 0.1 increments. (a) Outer layer EM. (b) Inner layer EM. ... 58
Figure 2.8: Lobateness of outer layers. (a) Normalized frequency of lobateness values across latitude. Lobateness values in legend are grouped in 0.5 intervals. Number of craters in a specific series is labeled within each respective bar while total number of craters in each latitude bin are labeled in white boxes. (b) Box plot showing the distribution of lobateness values within each region. Whiskers represent minimum and maximum values. Average (positive) latitudes are listed with each respective region. ... 59
Figure 2.9: Lobateness of inner layers. (a) Normalized frequency of lobateness values across latitude. Lobateness values in legend are grouped in 0.5 intervals. Number of craters in a specific series is labeled within each respective bar while total number of craters in each latitude bin are labeled in white boxes. (b) Box plot showing the distribution of lobatness values within each region. Whiskers represent minimum and maximum values. Average (positive) latitudes are listed with each respective region. ... 60
Figure 2.10: DLEs located in Tharsis with grooves (a, b, c) and without grooves (d, e, f). All scale bars 10 km except b (5 km). North is up in all images. (a) N Tharsis (276.54° E, 39.73°), CTX mosaic: P12_005663_2185_XI_38N083W,
xiii
F04_037547_1684_XN_11S081W, D22_035991_1684_XN_11S081W. ... 63
Figure 2.11: Distribution of DLEs displaying grooves (blue) and those lacking grooves (yellow) over MOLA shaded relief map of Mars (top) and TES colorized dust cover index (bottom). Warmer colors represent areas of higher dust cover; cooler colors represent areas of lower dust cover. Values in Tables 3 and 4 were derived from the map sampling feature in JMARS where the average DCI (after Ruff and Christensen, 2002) was calculated for the total area of a DLE (i.e., area of outer layer) and then averaged with the total DLEs within a specific region. ... 64
Figure 2.12: Topographic profiles of representative DLEs from each study region using HRSC DTMs. Dotted lines are planes of reference. All scale bars are 10 km. North is up in all images. (a) 11.7 km diameter crater located in N Tharsis (268.69° E, 55.58°). Vertically exaggerated ~17x. Image ID: H1594_0000. (b) 4.9 km diameter crater located in Elysium (178.26° E, 31.40°). Vertically exaggerated ~17x. Image ID: H1540_0009. (c) 14.7 km diameter crater located in Syrtis Major (75.47° E, 9.61°). Vertically exaggerated ~8x. Image ID: H3025_0000. (d) 5.9 km diameter crater located in S Tharsis (301.04° E, -10.21°). Vertically exaggerated ~6x. Image ID: H1918_0000. (e) 12.8 km diameter crater located in Hesperia Planum (100.44° E, -30.14°). Vertically exaggerated ~9x. Image ID: H0022_0000. ... 66
Figure 2.13: Examples of the two recently proposed DLE types in the Hesperia region. All scale bars are 10 km. North is up in all images. CTX mosaic: (a)
G07_020807_1528_XN_27S258W, B20_017550_1486_XI_31S258W, D13_032345_1512_XN_28S258W; (b) G19_025461_1417_XN_38S237W, F02_036432_1391_XN_40S236W; (c) B20_017312_1564_XN_23S240W, B18_016745_1551_XN_24S240W, B09_013066_1565_XN_23S240W; (d) D21_035417_1540_XN_26S249W, B18_016508_1568_XN_23S250W, G19_025646_1564_XN_23S249W, B17_016297_1565_XN_23S249W,
xiv
diameter crater located at 120.53° E, 34.71°N; CTX mosaic:
D04_028863_2145_XN_34N239W, D15_033122_2158_XN_35N239W, P20_008833_2149_XN_34N239W, G22_026964_2131_XN_33N239W,
G20_025975_2135_XN_33N288W. (b) 10.7 km diameter crater located at 95.71° E, 57.00° N; CTX mosaic: D21_035549_2381_XN_58N265W, D22_035694_2379_XN_57N263W, G01_018420_2372_XN_57N264W, P16_007344_2382_XN_58N264W. (c) 10.8 km diameter crater located at 308.86° E, 42.54° N; CTX mosaic:
B02_010527_2228_XN_42N051W, B17_016118_2250_XN_45N051W. (d) 16.7 km diameter crater located at 296.50° E, 6.81° N; CTX mosaic:
B02_010554_1869_XN_06N063W, G22_026628_1876_XN_07N063W. (e) 14.8 km diameter crater located at 119.51° E, 23.24° S; CTX mosaic:
B20_017312_1564_XN_23S240W, B18_016745_1551_XN_24S240W,
B09_013066_1565_XN_23S240W. (f) 14.7 km diameter crater located at 75.47° E, 9.61° N; HRSC image ID: H0232_0000; H3025_0000. ... 95
Figure 3.2: Geologic map of Mars modified after Scott and Tanaka (1986), Greeley and Guest (1987), and digitized into ArcGIS by Skinner et al. (2006). Shades of red are
interpreted as largely volcanic terrains while blues represent non-volcanic terrains. DLEs are plotted as white circles (non-volcanic) and yellow triangles (volcanic). Though there are some lava flows within Utopia Planitia, we consider it largely a non-volcanic terrain based on the regional interpretation (Table 2). ... 96
Figure 3.3: Box plots showing the distribution of EM values for the outer (a) and inner (b) layers. Data is binned by 10° latitude. Non-volcanic DLEs are plotted in blue, volcanic DLEs in red. Whiskers represent minimum and maximum values with outliers plotted as circles. The horizontal lines within each box represent the median EM value. ... 101
xv
(a) shows the outer layer EM, bottom plot (b) shows the inner layer EM. Data is binned by 0.2 values. Non-volcanic DLEs are plotted as circles, volcanic DLEs are triangles. ... 103
Figure 3.6: Box plots showing the distribution of lobateness values for the outer (a) and inner (b) layers. Data is binned by 10° latitude. Non-volcanic DLEs are plotted in blue, volcanic DLEs in red. Whiskers represent minimum and maximum values with outliers plotted as circles. The horizontal lines within each box represent the median lobateness value. ... 105
Figure 3.7: Box plots showing the distribution of lobateness values for the outer (a) and inner (b) layers. Data is binned by crater diameter (every 3 km). Non-volcanic DLEs are plotted in blue, volcanic DLEs in red. Whiskers represent minimum and maximum values with outliers plotted as circles. The horizontal lines within each box represent the median lobateness value. ... 106
Figure 3.8: Distribution of binned lobateness data over MOLA shaded relief map of Mars. Top plot (a) shows the outer layer lobateness, bottom plot (b) shows the inner layer
lobateness. Data is binned by 0.2 values. Non-volcanic DLEs are plotted as circles, volcanic DLEs are triangles... 107
Figure 3.9: Topographic profiles of the craters in Fig. 1 derived from MOLA DTMs. Blue profiles are non-volcainc DLEs (a, b, c), red profiles are volcanic DLEs (d, e, f). Dashed lines are planes of reference to emphasize the topography of ejecta. Vertical exaggeration (VE) is included within each profile. IDs for context images are the same as those in Fig. 1 unless otherwise noted. (a) 12.2 km diameter crater located in Utopia Planitia (120.53° E, 34.71°N). (b) 10.7 km diameter crater located in Utopia Planitia (95.71° E, 57.00°N). (c) 10.8 km diameter crater located in Acidalia Planitia (308.86° E, 42.54°N). (d) 16.7 km diameter crater located in Tharsis (296.50° E, 6.81° N). (e) 14.8 km diameter crater located in Hesperia Planum (119.51° E, 23.24° S). (f) 14.7 km diameter crater located in Syrtis Major (75.47° E, 9.61° N). CTX image ID: G01_018698_1896_XN_09N284W. ... 110
xvi
xvii
List of Appendices
Chapter 1
1
Introduction
Impact cratering is a geologic process common on every planetary body throughout the solar system. This process involves a projectile (e.g., asteroid, comet) striking the surface of another planetary body at high velocities leaving an initially bowl-shaped depression on the surface called an impact crater. During the impact cratering process, material derived from the subsurface is excavated and emplaced onto the surface outside the crater as a “blanket” (i.e., deposit) referred to as ejecta. By studying impact ejecta, we are also able to study not only the impact process, but the subsurface of planetary bodies. This is especially important for Mars as we currently can only make inferences of the geological makeup of the subsurface from orbit as well as in a few remote locations by current and past rovers. Because Earth is a dynamic geologic body, impact ejecta is quickly modified (e.g., eroded or buried) following emplacement and inevitably becomes recycled, along with the crater itself, into the upper mantle by plate tectonics. In comparison, erosion rates on Mars are extremely low (e.g., Golombek and Bridges, 2000; Golombek et al., 2006) and because the planet lacks plate tectonics, craters and ejecta can be preserved throughout a significant amount of geologic time, making Mars an ideal place to study impact ejecta.
ejecta morphology surrounding craters ≥ 5 km in diameter (Barlow, 1988, 2007). Morphologies include single- (SLE), double- (DLE), and multiple- (MLE) layered ejecta and are defined as displaying one, two, or more than two partial or continuous ejecta layers, respectively (Barlow et al., 2000). While SLEs are abundant globally and MLEs are few in numbers, DLEs are of particular interest because they are heavily concentrated at mid- to high-latitudes, in addition to having two continuous layers of ejecta; one being superposed on top of the other.
The emplacement process of DLEs is not well understood, including as to which layer was emplaced first. This study attempts to answer said question and provide insight into the emplacement process by focusing on the effect target and surface properties have on the morphology and morphometry of DLE craters on Mars. A total of 206 DLE craters were selected for analysis and included two different terrain types: 127 on what is interpreted as volcanic terrains and 79 on what is largely interpreted as sedimentary terrains (Scott and Tanaka, 1986; Greeley and Guest, 1987; Skinner et al., 2006). Analysis included measurement of each ejecta layer (both inner and outer layers) to determine ejecta mobility, the extent an ejecta layer travels from the crater rim, and lobateness, sinuosity of the distal edge of the ejecta layer. This chapter (Chapter 1) provides an overview of Mars, the impact cratering process, and ejecta morphologies on Mars, including current models of the emplacement process of DLE craters. Chapter 2 focuses on the morphology and morphometry of DLEs exclusively in volcanic terrains on Mars while Chapter 3 compares these volcanic DLEs to DLEs situated on largely sedimentary targets. Chapter 4 provides a conclusion of the overall thesis including major results, interpretations, and future work.
1.1
Mars
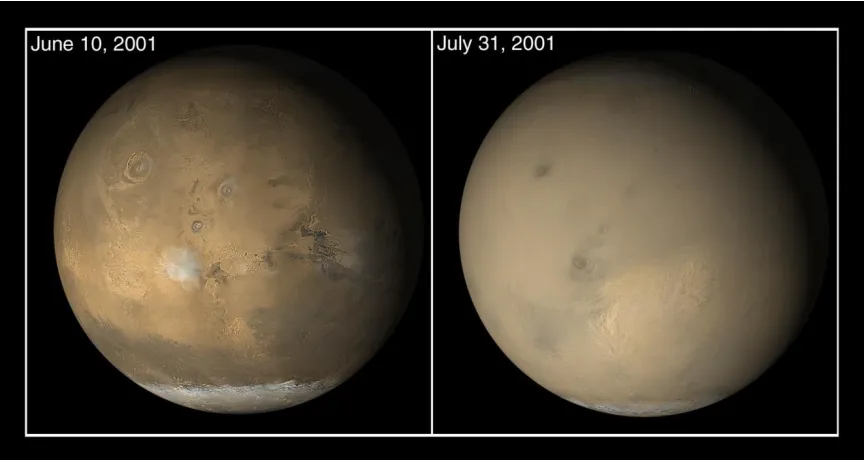
as ~60° throughout geologic history (Laskar et al., 2004). This fluctuation can cause extreme climate changes, which affects the global distribution of ice. Though the atmosphere is dominantly carbon dioxide, it is relatively thin and dry, making it difficult to absorb and retain solar radiation. Due to this and Mars’ distance from the Sun, average diurnal temperatures range from ~150 K (-123°C) at the poles to 240 K (-33°C) in the southern hemisphere during midsummer (Kieffer et al., 1977). Regional dust storms are common on Mars, mainly in the southern hemisphere, but can occasional evolve into global ones, such as those observed in 1971, 1977, and 2001 (Fig. 1.2). During these storms, wind speeds average 10 m/s (with gusts up to 40 m/s) as recorded by the Viking landers (Carr, 2006).
Figure 1.1: A comparison of Earth and Mars. Image of Earth (Jan. 4, 2012) and
Mars (April 1999) taken from the VIIRS instrument onboard Suomi NPP
(NASA/NOAA/GSFC/Suomi NPP/VIIRS/Norman Kuring) and Mars Orbiter Camera
(MOC) onboard Mars Global Surveyor (MGS) (NASA/JPL/MSSS) respectively. Size
Table 1.1: Fact sheet of Earth and Mars.
Earth Mars
Distance from Sun 1.496 x 10⁸ km (1 AU) 2.279 x 10⁸ km (1.524 AU)
Radius 6,371 km 3,390 km
Mass 5.972 x 1024 kg 6.417 x 10²³ kg
Density 5.513 g/cm3 3.934 g/cm3
Surface gravity 9.807 m/s2 3.71 m/s2 Escape velocity 11,190 m/s 5,030 m/s
Axial tilt 23.439° 25.2°
Rotation period 23.934 hours 24.623 hours Revolution period 365.26 days 686.98 Earth days Surface temperature 185–331 K 120–293 K Atmosphere N2, O2, Ar CO2, N2, Ar
Surface composition Basaltic, granitic Basaltic
Figure 1.2: The 2001 global dust storm as seen from the Mars Orbiter Camera
(MOC). Images centered on the Tharsis volcanic region. These images capture the
2001 global dust storm as southern winter transitions to spring (NASA/JPL/MSSS).
1.2
Global Structure
crustal magnetic anomalies in the southern highlands, which may indicate a molten core early on in Mars’ history (Acuna et al., 1999). The radius of the core is estimated to be 1300–1500 km (Stevenson, 2001). The Martian crust is largely basaltic and andesitic in composition, as identified by Thermal Emission Spectrometer (TES) data (Bandfield et al., 2000), although the andesitic composition is also interpreted as weathered basaltic surfaces (Wyatt et al., 2004). Crustal thicknesses are extremely varied (estimated to be 5.8–102 km) but is generally much thicker in the southern hemisphere and thinner in the northern hemisphere (Neumann et al., 2004). The upper portion of the crust is also believed to be volatile-rich, as evident by numerous morphological features suggested to result from the interaction of water and/or ice (e.g., gullies, lobate debris aprons, layered ejecta, polygons, hollows, thermokarst) (Carr, 2006). Currently, liquid water is unstable near the surface but may be present beneath a thick cryosphere; volatiles within the cryosphere will be in the solid (e.g., ice) form. It has been suggested that subsurface volatile concentrations are generally more abundant at the poles and decrease equatorward (Rossbacher and Judson, 1981; Clifford and Hillel, 1983; Clifford, 1993; Clifford and Parker, 2001; Clifford et al., 2010), and that poleward of ±40° latitude, ground ice is predicted to be stable with the atmosphere (Fanale, 1976; Clifford and Hillel, 1983).
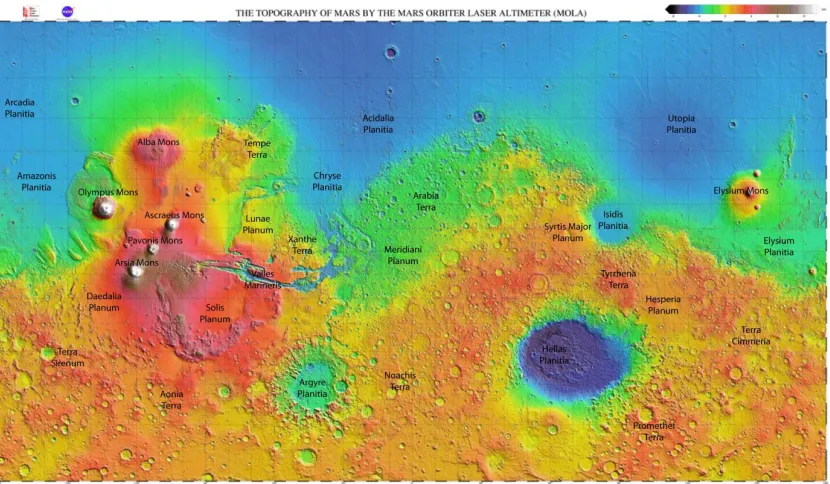
Figure 1.3: The topography of Mars by the Mars Orbiter Laser Altimeter (MOLA).
This map shows the general topography of Mars where blues and purples are lowest
in elevation (Hellas Basin ~-7 km) and browns and whites are highest (Olympus
Mons ~25 km). The global dichotomy is also apparent (mostly greens) and marks
the boundary from the northern lowlands (blues) to the southern highlands (yellows
and oranges). Image credit: NASA/MOLA Science Team.
1.3
Geologic History
or more large impacts (Marinova et al., 2008) or from an internal origin (e.g., mantle convection) (Wise et al., 1979). Tharsis volcanism is also considered to have begun by the end of the period (Carr and Head, 2010).
Figure 1.4: Geologic timescale of Mars compared to Earth.
1.3.1
Noachian Period
1.3.2
Hesperian Period
The Hesperian period distinguishes post-Noachian plains from the younger Amazonian plains and is dominantly characterized by widespread volcanism and a significant drop in impact cratering and erosion (Carr and Head, 2010). This volcanism is thought to have resurfaced ~30% of the planet mainly in the form of rigid plains and paterae (i.e. volcanic crater with scalloped edges) (Head et al., 2002; Carr and Head, 2010). Large outflow channels seen along the dichotomy are believed to have formed during the Hesperian and were likely carved by the rapid release of large volumes of liquid water from the subsurface (Carr, 1979; Wilson and Head, 2004; Ghatan et al., 2005; Carr and Head, 2010). These flooding events may have led to large bodies of water residing in topographic lows (e.g., the northern plains and large impact basins) and may have deposited sediments that make up the Vastitas Borealis Formation in the northern plains (Kreslavsky and Head, 2002). Excluding these flooding events, erosion rates dropped significantly during the Hesperian and continued through to present-day (Golombek et al., 2006; Carr and Head, 2010). The climate is suggested to have been in a transition stage from a warmer, possibly wetter early Mars into the cold dry planet we know today (Carr and Head, 2010). The formation of sulfates was abundant in the Hesperian and may have resulted from a decline in volcanic activity which lead to the removal of SO2 from
the atmosphere and a drop in temperatures moving toward a colder climate (Head et al., 2002; Bibring et al., 2006; Halevy et al., 2007; Carr and Head, 2010). Accumulation of a global cryosphere may have begun as well (Carr and Head, 2010).
1.3.3
Amazonian Period
small gullies observed on steep slopes at mid- to high-latitudes and represents the main form of fluvial activity during the Amazonian (Costard et al., 2002; Williams et al., 2009). Though the origin of gullies are still debated, their morphologic similarity to terrestrial gullies suggests that liquid water is the dominant formation agent (Malin et al., 2006). Volcanism likely occurred episodically and is characterized by much lower eruption rates concentrated mainly around the Tharsis and Elysium provinces (Werner, 2009; Carr and Head, 2010). Erosion rates are similar to those of the Hesperian period and is largely aeolian in nature as made evident by the numerous dunes distributed globally (Golombek et al., 2006; Carr and Head, 2010).
1.4
Cratering Rates and the Cratering Record on Mars
Cratering rates within the inner Solar System are thought to vary and are believed to be a function of the population of projectiles around a specific planetary body (Michel and Morbidelli, 2013). The cratering rate for the Moon has been determined by age-dating lunar samples returned from the Apollo missions. Because the location of each sample is known, an absolute age for a particular surface can be determined and subsequently, a cratering rate for the Moon can be calculated. Unfortunately for Mars, we currently have no samples collected in situ so the cratering rate can only be derived from the Moon’s. The current cratering rate on Mars is much lower than it was in the early history of the planet (e.g., Daubar et al., 2013). In fact, it is generally recognized that a spike in the impact cratering record occurred ~3.9 Ga for the entire inner Solar System and is usually referred to as the Late Heavy Bombardment (LHB) (e.g., Gomes et al., 2005; Michel and Morbidelli, 2013; Tsiganis et al., 2005). The NICE model proposes the LHB is a result from the outward migration of the giant planets to their current orbits (Gomes et al., 2005; Tsiganis et al., 2005). This in turn disrupted the whole Solar System and sent left over planetesimals towards the inner Solar System (Gomes et al., 2005).
of time. Lava flows and other geologic processes can bury or erase (i.e., resurface) older surfaces thereby providing a “clean slate” for the cratering record. Many of the craters in the southern highlands of Mars are remnants from the LHB. In addition, the largest impact basins (e.g., Hellas, Argyre, Isidis, Utopia) were formed during this time (e.g., Carr and Head, 2010; Frey, 2006). Comparatively, the northern plains are sparsely cratered and have since been resurfaced.
1.5
The Impact Cratering Process
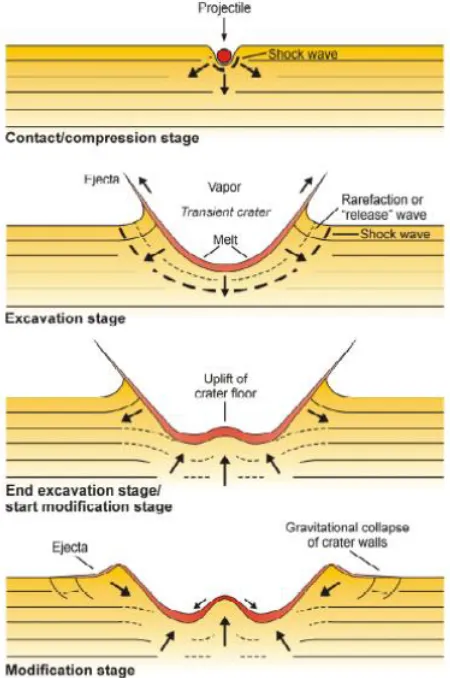
Figure 1.5: The impact cratering process as illustrated by Osinski, 2004.
1.5.1
Contact and Compression
the shock wave travels through the projectile to its rear surface at which point it is reflected back as a rarefaction wave directed back down toward the target. Once the rarefaction wave reaches the projectile-target interface, unloading occurs and pressures are reduced to near-zero (Melosh, 1989). The projectile is completely distorted as much of it is now vaporized and lines the opening crater cavity. The shock wave propagating down and outward through the target is ongoing throughout the contact and compression stage. It should be noted that the preceding processes describe a projectile striking the surface at a 90° angle (perpendicular) to the surface, though it is extremely rare for a meteorite to strike at such an angle. Most impacts come in at an oblique angle, probably ~45°, yet the processes are very similar. The main difference is the shock wave generated is asymmetric and weakens with decreasing impact angle (Pierazzo and Melosh, 2000). Therefore, the preceding processes are applicable for all but the most oblique (< 10°) impact events.
1.5.2
Excavation
formed immediately after unloading of the projectile which results from vaporization of most of the projectile and some portion of the target. This gas expands outwards at extremely high speeds and is important for distal ejecta emplacement (see later section), hence its inclusion in the excavation stage.
1.5.3
Modification
Figure 1.6: Examples of the three crater morphology types: (a) 4 km diameter
simple crater located 316.10° E, 38.69° N (HiRISE image ID:
ESP_020245_2190_RED); (b) 24 km diameter complex crater located 122.97° E,
4.06° N (CTX mosaic: P17_007752_1832_XN_03N237W;
B19_016903_1828_XN_02N237W; P21_009189_1827_XN_02N236W); (c) 7.6 km
diameter transitional crater located 277.77° E, 23.81° S (CTX image ID:
G12_022818_1564_XN_23S082W).
1.6
Ejecta Morphologies on Mars
Relatively fresh impact craters on terrestrial bodies usually exhibit continuous ejecta blankets that extend > ~1 crater radii from the crater rim (Melosh, 1989). Several types of ejecta morphologies surrounding Martian craters have been recognized and are markedly different from those observed on the Moon and Mercury (discussed below).
1.6.1
Radial Ejecta
(Oberbeck, 1975; Hӧrz et al., 1983; Melosh, 1989; Osinski et al., 2013). A typical topographic profile of radial ejecta morphologies usually show thicker deposits near the rim that rapidly thin outwards (e.g., McGetchin et al., 1973; Melosh, 1989).
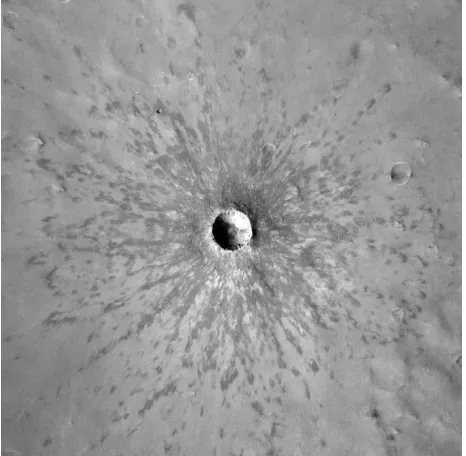
Figure 1.7: Winslow crater (1.1 km diameter) on Mars (59.16° E, 3.74° S) displaying
Figure 1.8: Ballistic sedimentation model (after Oberbeck, 1975). Material ejected
out of the transient cavity follow ballistic trajectories where the innermost ejecta is
ejected first (at the steepest angles and highest velocities) and material closest to the
rim is ejected later (at lower angles and velocities). The largest particles fall closer to
the rim while smaller particles travel further. Airborne (primary) ejecta re-impacts
the target and incorporates local material (secondary ejecta) into the developing
ejecta blanket which then moves as a ground-hugging flow behind the primary
ejecta curtain. The interaction of airborne (primary) ejecta (black circles) with the
surface (dashed lines) are depicted in the three lower boxes.
1.6.2
Layered Ejecta Morphologies
2006). It is generally accepted that volatile content within the target (Carr et al., 1977; Mouginis-Mark, 1981, 1987; Wohletz and Sheridant, 1983; Costard, 1989; Barlow and Bradley, 1990; Barlow and Perez, 2003; Barlow, 2005; Osinski, 2006; Boyce and Mouginis-Mark, 2006; Komatsu et al., 2007; Oberbeck, 2009), atmosphere (Schultz and Gault, 1979; Schultz, 1992; Barnouin-Jha and Schultz, 1998; Barnouin-Jha et al., 1999a, 1999b), or a combination of the two (Barlow, 2005; Komatsu et al., 2007) is largely responsible for the mobilization of ejecta, though emplacement as a granular flow has also been proposed (Barnouin-Jha et al., 2005; Wada and Barnouin-Jha, 2006). Of the 10,651 cataloged Martian craters ≥5 km in diameter that display some sort of discernible ejecta blanket (e.g., radial, layered), layered morphologies make up over 90% (Barlow, 1988, 2005, 2007).
1.6.2.1
Layered Ejecta Morphology Types
Figure 1.9: The 3 common types of layered ejecta morphologies: (a) 12 km diameter
single layered ejecta (SLE) crater located 80.47° E, 36.02° N (CTX mosaic:
B05_011564_2163_XN_36N279W; P18_008083_2177_XN_37N280W); (b) Steinheim
Crater, an 11 km diameter double layered ejecta (DLE) crater located 190.65° E,
54.57° N (CTX mosaic: G21_026302_2344_XN_54N169W;
G02_018944_2348_XI_54N168W; P15_006945_2349_XN_54N169W;
P17_007736_2349_XI_54N169W); (c) Tooting Crater, a 28 km diameter multiple
layered ejecta (MLE) crater located 207.76° E, 23.21° N (THEMIS day IR 100m
Figure 1.10: Example of a LARLE (a) and pedestal (b) crater on Mars. (a) 5 km
diameter crater located 266.37° E, 68.29° N (THEMIS day IR 100m global mosaic);
(b) 3 km diameter crater located 91.78° E, 55.28° N (CTX mosaic:
1.7
Double Layered Ejecta Emplacement Models
Early emplacement models originated prior to the higher resolution data readily available today and were developed almost exclusively using Viking orbiter data. Carr et al., (1977) is usually credited as the first to propose that the emplacement of layered ejecta is via a ground hugging flow. This model is still widely used as the foundation for the more recent models discussed below.
It is generally acknowledged that the layers of DLE morphologies are emplaced in two (or more) separate stages, where fluidity of the ejected material is thought to vary (Mouginis-Mark 1981; Boyce and Mouginis-Mark 2006; Barlow 1994; Osinski et al. 2011). Several models have been proposed involving the formation process of DLE morphologies, yet an ongoing debate remains for the emplacement chronology of the inner and outer ejecta layers. Based solely on appearance, the inner layer appears superposed on the outer layer. Applying Steno’s Law of Superposition, the inner layer would, therefore, be younger than the outer implying emplacement after. However, the outer layer is much thinner, therefore finer-grained, than the inner layer, thus some workers have proposed that it could be draped over the inner layer and still appear below (e.g., Mouginis-Mark, 1981; Boyce and Mouginis-Mark, 2006). Despite this dispute, all agree that the incorporation of volatiles in the ejecta blanket, either derived from the subsurface (Carr et al., 1977; Mouginis-Mark, 1981, 1987; Wohletz and Sheridant, 1983; Costard, 1989; Barlow and Bradley, 1990; Barlow and Perez, 2003; Barlow, 2005; Osinski, 2006; Boyce and Mouginis-Mark, 2006; Komatsu et al., 2007; Oberbeck, 2009), atmosphere (Schultz and Gault, 1979; Schultz, 1992; Barnouin-Jha and Schultz, 1998; Barnouin-Jha et al., 1999a, 1999b), or some combination of the two (Barlow, 2005; Komatsu et al., 2007) allow enhanced mobility of ejecta during emplacement.
1.7.1
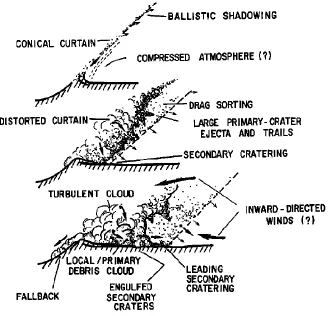
Schultz and Gault (1979) and Schultz (1992) Atmospheric
Model
their ballistic trajectories. Finer particles suspended in this “distorted” curtain eventually fall back down producing a turbulent cloud (or base surge) over the already emplaced ejecta. This density current can remobilize emplaced ejecta as well as deposit finer grained material on top. Vapor explosions produced by melt-water interactions are also suggested to modify the ballistic flow field (Wohletz and Sheridant, 1983).
Figure 1.11: Schematic diagram of the atmospheric model. Ejecta is emplaced
ballistically in which finer particles are winnowed out of the advancing curtain from
atmospheric drag. A vortex ring is produced by atmospheric turbulence which can
then remobilize emplaced ejecta and deposit smaller material over initial ejecta.
1.7.2
Mouginis-Mark (1981) and Boyce and Mouginis-Mark (2006)
Model
Figure 1.12: Schematic diagram showing the inner layer being emplaced before the
outer layer. Outer layer is emplaced as a base surge-like process, flowing over and
beyond the inner layer and etching grooves into the inner layer.
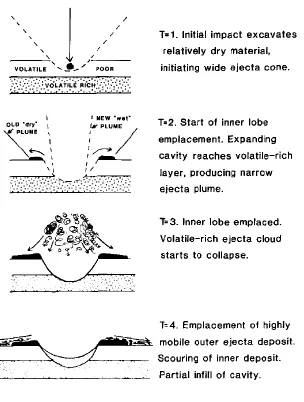
1.7.3
Komatsu et al. (2007) Model
surge, assists mobility of the inner layer and contains fine-particles winnowed from the initial ejecta curtain. This material scours grooves into both ejecta layers and deposits the remainder of the outer layer. In this model, the outer layer can contain material prior to, and after the emplacement of the inner layer.
Figure 1.13: Schematic diagram showing the interaction of near-surface and
1.7.4
Osinski et al. (2011) Model
Figure 1.14: Schematic diagram showing emplacement of the outer layer first via
ballistic sedimentation and radial flow. The inner layer is emplaced after as
melt-rich material (within transient cavity) that flows out and over crater rim via uplift
during the crater modification stage.
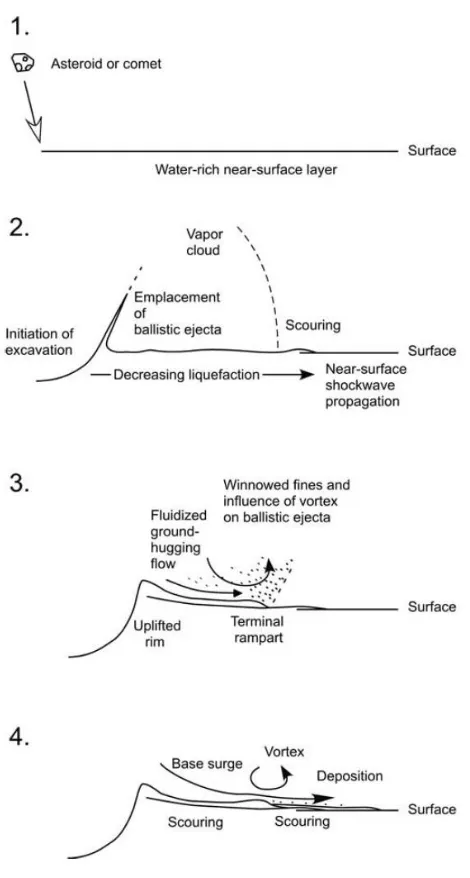
1.7.5
Weiss and Head (2013) Glacial Substrate Model
Figure 1.15: Schematic diagram of the glacial substrate model. The outer layer is
emplaced ballistically while the inner layer is emplaced via landslide mode off of the
uplifted crater rim. Impact into a glacial substrate provides ample volatile
concentrations to initiate slide mechanism of the inner layer.
1.7.6
Wulf and Kenkmann (2015) Model
near the transient cavity rim because of low ejection velocities. As the loading pressure builds on proximal ejecta, basal frictional heating melts the ice component of ejecta and promotes a transitional slide mode of the inner layer on top of the outer layer.
Figure 1.16: Schematic diagram showing the outer layer being emplaced first as a
debris flow mode and the inner layer being emplaced as a translational slide model.
1.8
References
Acuna, M.H., Connerney, J.E.P., Ness, N.F., Lin, R.P., Mitchell, D., Carlson, C.W., McFadden, J., Anderson, K.A., Reme, H., Mazelle, C., Vignes, D., Wasilewski, P., Cloutier, P., 1999. Global Distribution of Crustal Magnetization Discovered by the Mars Global Surveyor MAG/ER Experiment. Science (80-. ). 284, 790–793. doi:10.1126/science.284.5415.790.
Bandfield, J.L., Hamilton, V.E., Christensen, P.R., 2000. A global view of martian surface compositions from MGS-TES. Science (80-. ). 287, 1626 – 1630.
Barlow, N.G., 1988. Crater size-frequency distributions and a revised Martian relative chronology. Icarus 75, 285–305. doi:10.1016/0019-1035(88)90006-1.
Barlow, N.G., 2005. A review of Martian impact crater ejecta structures and their implications for target properties, in: Kenkmann, T., Hörz, F., Deutsch, A. (Eds.), Large Meteorite Impacts III, Geol. Soc. Am. Spec. Pap. 384. pp. 433 – 442.
Barlow, N.G., 2006. Impact craters in the northern hemisphere of Mars: Layered ejecta and central pit characteristics. Meteorit. Planet. Sci. 41, 1425–1436. doi:10.1111/j.1945-5100.2006.tb00427.x.
Barlow, N.G., 2007. New insights into impact crater morphologies from the revised Catalog of Large Martian Impact Craters. Seventh Int. Conf. Mars Abstract #3347.
Barlow, N.G., Bradley, T.L., 1990. Martian impact craters: Correlations of ejecta and interior morphologies with diameter, latitude, and terrain. Icarus 87, 156–179.
Barlow, N.G., Perez, C.B., 2003. Martian impact crater ejecta morphologies as indicators of the distribution of subsurface volatiles. J. Geophys. Res. 108, 5085. doi:10.1029/2002JE002036.
Barlow, N.G., Boyce, J.M., Costard, F.M., Craddock, R.A., Garvin, J.B., Sakimoto, S.E.H., Kuzmin, R.O., Roddy, D.J., Soderblom, L.A., 2000. Standardizing the nomenclature of Martian impact crater ejecta morphologies. J. Geophys. Res. 105, 26733 – 26738.
Barlow, N.G., Boyce, J.M., Cornwall, C., 2014. Martian Low-Aspect-Ratio Layered Ejecta (LARLE) craters: Distribution, characteristics, and relationship to pedestal craters. Icarus 239, 186–200. doi:10.1016/j.icarus.2014.05.037.
Barnouin-Jha, O.S., Schultz, P.H., Lever, J.H., 1999a. Investigating the interactions between an atmosphere and an ejecta curtain 1. Wind tunnel tests. J. Geophys. Res. 104, 27105–27115.
Barnouin-Jha, O.S., Schultz, P.H., Lever, J.H., 1999b. Investigating the interactions between an atmosphere and an ejecta curtain 2. Numerical experiments. J. Geophys. Res. 104, 27117–27131.
Barnouin-Jha, O.S., Baloga, S., Glaze, L., 2005. Comparing landslides to fluidized crater ejecta on Mars. J. Geophys. Res. 110. doi:10.1029/2003JE002214.
Bibring, J.-P., Langevin, Y., Mustard, J.F., Poulet, F., Arvidson, R., Gendrin, A., Gondet, B., Mangold, N., Pinet, P., Forget, F., Team, the O., 2006. Global mineralogical and aqueous Mars history derived from OMEGA/Mars Express data. Science (80-. ). 312, 400–404. doi:10.1126/science.1122659.
Boyce, J.M., Mouginis-Mark, P.J., 2006. Martian craters viewed by the Thermal Emission Imaging System instrument: Double-layered ejecta craters. J. Geophys. Res. 111. doi:10.1029/2005JE002638.
Boyce, J.M., Wilson, L., Barlow, N.G., 2015. Origin of the outer layer of martian low-aspect ratio layered ejecta craters. Icarus 245, 263–272. doi:10.1016/j.icarus.2014.07.032.
Buchner, E., Schwarz, W.H., Schmieder, M., Trieloff, M., 2010. Establishing a 14.6 ± 0.2 Ma age for the Nördlinger Ries impact (Germany) – A prime example for concordant isotopic ages from various dating materials. Meteorit. Planet. Sci. 45, 662–674. doi:10.1111/j.1945-5100.2010.01046.x.
Carr, M.H., 1979. Formation of Martian flood features by release of water from confined aquifers. J. Geophys. Res. 84, 2995–3007. doi:10.1029/JB084iB06p02995.
Carr, M.H., Head, J.W., 2010. Geologic history of Mars. Earth Planet. Sci. Lett. 294, 185–203. doi:10.1016/j.epsl.2009.06.042.
Carr, M.H., Crumpler, L.S., Cutts, J.A., Greeley, R., Guest, J.E., Masursky, H., 1977. Martian impact craters and emplacement of ejecta by surface flow. J. Geophys. Res. 82, 4055–4065. doi:10.1029/JS082i028p04055.
Clifford, S.M., 1993. A model for the hydrologic and climatic behavior of water on Mars. J. Geophys. Res. 98, 10973–11016. doi:10.1029/93JE00225.
Clifford, S.M., Hillel, D., 1983. The stability of ground ice in the equatorial region of Mars. J. Geophys. Res. 88, 2456–2474. doi:10.1029/JB088iB03p02456.
Clifford, S.M., Parker, T.J., 2001. The evolution of the Martian hydrosphere: Implications for the fate of a primordial ocean and the current state of the northern plains. Icarus 154, 40–79. doi:10.1006/icar.2001.6671.
Clifford, S.M., Lasue, J., Heggy, E., Boisson, J., McGovern, P., Max, M.D., 2010. Depth of the Martian cryosphere: Revised estimates and implications for the existence and detection of subpermafrost groundwater. J. Geophys. Res. 115. doi:10.1029/2009JE003462.
Costard, F.M., 1989. The spatial distribution of volatiles in the Martian hydrolithosphere. Earth. Moon. Planets 45, 265–290.
Costard, F., Forget, F., Mangold, N., Peulvast, J.P., 2002. Formation of recent Martian debris flows by melting of near-surface ground ice at high obliquity. Science (80-. ). 295, 110–113. doi:10.1126/science.1066698.
Daubar, I.J., McEwen, A.S., Byrne, S., Kennedy, M.R., Ivanov, B., 2013. The current martian cratering rate. Icarus 225, 506–516. doi:10.1016/j.icarus.2013.04.009.
Fastook, J.L., Head, J.W., Marchant, D.R., Forget, F., 2008. Tropical mountain glaciers on Mars: Altitude-dependence of ice accumulation, accumulation conditions, formation times, glacier dynamics, and implications for planetary spin-axis/orbital history. Icarus 198, 305–317. doi:10.1016/j.icarus.2008.08.008.
Frey, H. V., 2006. Impact constraints on, and a chronology for, major events in early Mars history. J. Geophys. Res. Planets 111, E08S91. doi:10.1029/2005JE002449.
Gault, D.E., Quaide, W.L., Oberbeck, V.R., 1968. Impact cratering mechanics and structures, in: French, B.M., Short, N.M. (Eds.), Shock Metamorphism of Natural Materials. Baltimore: Mono Book Corp.
Gentner, W., Wagner, A.W., 1969. Altersbestimmungen an Riesglfisern und Moldaviten. Geol. Bavarica 61, 296–303.
Ghatan, G.J., Head, J.W., Wilson, L., 2005. Mangala Valles, Mars: Assessment of early stages of flooding and downstream flood evolution. Earth, Moon Planets 96, 1–57. doi:10.1007/s11038-005-9009-y.
Golombek, M.P., Bridges, N.T., 2000. Erosion rates on Mars and implications for climate change: Constraints from the Pathfinder landing site. J. Geophys. Res. 105, 1841– 1853.
Golombek, M.P., Grant, J.A., Crumpler, L.S., Greeley, R., Arvidson, R.E., Bell, J.F., Weitz, C.M., Sullivan, R., Christensen, P.R., Soderblom, L.A., Squyres, S.W., 2006. Erosion rates at the Mars Exploration Rover landing sites and long-term climate change on Mars. J. Geophys. Res. 111. doi:10.1029/2006JE002754.
Gomes, R., Levison, H.F., Tsiganis, K., Morbidelli, A., 2005. Origin of the cataclysmic Late Heavy Bombardment period of the terrestrial planets. Nature 435, 466–469. doi:10.1038/nature03676.
Halevy, I., Zuber, M.T., Schrag, D.P., 2007. A sulfur dioxide climate feedback on early Mars. Science (80-. ). 318, 1903–1907.
Head, J.W., Marchant, D.R., 2003. Cold-based mountain glaciers on Mars : Western Arsia Mons. Geology 31, 641–644.
Head, J.W., Marchant, D.R., 2006. Evidence for global-scale northern mid-latitude glaciation in the Amazonian period of Mars: Debris-covered glacier and valley glacier deposits in the 30 - 50 N latitude band. Lunar Planet. Sci. Conf. XXXVII. doi:10.1029/2004.
Head, J.W., Kreslavsky, M.A., Pratt, S., 2002. Northern lowlands of Mars: Evidence for widespread volcanic flooding and tectonic deformation in the Hesperian Period. J. Geophys. Res. 107, 5003.
Head, J.W., Neukum, G., Jaumann, R., Hiesinger, H., Hauber, E., Carr, M.H., Masson, P., Foing, B., Hoffmann, H., Kreslavsky, M., Werner, S., Milkovich, S., van Gasselt, S., 2005. Tropical to mid-latitude snow and ice accumulation, flow and glaciation on Mars. Nature 434, 346–351.
Head, J.W., Marchant, D.R., Agnew, M.C., Fassett, C.I., Kreslavsky, M.A., 2006. Extensive valley glacier deposits in the northern mid-latitudes of Mars: Evidence for Late Amazonian obliquity-driven climate change. Earth Planet. Sci. Lett. 241, 663– 671. doi:10.1016/j.epsl.2005.11.016.
Head, J.W., Marchant, D.R., Dickson, J.L., Kress, A.M., Baker, D.M., 2010. Northern mid-latitude glaciation in the Late Amazonian period of Mars: Criteria for the recognition of debris-covered glacier and valley glacier landsystem deposits. Earth Planet. Sci. Lett. 294, 306–320. doi:10.1016/j.epsl.2009.06.041.
Kadish, S.J., Barlow, N.G., Head, J.W., 2009. Latitude dependence of Martian pedestal craters: Evidence for a sublimation-driven formation mechanism. J. Geophys. Res. Planets 114, E10001. doi:10.1029/2008JE003318.
Kieffer, H.H., Martin, T.Z., Peterfreund, A.R., Jakosky, B.M., Miner, E.D., Palluconi, F.D., 1977. Thermal and albedo mapping of Mars during the Viking primary mission. J. Geophys. Res. 82, 4249–4291. doi:10.1029/JS082i028p04249.
Komatsu, G., Ori, G.G., Di Lorenzo, S., Rossi, A.P., Neukum, G., 2007. Combinations of processes responsible for Martian impact crater “layered ejecta structures” emplacement. J. Geophys. Res. 112. doi:10.1029/2006JE002787.
Kreslavsky, M.A., Head, J.W., 2002. Fate of outflow channel effluents in the northern lowlands of Mars: The Vastitas Borealis Formation as a sublimation residue from frozen ponded bodies of water. J. Geophys. Res. 107, 5121. doi:10.1029/2001JE001831
Laskar, J., Correia, A.C.M., Gastineau, M., Joutel, F., Levrard, B., Robutel, P., 2004. Long term evolution and chaotic diffusion of the insolation quantities of Mars. Icarus 170, 343–364. doi:10.1016/j.icarus.2004.04.005.
Madeleine, J.-B., Forget, F., Head, J.W., Levrard, B., Montmessin, F., Millour, E., 2009. Amazonian northern mid-latitude glaciation on Mars: A proposed climate scenario. Icarus 203, 390–405. doi:10.1016/j.icarus.2009.04.037.
Malin, M.C., Edgett, K.S., Posiolova, L. V., McColley, S.M., Dobrea, E.Z.N., 2006. Present-day impact cratering rate and contemporary gully activity on Mars. Science (80-. ). 314, 1573–1577.
Marinova, M.M., Aharonson, O., Asphaug, E., 2008. Mega-impact formation of the Mars hemispheric dichotomy. Nature 453, 1216–1219. doi:10.1038/nature07070.
McGetchin, T.R., Settle, M., Head, J.W., 1973. Radial thickness variation in impact crater ejecta: Implications for Lunar basin deposits. Earth Planet. Sci. Lett. 20, 226– 236.
Melosh, H.J., 1989. Impact Cratering: A Geologic Process. Oxford University Press, 245 p.
Michel, P., Morbidelli, A., 2013. Population of impactors and the impact cratering rate in the inner Solar System, in: Impact Cratering: Processes and Products. pp. 21–31. doi:10.1002/9781118447307.ch2.
Mouginis-Mark, P.J., 1979. Martian fluidized crater morphology: Variations with crater size, latitude, altitude, and target material. J. Geophys. Res. 84, 8011 – 8022. doi:10.1029/JB084iB14p08011.
Mouginis-Mark, P.J., 1981. Ejecta emplacement and modes of formation of Martian fluidized ejecta craters. Icarus 45, 60–76. doi:10.1016/0019-1035(81)90006-3.
Mouginis-Mark, P.J., 1987. Water or ice in the Martian regolith?: Clues from rampart craters seen at very high resolution. Icarus 71, 268–286. doi:10.1016/0019-1035(87)90152-7.
Neumann, G.A., Zuber, M.T., Wieczorek, M.A., McGovern, P.J., Lemoine, F.G., Smith, D.E., 2004. Crustal structure of Mars from gravity and topography. J. Geophys. Res. 109, E08002. doi:10.1029/2004JE002262.
Oberbeck, V.R., 1975. The role of ballistic erosion and sedimentation in Lunar stratigraphy. Rev. Geophys. Sp. Phys. 13, 337–362.
Oberbeck, V.R., 2009. Layered ejecta craters and the early water/ice aquifer on Mars. Meteorit. Planet. Sci. 44, 43–54. doi:10.1111/j.1945-5100.2009.tb00716.x.
Osinski, G.R., 2006. Effect of volatiles and target lithology on the generation and emplacement of impact crater fill and ejecta deposits on Mars. Meteorit. Planet. Sci. 41, 1571–1586. doi:10.1111/j.1945-5100.2006.tb00436.x.
Osinski, G.R., Tornabene, L.L., Grieve, R.A.F., 2011. Impact ejecta emplacement on terrestrial planets. Earth Planet. Sci. Lett. 310, 167–181. doi:10.1016/j.epsl.2011.08.012.
Osinski, G.R., Grieve, R.A.F., Tornabene, L.L., 2013. Excavation and impact ejecta emplacement, in: Osinski, G.R., Pierazzo, E. (Eds.), Impact Cratering: Processes and Proucts. pp. 43–59.
Pierazzo, E., Melosh, H.J., 2000. Understanding oblique impacts from experiments, observations, and modeling. Annu. Rev. Earth Planet. Sci. 28, 141–167.
Pike, R.J., 1980. Control of crater morphology by gravity and target type: Mars, Earth, Moon. Proc. Lunar Planet. Sci. Conf. 11, 2159–2189.
Rossbacher, L.A., Judson, S., 1981. Ground ice on Mars: Inventory, distribution, and resulting landforms. Icarus 45, 39–59. doi:10.1016/0019-1035(81)90005-1.
Schultz, P.H., 1992. Atmospheric effects on ejecta emplacement. J. Geophys. Res. 97, 11623–11662. doi:10.1029/92JE00613.
Schultz, P.H., Gault, D.E., 1979. Atmospheric effects on martian ejecta emplacement. J. Geophys. Res. 84, 7669–7687.
Scott, D.H., Carr, M.H., 1978. Geologic map of Mars. U. S. Geol. Surv. Misc. Inv. Map I–1083.
Scott, D.H., Tanaka, K.L., 1986. Geologic map of the western equatorial region of Mars (1:15,000,000). USGS Misc. Inv. Ser. Map I-1802-A.
Shean, D.E., Head, J.W., Marchant, D.R., 2005. Origin and evolution of a cold-based tropical mountain glacier on Mars: The Pavonis Mons fan-shaped deposit. J. Geophys. Res. 110, E05001. doi:10.1029/2004JE002360.
Skinner, J.A., Hare, T.M., Tanaka, K.L., 2006. Digital renovation of the atlas of Mars 1:15,000,000-scale global geologic series maps. Lunar Planet. Sci. XXXVII Abstract #2331.
Souness, C., Hubbard, B., 2012. Mid-latitude glaciation on Mars. Prog. Phys. Geogr. 36, 238–261. doi:10.1177/0309133312436570.
Stevenson, D.J., 2001. Mars’ core and magnetism. Nature 412, 214–219. doi:10.1038/35084155.
Tanaka, K.L., 1986. The stratigraphy of Mars. J. Geophys. Res. 91, E139–E158. doi:10.1029/JB091iB13p0E139.
Tsiganis, K., Gomes, R., Morbidelli, A., Levison, H.F., 2005. Origin of the orbital architecture of the giant planets of the Solar System. Nature 435, 459–461. doi:10.1038/nature03539.
Wada, K., Barnouin-Jha, O.S., 2006. The formation of fluidized ejecta on Mars by granular flows. Meteorit. Planet. Sci. 41, 1551–1569. doi:10.1111/j.1945-5100.2006.tb00435.x.
Werner, S.C., 2009. The global martian volcanic evolutionary history. Icarus 201, 44–68. doi:10.1016/j.icarus.2008.12.019.
Williams, K.E., Toon, O.B., Heldmann, J.L., Mellon, M.T., 2009. Ancient melting of mid-latitude snowpacks on Mars as a water source for gullies. Icarus 200, 418–425. doi:10.1016/j.icarus.2008.12.013.
Wise, D.U., Golombek, M.P., Mcgill, G.E., 1979. Tectonic evolution of Mars. J. Geophys. Res. 84, 7934–7939.
Wohletz, K.H., Sheridant, M.F., 1983. Martian Rampart Crater Ejecta: Experiments and Analysis of Melt-Water Interaction. Icarus 37, 15–37.
Chapter 2
2
A Comparative Morphologic and Morphometric Study of
Double Layered Ejecta Craters in Volcanic Terrains on
Mars
2.1
Introduction
Osinski et al., 2011; Jones and Osinski, 2015), but to what extent remains largely unconstrained.
Figure 2.1: Example of a double layered ejecta crater in the Syrtis Major region
(75.46° E, 9.61° N). HRSC (IDs: H0230_0000_ND4 and H3025_0000_ND4) and
THEMIS Day IR 100m mosaic. Scale bar 10 km. North is up.
volcanic targets varies as a function of latitude. Since target material will be grossly similar on all these volcanic terrains (e.g., basaltic lavas [Scott and Tanaka, 1986; Greeley and Guest, 1987; Skinner et al., 2006; Tanaka et al., 2014]) (Table 1), any differences in morphometry (i.e. ejecta mobility and lobateness) between regions must predominately reflect other factors, such as the volatile content in the target, whether surficial or at depth, and/or the cohesiveness of the target surface.
2.2
Methodology
Robbins and Hynek (2012) classified 3413 DLE craters ≥ 1 km (up to ~50 km) in diameter. We have reevaluated each DLE crater from the Robbins Crater Database using Mars Reconnaissance Orbiter (MRO) Context Camera (CTX) (resolution 6 m/pixel) (Malin et al., 2007) and Thermal Emission Imaging System (THEMIS) visible (VIS) images (resolution 18 m/pixel) (Christensen et al., 2004), where available, as well as THEMIS daytime thermal infrared (IR) band 9 global mosaic (resolution 100 m/pixel) (Edwards et al., 2011; Hill et al., 2014) to compile a revised global database of 1351 DLE craters 1–27 km in diameter. Our revised database comprises 40% of the DLEs in Robbins database having the same diameter range. Classification was based on the original definition of Barlow et al. (2000) that a DLE possesses a distinct two-layered ejecta morphology. Using craters from our revised DLE database, we have downselected to 127 craters that specifically fall within volcanic regions. These craters range from ~3 to 25 km in diameter, retain a continuous inner and outer layer, and possess good enough image coverage to permit morphological (e.g., radial grooves) and morphometric investigations. Regions include: Tharsis, Elysium, Syrtis Major, and Hesperia (Fig. 2).
true area of an ejecta layer. The analysis includes the documentation of radial grooves (if any), as well as the measurement of the inner and outer layers to determine Ejecta Mobility (EM):
EM = average exent of ejecta layer from crater rim crater radius
and lobateness (Γ):
Γ = perimeter of ejecta layer [4π(area of ejecta layer)]12
Ejecta mobility measures the extent an ejecta layer travels from the crater rim normalized by the crater diameter (Mouginis-Mark, 1979; Costard, 1989; Barlow, 2004; Boyce et al., 2010), while lobateness (Γ) is generally characterized by the number of ejecta “lobes” or distal ramparts (Johansen, 1979; Kargel, 1986, 1989; Barlow, 1994); more specifically, lobateness mathematically represents the sinuosity of the perimeter of an ejecta blanket. For purposes of this study, we have modified the EM equation to determine an “effective” radius of an ejecta layer using the area of a circle (see also Barlow et al., 2014; Li et al., 2015):
EM = √A
π − r r
where Ais the total enclosed area inside an ejecta layer (including the crater itself), and r
is the radius of the crater. This gives a more precise average radius of an individual ejecta layer by essentially averaging every radii along the circumference of a layer.
of MOLA (1 m) (Gwinner et al., 2009). In places where there are data gaps with MOLA, elevation is interpolated from adjacent shots, which may result in an inaccurate representation of the topographic profile for a specific surface and/or failure to detect small-scale features, such as crater ramparts. HRSC DTMs are based on stereo images; therefore, HRSC elevation data are more complete then MOLA because they do not suffer from areas of interpolation due to data gaps from insufficient orbits or MOLA laser-shot coverage.
2.2.1
Study Areas
Figure 2.2: Geologic map of Mars highlighting volcanic geologic units (shades of
Figure 2.3: Representative DLEs from each study region. Scale bars 10 km. North is
up in all images. (a) N Tharsis (276.54° E, 39.73°), THEMIS Day IR 100m global
mosaic. (b) Elysium (145.63° E, 9.63°), HRSC image ID: H2973_0000_ND4. (c) S
Tharsis (301.04° E, -10.21°), CTX image ID: G22_026773_1700_XN_10S059W. (d)
Hesperia Planum (119.51° E, -23.24°), CTX mosaic:
B20_017312_1564_XN_23S240W, B18_016745_1551_XN_24S240W,
Table 2.1: Study regions showing the number of DLEs corresponding to each
geologic unit (See Scott and Tanaka, 1986 and Greeley and Guest, 1987 for full unit
descriptions). The first letter of each unit represents each geologic period: A =
Amazonian; H = Hesperian; N = Noachian.
Region # DLEs Unit Interpretation Regional interpretation
Northern Tharsis
4 Aa1 Lava flows
Generally around the Alba Patera region. Emplacement began in the early Hesperian and continues throughout the Amazonian Period (Cattermole, 1990; Schneeberger and Pieri, 1991). Four main eruptive phases: (1) fissure erupted extensive floodlike flows; (2) emplacement of pyroclastic materials; (3) voluminous lava flows erupted from a central vent; (4) effusive flows followed by collapse of summit caldera (Schneeberger and Pieri, 1991). Estimated to be hundreds of meters thick (Tanaka et al., 2014).
3 Aa3 Lava flows
3 Aam Lava flows
2 AHcf Lava flows
13 Hal Lava flows
1 Hf Interlayered lava flows and impact breccias
3 Ht2 Lava flows
3 Htl Lava flows
3 Htm Lava flows
9 Hr Lava flows
Elysium
10 Ael1 Lava flows
Bulk of edifice constructed during Noachian with episodic activity through to the Amazonian (Platz and Michael, 2011). Primarily effusive lava flows overlying heavily cratered terrain (Hartmann and Berman, 2000; Platz and Michael, 2011). Sedimentary layers possible between flows (Hartmann and Berman, 2000). Thickness estimated to be on the order of hundreds of meters (Tanaka et al., 2014).
1 Apk Diverse origins
4 Aps Diverse origins
1 AHpe Eroded material
5 Hr Lava flows
2 HNu Undivided material
1 Npld Lava flows, pyroclastic material, and impact breccias
Syrtis
Major 10 Hs Lava flows
Southern Tharsis
1 Hf Interlayered lava flows and impact breccias
Heavily fractured basement from heavy bombardment overlain by a 2 – 3 km thick friable impact generated megaregolith layer (Carr, 1986; MacKinnon and Tanaka, 1988; Davis and Golombek, 1990). Multiple lava flows superposed at surface and are estimated to be a few hundred meters thick (Davis and Golombek, 1990; Tanaka et al., 2014). Emplacement continuous since Noachian (Carr and Head, 2010).
1 Hpl3
Interbedded lava flows and sedimentary deposits
21 Hr Lava flows
6 Hsu Lava flows
2 Npl2
Interbedded lava flows and aeolian deposits
Hesperia 18 Hr Lava flows
Pyroclastic deposits from Tyrrhena Patera overlain by lava flows originating from same vent (Greeley and Crown, 1990; Crown et al., 1992; Gregg and Farley, 2006). Region estimated to be few hundred meters thick (Tanaka et al., 2014). Emplacement began in the late Noachian or early Hesperian and ceased in late Hesperian to early Amazonian (Gregg and Farley, 2006).