Measurement of
e
+e
−→
π
+π
−cross section at CMD-3
I.B.Logashenko1,2,a, R.R.Akhmetshin1, A.V.Anisenkov1, V.M.Aulchenko1,2, V.S.Banzarov1, N.S.Bashtovoy1, D.E.Berkaev1,2, A.V.Bragin1, S.I.Eidelman1,2, D.A.Epifanov5, L.B.Epshteyn1,3, A.L.Erofeev1, G.V.Fedotovich1,2, S.E.Gayazov1,2, A.A.Grebenuk1,2, D.N.Grigoriev1,2,3, E.M.Gromov1, F.V.Ignatov1, S.V.Karpov1, V.F.Kazanin1,2, B.I.Khazin1,2, A.N.Kirpotin1, I.A.Koop1,2, O.A.Kovalenko1,2, A.N.Kozyrev1, E.A.Kozyrev1,2, P.P.Krokovny1,2, A.E.Kuzmenko1,3, A.S.Kuzmin1, P.A.Lukin1,2, A.P.Lysenko1, K.Yu.Mikhailov1,2, V.S.Okhapkin1, Yu.N.Pestov1, E.A.Perevedentsev1,2, A.S.Popov1,2, G.P.Razuvaev1,2, Yu.A.Rogovsky1, A.L.Romanov1, A.A.Ruban1, N.M.Ryskulov1, A.E.Ryzhenenkov1,2, V.E.Shebalin1, D.N.Shemyakin1,2, B.A.Shwartz1,2, D.B.Shwartz1,2, A.L.Sibidanov4, P.Yu.Shatunov1, Yu.M.Shatunov1, E.P.Solodov1,2, V.M.Titov1, A.A.Talyshev1,2, A.I.Vorobiov1, Yu.V.Yudin1, and Yu.M.Zharinov1
1Budker Institute of Nuclear Physics, SB RAS, Novosibirsk, 630090, Russia 2Novosibirsk State University, Novosibirsk, 630090, Russia
3Novosibirsk State Technical University, Novosibirsk, 630092, Russia
4University of Sydney, School of Physics, Falkiner High Energy Physics, NSW 2006, Sydney, Australia 5University of Tokyo, Department of Physics, 7-3-1 Hongo Bunkyo-ku Tokyo, 113-0033, Japan
Abstract. Regular operation of the VEPP-2000 electron-positron collider started at the end of 2010 and about 60 pb−1were collected so far by the CMD-3 detector in the whole available c.m. energy range from 0.32 GeV to 2.0 GeV. One of the main goals of the experiments at VEPP-2000 is a sub-percent measurement of the e+e−→π+π−cross-section. Here we present the overview of the data analysis techniques and the preliminary results of this measurement.
1 Introduction
One of the least complicated modes of electron-positron annihilation to hadrons, e+e− → π+π−, plays a special role in apparently unrelated physics of the muon’s netic moment. The non-zero value of the anomalous mag-netic moment of muonaμis explained by the interaction
between muons and virtual fields. Within the framework of the Standard Model there are three contributions toaμ:
QED, electroweak and hadronic. Evaluations of the first two are well under control, but the hadronic contribution cannot be calculated directly due to non-perturbative na-ture of QCD (for review see [1] and references therein). However, the lowest-order hadronic contribution can be calculated using the dispersion relation:
ahadμ ;LO=
αmμ
3π 2 ∞
mpi2 ds
s2K(s)R(s),
where
R(s)=σ(e
+e−→hadrons)
e+e−→μ+μ− ,
with measured cross-sectionsσ(e+e−→hadrons) used as an input. Due to a 1/s2 factor the major part of integral comes from the low energies, where the e+e− → π+π− mode dominatesR(s). It turns out thatσ(e+e− → π+π−) attributes to about 73% ofahadμ ;LO.
ae-mail: [email protected]
The anomalous magnetic moment of muon was re-cently measured at BNL with 0.54 ppm precision [2]. This measurement generated high interest in a high precision measurement of R(s), and, in particular, of σ(e+e− →
π+π−). The most precise measurements with direct en-ergy scan were done in the previous generation of exper-iments in Novosibirsk at the VEPP-2M collider with the CMD-2 and SND detectors. The high precision measure-ments of this mode were recently performed at KLOE and BaBar experiments using initial-state radiation (ISR) tech-nique. The systematic error of all these measurements varies from 0.5% to 1.3% in theρ(770) resonance energy range. There is good overall agreement between differ-ent measuremdiffer-ents, but there are local disagreemdiffer-ents. The good reviews of the existing data are provided in the most recent calculations of the hadronic contribution toaμ[4, 5]. Even at this percent level of accuracy, the systematic error ofσ(e+e− →π+π−) gives the largest contribution of 0.27 ppm to the overall uncertainty of 0.43 ppm of the Standard model evaluation ofaμ.
The BNL measurement of aμ is 2.2 ÷2.5 ppm, or
3.3÷3.6 standard deviations above the Standard Model ex-pectation. This hint of the physics beyond SM was a strong motivation for a new experiment, now under construction at FNAL, which will measureaμwith an accuracy of 0.15 ppm, about factor 4 improvement.
DOI: 10.1051/
C
Owned by the authors, published by EDP Sciences, 2014
/2 01
epjconf 4 7200013
This is an Open Access article distributed under the terms of the Creative Commons Attribution License .0, which permits unrestricted use, distribution, and reproduction in any medium, provided the original work is properly cited.
The CMD-3 goal it to measure thee+e−→π+π−cross section with a systematic uncertainty of 0.35% at √s<1 GeV and moderately larger uncertainty at higher energies, which is about a factor of 2 improvement comparing with the previous measurement at CMD-2.
2 VEPP-2000 and CMD-3
The electron-positron collider VEPP-2000 [6, 7] was com-missioned at Budker Institute of Nuclear Physics (Novosi-birsk, Russia) in 2010. The machine covers the energy range from √s=0.32 GeV to √s=2.0 GeV. In order to reach the design luminosity in the single-bunch mode of 1032cm−2s−1at 2 GeV, the novel round beam technique in used.
Two detectors are installed in the two interaction re-gions of VEPP-2000 — CMD-3[8] and SND[9]. CMD-3 (Cryogenic Magnetic Detector) is a general purpose detec-tor (Fig. 1). The tracks of charged particles are detected by the cylindrical drift chamber with hexagonal cells. The fiducial volume for charged tracks is precisely determined by the Z-chamber, a MWPC with dual anode and cathode readout. The barrel electromagnetic calorimeter, placed outside of the superconducting solenoid (0.13X0, 13 kGs), consists of two systems: the Liquid Xenon calorime-ter (5.4X0), surrounded by the CsI crystal calorimeter (8.1X0). The LXe calorimeter has 7 layers and utilizes dual readout: the anode signals are used for a measurement of the total energy deposition, while signals from the cath-ode strips provide information about a shower profile and are used for measurement of the coordinates of photons with high precision (about 1-2 mm). The endcap BGO crystal calorimeter (13.4X0) operates in the main magnetic field. The time-of-flight system, designed to identify slow moving particles, is placed between the two layers of bar-rel calorimeter. The detector is surrounded by the muon range system.
The data taking has started at the end of 2010 and three independent data taking runs were performed so far. The whole available energy range was covered and about 60 pb−1 of integrated luminosity were collected by CMD-3. The physics program of experiments at VEPP-2000 in-cludes a high precision measurement of cross sections of various modes ofe+e− →hadrons, studies of known and searches for new vector mesons, measurement ofnn¯ and pp¯ production cross sections near threshold and searches for exotic hadrons
Two first data taking runs, 2011 and 2012, were fo-cused on the energy range above theϕ(1020) meson, √s> 1 GeV. In 2013 the energy range below theϕ(1020) meson was scanned. Between 2012 and 2013 seasons there was an important upgrade of VEPP-2000 — the installation of the energy monitoring system[3], which continuously measures beam energy concurrently with data taking using back-scattered Compton photons. The results discussed here are based on the 2013 energy scan. The data were taken in 66 energy points at energies 0.32< √s<0.984 GeV with an integrated luminosity of about 18 pb−1, 8.3 pb−1of which were taken at or nearω(782). The collected
Figure 1.CMD-3 detector: 1 – beam pipe, 2 – drift chamber, 3 – BGO calorimeter, 4 – Z-chamber, 5 – superconducting solenoid, 6 – LXe calorimeter, 7 – TOF system, 8 – CsI calorimeter, 9 – yoke. Muon range system, not shown, is placed outside the yoke.
, GeV s
0.3 0.4 0.5 0.6 0.7 0.8 0.9 1
per 20 MeVππ
σ
/
σ
Δ
0 0.01 0.02 0.03 0.04 0.05 0.06 0.07
CMD3 CMD2 BaBar KLOE
Figure 2. Expected relative statistical accuracy ofσ(e+e− →
π+π−) measured using CMD-3 2013 data in comparison with pre-vious measurements
statistics are a few times that at CMD-2 and at the level of statistics collected at BaBar and KLOE (Fig. 2).
3 Data analysis
From 2 ·109 triggers about 1.8 ·107 were selected as collinearevents with a signature of two back-to-back par-ticles with opposite charges. The selection criteria include cuts on the average momentum pavrof two particles,
andΔΘ. The fiducial volume is determined by the cut on the average polar angleΘof two particles:
1.1≤ Θ1+(π−Θ2)
2 ≤(π−1.1).
The selected sample consists of e+e− → e+e−, μ+μ−, π+π− pairs with small background (∼ 1%) from cosmic events which pass near interaction point and are misidentified as collinear events. The number of background events is determined by the analysis of the spatial distribution of the vertex, which is close to uniform for cosmic events and peaked at the interaction point for beam-originated events.
The separation of different final states is based on binned likelihood minimization. Two independent ap-proaches are used:
• the fit of two-dimensional momentum distribution
−lnL=− bins
niln ⎡ ⎢⎢⎢⎢⎢
⎢⎣
X=ee,μμ,ππ,bg
NXfX(p+,p−) ⎤ ⎥⎥⎥⎥⎥
⎥⎦+
X NX
where p+ andp−are the total momentum of a particle with positive and negative charge, respectively;
• the fit of two-dimensional energy deposition distribution
−lnL=− bins
niln ⎡ ⎢⎢⎢⎢⎢
⎢⎣
X=ee,μμ,ππ,bg
NXfX(E+,E−) ⎤ ⎥⎥⎥⎥⎥
⎥⎦+
X NX
whereE+andE− are the energy deposition in the bar-rel calorimeter of a particle with positive and negative charge, respectively.
Examples of the two-dimensional distributions used for separation of the final states are shown in Fig. 3. Sev-eral different methods are used to obtain p.d.f.s f(E+,E−) and f(p+,p−).
1. Background p.d.f.s fbg(E+,E−) and fbg(p+,p−) are
obtained from the data using a sample of the cos-mic muons which pass close enough to the beam axis, but outside the beam-crossing region. These events provide good representation of the back-ground events in the collinears sample.
2. Momentum p.d.f.s fX(p+,p−) for electron-positron,
muon and pion pairs are obtained from the Monte-Carlo. An ideal set of 2D distributions is generated with the MC code MCGPJ [10], which takes into ac-count initial and final state radiation. The same se-lection cuts as for collinear events are applied. Then the ideal distributions are convoluted with the detec-tor response functions, which take into account dif-ferent tracker performance for electrons and MIPs. Some parameters of the detector response functions remain free during likelihood minimization.
3. Energy deposition p.d.f.s for electrons (positrons) fee(E+,E−) are obtained from the data. The same
sample of collinear events is used. A particle with high energy deposition is used to tag electron
(positron) on one side, which allows one to study the energy deposition of the opposite particle. The an-alytical model for fee(E+,E−) has some parameters,
which remain free during minimization.
4. Energy deposition p.d.f.s for muonsfμμ(E+,E−) are
obtained from the Monte Carlo. A large sample of e+e− → μ+μ− events, 200000 per energy point, is generated with MCGPJ, selection cuts for collinear events are applied and the muons energy deposi-tion is tabulated. Then the tabulated p.d.f.s are con-voluted with calorimeter response, which allows to take into account difference between simulation and the data. The parameters of the response function remain free during minimization.
5. A very generic analytical model for energy deposi-tion p.d.f.s of pions fππ(E+,E−) is used, which
con-tains a contribution from minimum ionizing pions and pions, which have nuclear interactions in the detector. The model is validated with∼106tagged pions, selected fromω → 3πandϕ(1020) → 3π decays, which cover practically all momentum and angle phase space important for this measurement.
The examples of the fits are demonstrated in Fig. 4 and Fig. 5.
The pion formfactor is calculated as:
|Fπ|2= Nππ
Nee
× σee·(1+δee)·εee
σππ·(1+δππ)·εππ −Δ3π,
where the ratio Nππ/Nee is obtained from the
likeli-hood minimization,σX are the corresponding Born
cross-sections,δX are the radiative corrections,Xare the
detec-tion efficiencies which include reconstrucdetec-tion and trigger efficiencies, ΔD and ΔN are the corrections for the pion
losses caused by decays in flight and nuclear interactions respectively, andΔ3πis the correction for misidentification ofω→π+π−π0events ase+e−→π+π−. The cross section
σ(e+e−→π+π−) is related to the pion formfactor as
σ(e+e−→π+π−)=πα 2
3s β 3
π|Fπ(s)|2.
The ratio of the numbers of μ+μ− ande+e− pairs, or the measured e+e− → μ+μ− cross-section, provides strong overall systematic test, as this ratio is well known from QED.
Figure 3. Examples of two-dimensional momentum and energy deposition distributions for energy points √s=500,660,960 MeV. Black dots are data, red dots are simulation ofe+e− → μ+μ−. The energy distributions E+vs E−are at the top, the momentum distributionsp+vsp−are at the bottom.
Figure 4. Example of the fit of the two-dimensional momentum distributions for energy points √s = 360 and 500 MeV. Black histogram is the data, red line is the fit. Contributions ofe+e−(right peak),π+π−(left peak),μ+μ−(middle peak) final states and of the cosmic background (uniform-like) are also shown. Two dimensional distributions are used in fit. Here a one-dimensionalp+projection of these distributions is shown for demonstration purpose.
of the final pions should be considered as one of the pos-sible hadronic final states contributing to the total cross section. Moreover, the cross section, used in theR(s) def-inition is the bare cross section, which does not include vacuum polarization. Therefore, whenR(s) is calculated, the following bare cross sectionσ0
ππ(γ)should be used:
σ0
ππ(γ)=
πα2 3s β
3
π|Fπ(s)|2· |1−Π(s)|2·
1+απΛ(s)
,
where the|1−Π(s)|2 term excludes the effect of leptonic and hadronic vacuum polarization, and the Λ(s) term is the FSR contribution in the approximation of the point-like pions.
Figure 5.Example of the fit of the two-dimensional distributions of energy depositions for energy points√s=600 and 840 MeV. Black points are the data, blue line is the fit. Contributions ofπ+π−(red line),μ+μ−(green line) final states and of the cosmic background (dashed line) are shown as well. Two dimensional distributions are used in fit. Here a one-dimensional projections of these distributions (E−at the left andE+at the right) are shown for demonstration purpose.
the drift chamber and the barrel calorimeter, higher mag-netic field, measurement of the shower profile with layered barrel calorimeter, etc. The main expected sources of the systematic errors are the following.
1. Event separation, 0.2%. Two independent ways of event separation provide important cross-check of systematic errors.
2. Detection efficiencies, 0.2%. Both the trigger, based on the tracker data, and the reconstruction software are highly efficient for collinear events (ε >99%). There is an independent trigger mode, which uses calorimeter data, which allows to monitor the trig-ger efficiencies. The reconstruction efficiency is monitored with specially selected sample of events. There are other contributions to detection efficiency, which are final state specific: bremsstrahlung of fi-nal electrons (positrons) on the beam pipe material, pion decays in flight, hadronic interactions on pions with the beam pipe material. All these corrections are of the order of 1%, are calculated via Monte-Carlo and partially confirmed with the data.
3. Fiducial volume, 0.1%. The detector construction allows for two independent ways for precise deter-mination of the fiducial volume, using data from Z-chamber or LXe calorimeter. Mapping of detector elements usingγconversion and analysis of the
an-gular distribution of e+e− pairs provide additional systematic checks of acceptance.
4. Beam energy, 0.1%. For direct scan measurement, performed at CMD-3, it is important to know an av-erage beam energy. A dedicated system, installed at VEPP-2000 at 2012, monitors beam energy in real time with 50 keV, well within requirements for cross-section measurement.
5. Radiative corrections, 0.1%. The corrections are calculated with the MCGPJ code, mentioned above. In order to reach the required precision, it will be important to compare it to other existing approaches and software packages [11] and to perform a de-tailed comparison of the radiative tails to the data.
. The high statistics collected at CMD-3, a few times the CMD-2 data, allows one to perform more detailed system-atic studies and to reach smaller systemsystem-atic error.
4 Results and discussion
Figure 6. Preliminary results of the pion formfactor measure-ment using CMD-3 2013 data. Statistical errors are shown. Blue points — separation of the final states by momentum, red point — by energy deposition.
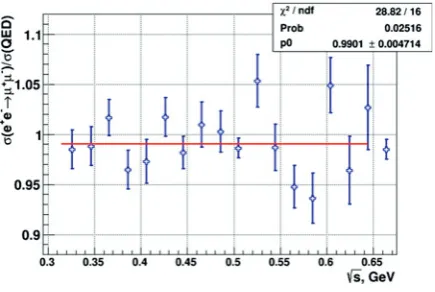
Figure 7. Ratio of the measured cross-sectione+e− →μ+μ−to the QED expectation.
the corresponding p.d.f.s are well separated and have rel-atively simple structure, nicely reproduced with Monte-Carlo simulation. At energies √s 0.7 GeV the mo-mentum resolution is not sufficient to clearly distinguish betweene,μandπ, thus the separation of the final states by energy deposition is the preferable approach. This ap-proach is applicable at lower energies as well, but its im-plementation becomes more complicated and fit becomes less stable because of the more complicated structure of the energy deposition of muons and pions. A possibility of incorporation of more variables in the likelihood fit, e.g. the shower profile or the scattering angle, is being investi-gated. That should help to increase the separation power and to extend applicability of particle separation by the
energy deposition to lower energies. In the intermediate region 0.6 ≤ √s ≤ 0.7 GeV both approaches are used simultaneously and neither has clear advantage.
The ratio ofNμμ toNee for the analysis with
momen-tum used for separation of the final states is showed in Fig. 7. This ratio is a powerful test of the overall procedure. Good agreement with the QED expectation is observed.
There are about 35 pb−1 collected at energies above √
s>1 GeV in 2011 and 2012. But these data were col-lected without beam energy monitoring system, and the trigger configuration, non-optimal for this kind of mea-surement, was used. We expect to collect an order of mag-nitude more data at these energies after VEPP-2000 up-grade, now underway, will be finished.
Acknowledgments
This work is supported in part by the RFBR grants 11-02-00112-a, 11-02-00328-a, 12-02-00065-a, 12-02-01032-a, 12-02-01250-a. 12-02-31498-mol-a, 12-02-31499-mol-a, 12-02-31501-mol-a, 13-02-00215-a, 14-02-00580-a and the DFG grant GZ: HA 1457/9-1.
References
[1] T. Blum, A. Denig, I. Logashenko, E. de Rafael, B. Lee Roberts, T. Teubner and G. Venanzoni, arXiv:1311.2198 [hep-ph].
[2] G. W. Bennettet al., Phys. Rev.D73(2006) 072003. [3] E. V. Abakumovaet al.,Phys. Rev. Lett.110(2013)
140402.
[4] K. Hagiwara, R. Liao, A. D. Martin, D. Nomura, T. Teubner,J. Phys. G38(2011) 085003.
[5] M. Davier, A. Hoecker, B. Malaescu, Z. Zhang1,Eur. Phys. J C71(2011) 1515, erratumEur. Phys. J. C72 (2012) 1874.
[6] Yu. M. Shatunov et al., Conf. Proc. C 0006262 (2000) 439.
[7] D. Berkaevet al.,Nucl. Phys. Proc. Suppl.225-227 (2012) 303.
[8] B. I. Khazinet al.,Nucl. Phys. Proc. Suppl.181-182 (2008) 376.
[9] M. N. Achasov et al., Nucl. Instrum. Meth. A598 (2009) 31.
[10] A. B. Arbuzov, G. V. Fedotovich, F. V. Ignatov, E. A. Kuraev and A. L. Sibidanov, Eur. Phys. J. C 46, 689 (2006) [hep-ph/0504233].